
J. Cent. South Univ. (2013) 20: 510�C519
DOI: 10.1007/s11771-013-1513-z

Pressure-impulse diagram with multiple failure modes of one-way reinforced concrete slab under blast loading using SDOF method
WANG Wei(��ά)1,2, ZHANG Duo(�Ŷ�)1, LU Fang-yun(¬����) 1,
TANG Fu-jing (������) 1, WANG Song-chuan(���ɴ�)
1. Institute of Technique Physics, College of Science, National University of Defense Technology, Changsha 410073, China;
2. Luoyang Institute of Hydraulic Engineering and Technology, Luoyang 470123, China
 Central South University Press and Springer-Verlag Berlin Heidelberg 2013
Abstract:
Two loosely coupled single degree of freedom (SDOF) systems were used to model the flexural and direct shear responses of one-way reinforced concrete slabs subjected to explosive loading. Blast test results show that the SDOF systems are accurate in predicting the failure mode of the slab under blast loads by incorporating the effects of the strain rate effect caused by rapid load application. Based on different damage criteria, pressure�Cimpulse (P�CI) diagrams of the two failure modes were analyzed with the SDOF systems. The effects of span length, concrete strength, and reinforcement ratio of the slab on the P�CI diagram were also investigated. Results indicate that a slab tends to fail in direct shear mode when it is of a smaller span length and tends to fail in flexure mode when it is of a larger span length. With the increase of the concrete strength or reinforced ratio, both the flexure and shear capacity increase. Based on numerical results, a simplified method and a semi analytical equation for deriving the P�CI diagram are proposed for different failure modes and damage levels.
Key words:
1 Introduction
In recent years, explosive incidents due to terrorist attack and accidental explosion have increased in the world [1�C2]. It has been recognized that assessments of structural elements and buildings under blast loading are very important for protective design.
In World War II, pressure�Cimpulse (P�CI) diagram method was first used to assess damage of structural elements and buildings [3]. The assessment of damage can be carried out by defining a serious of pressure impulse combinations to specific structures or structural elements. In protective design, P�CI diagrams have been extensively used for approximate damage assessments of structural components when subjected to blast loading. According to the P�CI diagram of a specific structure or structural element, a certain load with the peak pressure and impulse above the critical curve will result in the damage of the structures, and vice versa, the structure is safe if the peak pressure and impulse combination is located below the curve.
The early application of P�CI diagrams was based on empirically derived diagrams for brick houses to determine damage criteria for other houses, small office buildings, and light-framed industrial buildings [4]. Text books featuring P�CI diagrams (such as text books edited by Smith and Hetherington [3] and Kappos [5], are often based on equivalent single degree of freedom (SDOF) system. A great progress on developing P�CI diagrams of structure components has been made in the recent years. P�CI diagrams of rigid-plastic beams for different failure modes (e.g. shear and bending failure) have been studied by Ma et al [6]. Pulse shape influence on the P�CI diagram of the dynamic deformation has also been discussed by Youngdahl [7] and Li and Meng [8�C9]. Fallah and Louca [10] have also derived P�CI diagram from analyzing SDOF with elastic-plastic hardening and elastic-plastic softening under blast loading. Most investigations only consider an idealized triangle blast load, which is decaying with a maximum pressure at beginning. For these types of the pulse shape, the SDOF P�CI diagram is of a hyperbolic shape. When the material behavior and the pulse shape become too complex for an analytical solution, P�CI diagrams can be derived numerically, as described by Krauthammer et al [11]. It can be concluded that P�CI diagrams are generally derived from equivalent SDOF systems, which are deduced from structural components (or structures) and the dominating failure mechanism in most literatures has been assumed to be flexure [4]. However, the SDOF system oversimplifies a structural element and neglects the influence of shear force, which subsequently leads to the ignorance of shear failure. It has been observed that shear failure may occur when the ratio of span-to-height of the structural element is relatively small or when the detonation is very close to the structures [12�C13]. Recently, a few researchers have also reported their attempt to use the P�CI diagrams to evaluate damage levels of various structural members [14�C16].
Based on the experimental results for simply supported and clamped structural members, three failure modes, i.e. large ductile deformations at the mid-span, tensile tearing at the supports and transverse shear failure at the supports were classified [17]. Both the flexure and direct shear failure of structural elements under impulsive loading have been studied by many researchers with different models [6, 12, 18�C22]. However, the simplest approximation is by a SDOF simplification. The behavioral prediction by the more advanced Timoshenko beam theory has been shown by Krauthammer et al [21] to be exactly the same as that derived by the SDOF approach. In all these studies, the two failure modes of a slab to blast load, namely the direct shear failure and flexural failure, are modeled independently. This is usually acceptable because the two failure modes normally do not occur at the same time. A slab will enter the flexural response mode only if it has survived the direct shear force. The decoupling of the flexural and direct shear responses in SDOF analysis were also justified by Krauthammer et al [21].
However, the P�CI diagrams generated by the current approaches may not give reliable prediction of structure component damage because of the following reasons. the SDOF analysis is incapable of capturing a spatially and temporally varying distribution of blast loading, cannot allow for variations of mechanical properties of the cross-section along the member, cannot simultaneously accommodate shear and flexural deformations, can only address strain rate effects indirectly, and may produce very conservative answers. Most P�CI diagrams are based on the dimensionless force and impulse, and there is no efficient equation of P�CI curves specially for reinforced concrete structures with shear failure mode.
In the present work, extending the models derived by Krauthammer et al [20] and Low [22], a P�CI diagram method of one-way reinforced concrete slab based on the two loosely coupled SDOF systems incorporating the effects of the strain rate effect caused by rapid load application was developed. Two loosely coupled SDOF systems were used to model the direct shear and flexural failure modes. The results were compared with published experiment results. The effects of span length, concrete strength, and reinforcement ratio of the slab on the pressure�Cimpulse diagram were also investigated. Based on numerical results, a simplified method and a semi analytical equation for the P�CI diagram were proposed to different failure modes and damage levels.
2 Criteria for bending and shear failure
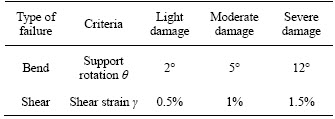
To identify structural failure, it is necessary to specify the criteria of failure according to the related experiments [23]. Since the largest ductile plastic deformation usually appears at the mid-span due to bending effects, the support rotation defined by the ratio of the calculated peak deflection to half the span length is employed as the criterion of bending failure [24]. This criterion as given in Table 1 corresponds to the experimental phenomena and theoretical derivation for reinforced concrete members.
The shear sliding at the support of beams can be expressed by
 (1)
(1)
where shear sliding ys is a cumulative quantity over the shear band, g is the average shear strain and e is the half-width of the shear band for a beam and is a function of the depth of the beam h. For clarity, a shear failure criterion for the P�CI diagram method based on the SDOF model is assumed as [6]
 (2)
(2)
In the present study, the threshold shear strain g for reinforced concrete members is listed in Table 1 [6].
Table 1 Empirical bending and shear damage criteria
3 Equivalent SDOF systems
Single degree of freedom (SDOF) models have been widely used for predicting dynamic response of concrete structures subjected to blast and impact loading. The popularity of the SDOF method in blast-resistant design lies in its simplicity and cost-effective approach that requires limited input data and less computational effort.
Two coupled SDOF systems with tri-linear resistance functions were used to represent the shear and flexural response mode of the slab, as shown in Fig. 1.
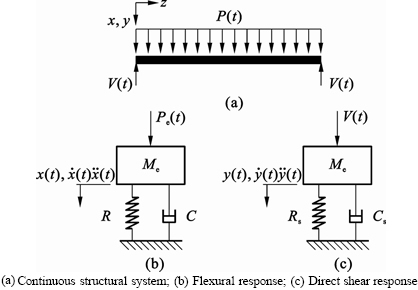
Fig. 1 Equivalent SDOF systems for structural element [20]:
The first system was used for modelling the flexural response at the point of maximum displacement along the span of the structure (i.e. at midspan as the loading and structure are symmetrical), and the second was for monitoring the direct shear response at the support.
3.1 Flexural response SDOF and resistance
The SDOF system for modelling the flexural response was based on results of Biggs [25], where the deflected shape of the structure was assumed to be the same as that resulted from the static application of the dynamic load. The equivalent mass and stiffness parameters were derived based on the mass density, elastic modulus, moment inertia, span length and boundary condition of the slab, as well as the deflection shape of the slab under distributed static load. More details can be found in Ref. [25]. The accuracy of using a SDOF system to model the slab response to blast loads was proven by Krauthammer et al [13]. The simplification for flexural response has been widely accepted and recommended in protective design manuals [24, 26�C28].
Upon transforming the structural slab into its equivalent flexural SDOF system, the governing differential equation of motion was presented as follows [20]:
 (3)
(3)
where x(t),  and
and  are the flexural displacement, velocity, and acceleration, respectively, Me is the equivalent mass of the system, R is the flexural dynamic resistance function, �ء� is the flexural damped natural circular frequency, �� is the flexural damping ratio, and Pe(t) is the equivalent forcing function. The nonlinear equation is solved numerically using the Newmark �� method. The time step is 0.1% of smallest value of natural periods and positive loading duration, which is compared to US Army approach.
The flexural resistance function (R�Cx) of concrete structures under blast load was highly nonlinear. The function of structures was assumed to be tri-linear resistance functions for one-way fixed support slab and the slope of the unloading path was the same as that of loading path [26], as shown in Fig. 2. More details can be found in the protective design manuals [26]. The strain rate effect on flexural resistance was accounted for by the use of dynamically enhanced material strengths with a constant strain rate of 100 s�C1 which was mentioned by Low and HAO [22]. This was acceptable as shown by Krauthammer [29] that a constant strain rate with a reasonable order of magnitude is sufficient to yield good results.
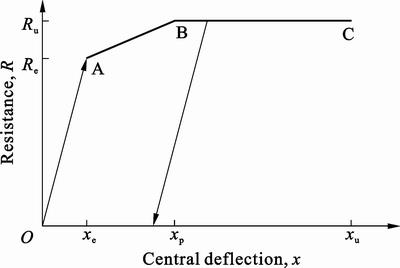
Fig. 2 Tri-linear resistance functions of one-way fixed support reinforced concrete slab
3.2 Shear response SDOF and resistance
The shear SDOF system was used to model the direct shear response of the slab. Since the direct shear mode was expected to occur within a very short duration after the initiation of the explosive loading, the structure would not have any significant deformation at that time, and because the failure plane occurred very near to the support, the phenomenon was very much like a sudden collapse of the entire slab. This implied that the shape function of the structure could be taken as unity with negligible deflection. The transformation factors for the shear mass, direct shear stiffness as well as the loading were taken as unity too [20].
The nonlinear differential equation of motion for the equivalent SDOF system was given by Krauthammer et al [20]:
 (4)
(4)
where y(t),  , and
, and are the direct shear slip, velocity and acceleration, respectively, Ms is the equivalent shear mass, Rs is the dynamic resistance function for direct shear response,
  is the natural circular frequency for direct shear response, ��s is the direct shear damping ratio, and V(t) is the dynamic shear force (or reaction) which could be computed by the forcing function P(t) and the dynamic resistance function R(t) in flexure SDOF systems as shown by Biggs [25]. This nonlinear equation for direct shear was also solved numerically using the Newmark b method and the time step was 0.1% of smallest value of natural periods and positive loading duration.
The direct shear resistance function of RC structures was not well developed and thus was more empirical. The model used, as shown in Fig. 3, was based originally on Krauthammer et al��s work [13]. It consists of five straight line segments, namely the elastic response segment OA, hardening segment AB, plastic flow segment BC, softening segment CD and final yielding segment DE. The model was developed by modifying a few existing shear stress-slip models. The elastic resistance (segment OA) is modeled by ��e given in Fig.3, for which the shear slip is up to 0.1 mm. The resistance ��e is given by  , where ��e, ��m and
 are in MPa,is the concrete cylinder strength. The segment AB starts from a shear slip of 0.1 mm to 0.3 mm and its resistance was represented by ��m as indicated in Fig.3. The maximum strength ��m is given by
  , where ��m, and fy are in MPa, ��vt is the ratio of total reinforcement area to the area of plane that it crosses and fy is the yield strength of the reinforcement crossing the plane. In the third segment BC, the shear strength remained a constant, and the point C corresponded to a shear slip of 0.6 mm. In actual application, Krauthammer et al [19] did not consider the softening region, and the model used was a tri-linear one. In the present work, the tri-linear model was used in the dynamic analysis (Fig. 3). The yielding and the maximum allowable shear slip were taken as 0.1 mm and 0.6 mm, respectively, as shown in Fig. 3. An enhancement factor of 2 was multiplied to the direct shear strength, as done by Krauthammer et al [13], to account for the rapid loading rate. This factor was indeed obtained from tests by Chung [30]. In a series of push-off tests for investigating the shear strength enhancement under dynamic load, Chung [30] reported dynamic increase factors for shear strength from 1.80 to2.02, under a stressing rate of 10 000 to 12 800 N��mm-2��s).
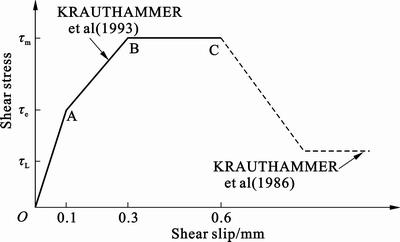
Fig. 3 Direct shear resistance model
4 Comparison with experimental data
A series of experiments with RC slabs have been conducted by Wu et al [31] to investigate the blast resistances of slabs. They were used to validate the accuracy and reliability of the two SDOF systems. Dimensions of the slab are shown in Fig. 4. These specimens were constructed with a 12 mm diameter mesh that was spaced at 100 mm centres in the major bending plane (r=1.34%) and at 200 mm centres in the minor plane (r=0.74%). The thickness of the concrete cover was 10 mm. The concrete has a cylinder compressive strength of 39.5 MPa, tensile strength of 8.2 MPa and elestic modulus of 28.3 GPa. The reinforcement has a yield strength of 600 MPa and elestic modulus of 200 GPa. The TNT explosive charges suspended above the center of the slab was used to generate the blast environment. The experimental test program was summarized in Table 2. The explosive charge was suspended above the center of the slab as described in Ref. [31].
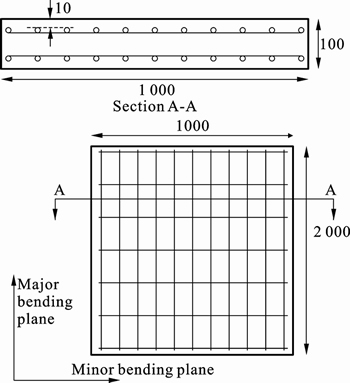
Fig. 4 Geometry of RC slab (Unit: mm)
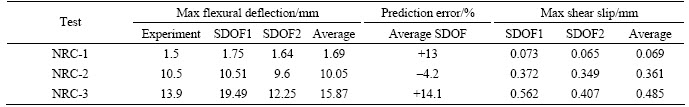
The predicted maximum center deflections and shear slips of the tests using the SDOF systems in this work were summarized in Table 3. In Table 3, the blast load history of SDOF1 was tested in the central of the slab, while blast loading history of SDOF2 was tested in the edge of the experiments. The flexural maximum deflection of the SDOF1 model was higher than the measured maximum deflection and the flexural maximum deflection of the SDOF2 model was lower than the measured maximum deflection. The SDOF1 model gave a very conservative prediction, in part because the center pressure was used in the calculation of the equivalent SDOF load. And the average deflection of the SDOF1 model and the SDOF2 model was compared well with the measured deflections. The computed shear slips were all less than 0.6 mm and no shear damage occurred, which was consistence with the experiments. It could be concluded, that the SDOF systems could well predict slabs damage under blast loading.
Table 2 Experimental air blast program
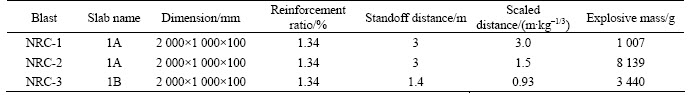
Table 3 Max deflection compared with experiments
5 P�CI diagram of two failure modes
To the authors�� knowledge, there was no analytical equation of P�CI diagram yet in the available literature to assess the different damage level of slabs under the flexural or direct shear failure using SDOF systems. Krauthammer et al [11, 13, 19, 20�C21] used SDOF and Timoshenko beam theory to model the structural behavior of slabs under blast. Although their numerical results agreed well with the test data, no P�CI diagram was given as both failure modes happen with the analytical equation and different damage levels.
The P�CI diagram has the advantage to evaluate conveniently the structural safety against blast load. Consider a case study of a Slab NRC1, detailed information of the slab used was given in Section 4. The blast load was on the assumption that uniformly distributed pressure and time history on a slab was simplified to a triangular shape as
 (5)
(5)
 (6)
(6)
where Pmax was the peak reflected pressure of the blast wave, and td is the duration for triangular loading simplification.
Figure 5 shows two light damage failure P�CI typical curves of Slab NRC1, for bending and shear failure respectively. From Fig. 5, a few important characteristics could be observed: (1) When the slab was subjected to impulsive blast load, i.e., in the impulsive loading region, it was inclined to be damaged by shear. (2) In the quasi-static region, however, the slab was likely damaged by flexural mode. (3) And in the region of dynamic loading, the failure of the slab might be a combination of shear and flexural damage.
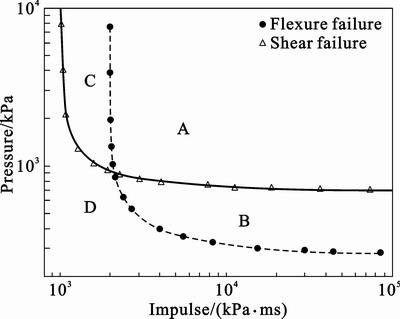
Fig. 5 P�CI diagram for flexure and shear failure mode of RC slab NRC1
There are four regions denoted, respectively, as A, B, C, and D in Fig. 5, each of which represents one particular situation for the slab. Region D represents that under the given pressure and impulse, neither shear failure nor bending failure would occur. Region B assums that by the pressure and impulse given in this region, the slab would only experience bending failure. Shear failure would not occur because the pressure and impulse of the pulse load are located below the P�CI curve which corresponds to a critical shear slide of the slab. In region C, however, the slab would suffer shear failure only. In region A, both shear failure and bending failure would occur for the slab.
With different damage levels as defined before, the P�CI diagrams were generated using SDOF systems with different failure modes for slab NRC1, as shown in Fig. 6. As can be seen from Fig. 6, the P�CI diagram contained six critical P�CI curves with different damage levels and modes: three flexure damage curves with �� equal to 2��, 5�� and 12��, respectively, and three shear damage curves with g equal to 0.5%, 1% and 1.5%, respectively. The same trend was found that it was inclined to be damaged by shear impulsive loading region and by flexural mode in the quasi-static region for different damage levels. It was seen that based on the P�CI diagram generated using the two loosed coupled SDOF systems, not only the safety of the slab could be evaluated, but also different failure modes of the slab could be identified.
Fig. 6 P�CI diagram for flexure and shear damage of RC slab NRC1
6 Analytical formulae to generate P�CI diagram
In this work, a careful examination of the fitted P�CI curves found that they could be expressed analytically as
 (7)
(7)
where n is the failure mode factor, P0 is the pressure asymptote for damage degree (kPa), I0 is the impulsive asymptote for damage degree (kPa-ms). When the failure mode is lexure mode, n equals 0.6, and when the failure mode is hear mode, n equals 0.5. The best fitted P�CI curves of NRC slab according to Eq. (7) were plotted in Fig. 7 and Fig. 8 for different damage levels and failure modes. This demonstrated that Eq. (7) could be used to model P�CI curves for the slabs with different damage levels and different load shapes.
Further study was conducted to investigate whether Eq. (7) could be used for other one-way fixed supported RC slabs. The same procedure was used to estimate damage degrees of RC slab1 under different blast loads. The slab dimensions were 2 500 mm��800 mm��150 mm, and the concrete strength and the reinforcement ratio were the same with the NRC slab. The best-fitted P�CI curves according to Eq. (7) were also plotted in Fig. 9 and Fig. 10. This shows that the P�CI curves almost fit the boundary lines between different damage levels and failure modes. This demonstrates that Eq. [7] could be used to model P�CI curves for all RC slabs.
Fig. 7 Flexure mode P�CI diagram for NRC slab (Fitting curves)
Fig. 8 Shear mode P�CI diagram for NRC slab (Fitting curves)
According to the previous discussion, the procedure to generate a P�CI diagram for a RC slab could be simplified to the following two steps:
(1) Perform the two SDOF systems to obtain the damage degrees for the RC slab under blast loads in two ranges, respectively. One is in the impulsive loading range, and the other is in the quasi-static loading range. The results (damage level) together with the pressure asymptote and impulse asymptote are then plotted in the P�CI space, as given in Table 4 and Table 5, where the subscript 01, 02 and 03 represent light damage, moderate damage and severe damage, respectively.
Fig. 9 Flexure mode P�CI diagram for RC slab1 (Fitting curves)
Fig. 10 Shear mode P�CI diagram for RC slab1 (Fitting curves)
(2) Using Eq. (7) as the regression model, obtain the best fitted P�CI curves, which are the boundaries of different damage levels.
7 Effect of different structure parameters on P�CI diagrams
Using the proposed simplified method, further studies were carried out to investigate the effect of different structure parameters on the P�CI diagram of RC slabs. The parameters investigated within the scope of this work are span length, concrete strength, reinforcement ratio.
7.1 Effect of span length
A series of simulations was run for slabs with different span lengths to investigate the effects of span length on the RC slab P�CI diagram. It should be noted that in all the cases, the two shorter sides of the slabs were fixedly supported, and the other two sides were free. The P�CI diagrams shown in Figs. 11�C13 of three RC slabs with different span lengths, i.e., 1 000, 2 000 and 4 000 mm were derived using the proposed method. The width of the slabs was all 800 mm and the thickness of the slab was 150 mm, and the concrete strength and the reinforcement ratio were the same with the RC slab1.
From Fig. 11, it could be seen that when the span length was equal to 1 m, all the shear failure curves were below the flexure failure curves. This meant that the slab was prone to be failure by shear mode in both impulse and quasi-static region. While the span length was 2 m as shown in Fig. 12, the slab was inclined to be damaged by shear in impulsive loading region and was likely damaged by flexural mode in quasi-static region as shown in section 5. When the span length was increased to 4 m, all the flexure failure curves were below the shear failure curves, as shown in Fig. 13. The slab would be failure in flexure mode in all regions.
Table 6 gives the pressure asymptotes and impulsive asymptotes of the P�CI curves, from which one could see that both the pressure asymptote and impulsive asymptote of flexure failure decreased with the span length. However, the pressure asymptote and impulsive asymptote of shear failure were opposite. This result was consistent with the fact that when the slab was longer, it was likely to be damaged by flexure failure mode, and when the slab was shorter, it was incline to be damaged by shear failure mode.
7.2 Concrete strength
Slabs with concrete strength of 30, 40 and 50 MPa were analyzed to generate the corresponding P�CI diagrams. The slab length was 2 m, the width was 800 mm, the thickness was 150 mm, and the reinforcement ratio was the same with the RC slab1. The pressure asymptotes and impulsive asymptotes of the P�CI curves were given in Table 7. It was shown that increasing the concrete strength would increase both the pressure and the impulsive asymptote of the flexure and shear P�CI curves. This could be explained by the fact that the concrete strength contributed to bending and shear strength of the slabs.
Table 4 Pressure asymptote (kPa) and impulsive asymptote (kPa��ms) for NRC slab
Table 5 Pressure asymptote (kPa) and impulsive asymptote (kPa��ms) for slab1
Fig. 11 Comparison of P�CI curves for RC slabs with span length equal to 1 m
Fig. 12 Comparison of P�CI curves for RC slabs with span length equal to 2 m
Fig. 13 Comparison of P�CI curves for RC slabs with span length equal to 4 m
7.3 Reinforcement ratio
The comparisons of the pressure asymptotes and impulsive asymptotes of P�CI curves for RC slabs with different reinforcement ratios are given in Table 8. The slab length was 2 m, the width was 800 mm, the thickness was 150 mm and the concrete strength was the same with the RC slab1. From Table 8, one could find that with the increase of the reinforcement ratio, both the pressure asymptote and impulsive asymptote of the flexure and shear P�CI curves would increase, as expected.
Table 6 Effect of span length on pressure and impulsive asymptotes
Table 7 Effect of concrete strength on pressure and impulsive asymptotes

Table 8 Effect of concrete reinforcement ratio on pressure and impulsive asymptotes
8 Conclusions
1) A simplified method to obtain P�CI diagrams with multiple failure modes of one-way reinforced concrete slab is developed by using two loosely coupled SDOF model. The computed results are validated using published test data and a good agreement is achieved. It is shown that based on the generated P�CI diagram, not only the safety of the slab can be evaluated, but also different failure modes of the slab can be identified.
2) The numerical calculation results indicate that a slab tends to fail in a direct shear mode if the blast load amplitude is high but of short duration. It tends to fail in flexural failure mode if load amplitude is relatively low and duration is relatively long. And the failure of the slab might be a combination of shear and flexural damage in the dynamic loading region. Based on the results, a simplified method and an analytical equation for the P�CI diagram for RC slabs are proposed.
3) Using the proposed simplified method, parametric studies are also carried out to study the effect of span length, concrete strength and reinforcement ratio on the P�CI diagram of the RC slabs. Results indicate that a slab tends to fail in direct shear mode when it is with a smaller span length and tends to fail in flexure mode when it is of a larger span length. With the increase of the concrete strength or reinforced ratio, both the flexure and shear capacity increase.
References
[1] HE Wei, CHEN Jian-yun, GUO Jing. Dynamic analysis of subway station subjected to internal blast loading [J]. Journal Central South University of Technology, 2011, 18: 917-924.
[2] OSTERAAS J D. Murrah building bombing revisited: A qualitative assessment of blast damage and collapse patterns [J]. J Perform Constr Facil, 2006, 20(4): 330�C335.
[3] SMITH P D, Hetherington J G. Blast and ballistic loading of structures [M]. Oxford: Butterworth- Heinemann; 1994: 1�C336.
[4] BAKER W E, Cox P A, Westine P S, Kulesz J J, Strehlow R A. Explosion hazards and evaluation [M]. Amsterdam, New York: Elsevier Scientific Pub. Co. 1983: 804�C809.
[5] KAPPOS A J. Dynamic loading and design of structures [M]. London: Spon Press, 2002: 231�C284.
[6] MA G W, Shi H J, Shu D W. P�CI diagram method for combined failure modes of rigid-plastic beams [J]. Int J Impact Eng, 2007, 34: 1081�C1094.
[7] YOUNGDAHL C K. Correlation parameters for eliminating the effect of pulse shape on dynamic plastic deformation [J]. ASME, J Appl Mech, 1970, 37: 744�C752.
[8] LI Q M, MENG H. Pressure-impulse diagram for blast loads based on dimensional analysis and single-degree-of-freedom model [J]. J Eng Mech-ASCE, 2002, 128(1): 87�C92.
[9] LI Q M, MENG H. Pulse loading shape effects on pressure-impulse diagram of an elastic-plastic, single-degree-of-freedom structural model [J]. Int J Mech Sci, 2002, 44: 1985�C1998.
[10] FALLAH A S, LOUCA L A. Pressure-impulse diagrams for elastic-plastic-hardening and softening single-degree-of-freedom models subjected to blast loading [J]. Int J Impact Eng, 2007, 34: 823�C842.
[11] KRAUTHAMMER T, ASTARLIOGLU S, BLASKO J, SOH T B, NG P H. Pressure-impulse diagrams for the behavior assessment of structural components [J]. Int J Impact Eng, 2008, 35: 771�C783.
[12] KARTHAUS W, LEUSSINK J W. Dynamic loading: more than just a dynamic load factor [C]// Proceedings of Symposium on the Interaction of Non-Nuclear Munitions With Structures. Colorado, USA, 1983: 151�C154.
[13] KRAUTHAMMER T, BAZEOS N, HOLMQUIST T J. Modified SDOF analysis of RC box-type structures [J]. J Struct Eng ASCE, 1986, 112(4): 726�C744.
[14] LAN S R, CRAWFORD J C. Evaluation of the blast resistance of metal deck proofs [C]// Proceeding of the Fifth Asia-Pacific Conference On Shock & Impact Loads On Structures. Changsha, China, 2003, 3�C12.
[15] SHI Y C, HAO H, LI Z X. Numerical derivation of pressure�Cimpulse diagrams for prediction of RC column damage to blast loads [J]. Int J Impact Eng, 2008, 35: 1213�C1227.
[16] PARK J Y, KRAUTHAMMER T. Inelastic two-degree-of-freedom model for roof frame under airblast loading [J]. Struct Eng Mech, 2009, 32: 321�C335.
[17] MENKES S B, OPAT H J. Broken beams [J]. Exp Mech, 1973, 13: 480�C486.
[18] ROSS T J. Direct shear failure in reinforced concrete beams under impulsive loading [D]. Stanford: stanford University, 1983.
[19] KRAUTHAMMER T, Assadi-Lamouki A, Shanaa H M. Analysis of impulsive loaded reinforced concrete structural elements. I: Theory [J]. Comput Struct, 1993, 48(5): 851�C860.
[20] KRAUTHAMMER T, Shahriar S, Shanaa H M. Response of reinforced concrete elements to severe impulsive loads [J]. J Struct Eng 1990, 116(4): 1061�C1079.
[21] KRAUTHAMMER T, Assadi-Lamouki A, Shanaa H M. Analysis of impulsive loaded reinforced concrete structural elements. II: Implementation [J]. Comput Struct, 1993, 48(5): 861�C871.
[22] LOW H Y, HAO H. Reliability analysis of direct shear and flexural failure modes of RC slabs under explosive loading [J]. Eng Struct, 2002, 24, 189�C198.
[23] YU J L, JONES N. Further experiment investigations on the failure of clamped beams under impact loads [J]. Int J Solids Struct, 1991, 27: 1113�C1137.
[24] ARMY T M 5-1 300. Structures to resist the effects of accidental explosions [R]. US Department of the Army, 1990.
[25] BIGGS J M. Introduction to structural dynamics [M]. New York: McGraw-Hill, 1964: 340�C342.
[26] PDC-TR 06-01 Rev 1. Methodology manual for the single degree of freedom blast effects design spreadsheets [R]. US Army Corps of Engineers. 2008.
[27] ARMY T M 5-855-1. Fundamentals of protective design for conventional weapons [R]. US Department of the Army. 1986.
[28] UFC 3-340-02 (TM5-1300). Structures to resist the effects of accidental explosions [S]. 2008.
[29] KRAUTHAMMER T. Workshop on structural concrete slabs under impulsive loads [C]// Proceedings of the Third International Conference on Structures under Shock and Impact. Madrid, 1994: 99�C106.
[30] CHUNG H W. Shear strength of concrete joints under dynamic loads [J]. J Concrete Soc, 1978, 12(3): 27�C29.
[31] WU C, OEHLERS D J, REBENTROSTt M, BURMAN N, WHITTAKER AS. Blast testing of ultrahigh performance fiber concrete slabs and FRP retrofitted RC slabs [J]. Eng Struct, 2009, 31: 2060�C2069.
(Edited by HE Yun-bin)
Foundation item: Project(JC11�C02�C18) supported by the Scientific Foundation of National University of Defense Technology, China; Project(11202236) supported by the National Natural Science Foundation of China
Received date: 2011�C12�C13; Accepted date: 2012�C03�C28
Corresponding author: LU Fang-yun, Professor, PhD; Tel: +86-13308492212; E-mail: fangyunlu@126.com
Abstract: Two loosely coupled single degree of freedom (SDOF) systems were used to model the flexural and direct shear responses of one-way reinforced concrete slabs subjected to explosive loading. Blast test results show that the SDOF systems are accurate in predicting the failure mode of the slab under blast loads by incorporating the effects of the strain rate effect caused by rapid load application. Based on different damage criteria, pressure�Cimpulse (P�CI) diagrams of the two failure modes were analyzed with the SDOF systems. The effects of span length, concrete strength, and reinforcement ratio of the slab on the P�CI diagram were also investigated. Results indicate that a slab tends to fail in direct shear mode when it is of a smaller span length and tends to fail in flexure mode when it is of a larger span length. With the increase of the concrete strength or reinforced ratio, both the flexure and shear capacity increase. Based on numerical results, a simplified method and a semi analytical equation for deriving the P�CI diagram are proposed for different failure modes and damage levels.
[5] KAPPOS A J. Dynamic loading and design of structures [M]. London: Spon Press, 2002: 231�C284.
[17] MENKES S B, OPAT H J. Broken beams [J]. Exp Mech, 1973, 13: 480�C486.
[25] BIGGS J M. Introduction to structural dynamics [M]. New York: McGraw-Hill, 1964: 340�C342.
[28] UFC 3-340-02 (TM5-1300). Structures to resist the effects of accidental explosions [S]. 2008.
