

Coupled heat/mass-balance model for analyzing correlation between
excess AlF3 concentration and aluminum electrolyte temperature
HUANG Yong-bo(��ӿ��)1, 2, QU Xiang-dong(����)2, ZHOU Jie-min(������)1
1. School of Energy Science and Engineering, Central South University, Changsha 410083, China;
2. Guangxi Branch, Aluminum Corporation of China Limited, Baise 531400, China
Received 22 May 2008; accepted 17 September 2008
Abstract:
The influence of aluminum electrolyte component on its temperature is an important issue within the field of aluminum reduction with pre-baked cells. The characteristic correlation between excess AlF3 concentration and aluminum electrolyte temperature was explored through the modeling of heat and mass transfer processes in industrial pre-baked aluminum reduction cells. A coupled heat/mass-balance model was derived theoretically from the mass and energy balance of an electrolysis cell, and then was simplified properly into a practical expression. The model demonstrates that if environmental temperature and Al2O3 concentration keep constant, the excess AlF3 concentration decreases with the aluminum electrolyte temperature linearly and its decrease rate is dependent on the heat transfer property of aluminum electrolyte, side wall and cell shell. Secondly, experiments were conducted on site with two industrial cells in an aluminum electrolysis plant. Excess AlF3 concentration and aluminum electrolyte temperature were obtained simultaneously together with other parameters such as Al2O3, CaF2, MgF2 and LiF concentrations. Results show that the maximum absolute error between the tested value and the calculated value of excess AlF3 concentration using the proposed model is less than 2%. This reveals that the coupled heat/mass-balance model can appropriately characterize the correlation between excess AlF3 concentration and aluminum electrolyte temperature with good accuracy and practicability.
Key words:
aluminum electrolysis; electrolyte temperature; excess AlF3 concentration; energy balance; mass balance; coupled model;
1 Introduction
The electrolyte temperature is one of the most important parameters to characterize the stability of an industrial pre-baked aluminum reduction cell, which can reflect the state of mass and energy transfer in a cell to a great extent[1]. Modern aluminum electrolyte is a complex system composed basically of molten cryolite and alumina, in which the cryolite acts as the flux for alumina and the alumina is the raw material for aluminum reduction. In addition, certain additives, such as, CaF2, MgF2 and LiF, are normally fed into a cell to improve the physical and chemical properties of the electrolyte and consequently change the component concentration of the electrolyte[2]. Studies have found that the electrolyte temperature during aluminum electrolysis is a multivariable function of cell structure, current intensity, electrolyte component and production operation[3]. Among the above mentioned factors, the cell structure, current intensity and production operation are usually fixed. Therefore, the investigation on the effect of electrolyte component on electrolyte temperature is of special importance to control and optimize the aluminum reduction process with pre-baked cells.
Among all the additives fed into a cell, AlF3 holds the largest proportion and gives considerable contribution to the change of electrolyte component, and then causes variations in electrolyte temperature[4-5]. The directly modified parameter due to the addition of AlF3 additive is the excess AlF3 concentration of aluminum electrolyte. As is known, the excess AlF3 concentration is related to the cryolite ratio or the acidity of electrolyte, and it is proved that there is a correlation between the acidity of electrolyte and the electrolyte temperature[6]. Therefore, the correlation between excess AlF3 concentration and electrolyte temperature can characterize the influence of the variation of electrolyte component on the electrolyte temperature [7-8]. So far, the studies on the correlation between excess AlF3 concentration and electrolyte temperature are rarely reported. McFADDEN et al[9] put forward a multivariable model to improve the control performance of the non-alumina electrolyte ingredients including excess AlF3 concentration and electrolyte temperature in aluminum reduction cells. ENTNER[10-11] proposed a linear multivariate regression model for AlF3 addition calculation from the analysis of AlF3 mass balance with time-lag reaction taken into account. Based on the ENTNER��s model, MEGHLAOUI et al[12-13] proposed an AlF3 consumption model through the mass balance and analyzed the loss of AlF3 during various physical and chemical reactions in a cell. KOLAS[14] explored the effect of adding constant-mass AlF3 on the electrolyte temperature when Al2O3 concentration kept invariable. These researches all involved in the discussion of the correlation between excess AlF3 concentration and electrolyte temperature. However, they did not establish explicit expressions between excess AlF3 concentration and electrolyte temperature in theory or by experiments.
This work explored the characteristic correlation between excess AlF3 concentration and aluminum electrolyte temperature based on the material and energy balance in an aluminum reduction cell. This is done in two steps. Firstly, a coupled heat/mass-balance model was derived in theory from the heat and mass transfer of an electrolysis cell and then a practical simplified expression was established. Secondly, the validity of the proposed model was verified by on-site experiments.
2 Theoretical modeling
The process of aluminum reduction using molten cryolite and alumina is very complex, because it involves in a lot of heat and mass transfer, chemical and electrochemical reaction and phase equilibrium. At the same time, the structure and operation of actual electrolysis cells are different from each other, so it is extremely difficult to describe the heat and mass transfer process in an electrolysis cell perfectly. The feasible method is firstly to simplify the processes in the electrolysis cell while ensuring the solution accuracy and covering the major rules, and then to obtain the corresponding physical and mathematical models for solving[15].
In an aluminum electrolysis cell, a large amount of heat from hot flux is transferred towards the side wall by convection due to the flow of liquid aluminum and molten electrolyte. In the side wall of an aluminum electrolysis cell, heat is conducted through the carbon cathode, refractory brick and insulation layer to the cell steel shell, and then is diffused into the environment mainly by convection. The temperature field in the side wall is steady when the electrolysis cell is under stable work condition. Since electrolysis cell is symmetric in structure, heat transfer parameters on the two sides and at the two ends are identical along the cross and longitudinal directions, respectively. Thereby, one- dimensional model, as shown in Fig.1, can be adopted for calculating local heat loss in an electrolysis cell. The strenuous motion of liquid aluminum and molten electrolyte results in a small difference between their temperatures. So, in this model the temperatures of liquid aluminum and molten electrolyte are considered to be uniform, and the zone of liquid aluminum and molten electrolyte in the cell is treated as an isothermal region. The calculation of temperature field in liquid aluminum and molten electrolyte is negligible[16].
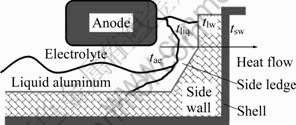
Fig.1 Heat transfer in aluminum electrolysis cell
Denote the temperature of molten electrolyte as tae, the liquidus temperature on the border of electrolyte and side ledge as tliq, the temperature on the border of side ledge and side wall as tlw, the temperature of side wall as tsw, and the environment temperature as t��. The heat transferred from liquid aluminum and molten electrolyte to side ledge is
![]() (1)
(1)
where Asl is the projection area of side ledge along the heat flow direction, and hsl is the heat convection coefficient between side ledge and liquid aluminum or molten electrolyte.
The heat transferred from the cell shell to the environment is
 (2)
(2)
where Ash is the projection area of cell shell along the heat flow direction; ��sl is the thickness of side ledge; ��sl is the heat conduction coefficient of side ledge; ��sw is the heat conduction coefficient of side wall; hair is the heat convection coefficient between cell shell and the environment.
According to the principle of heat balance, it yields:
![]() (3)
(3)
and it is obvious that
![]() (4)
(4)
Combining Eq.(1) with Eq.(4), it results in
![]() (5)
(5)
where
![]() (6)
(6)
![]() (7)
(7)
The side wall is mainly composed of carbon cathode and refractory brick, whose heat conduction coefficients are calculated as follows:
![]() (8)
(8)
![]() (9)
(9)
On the other hand, the correlation between the liquidus temperature and the electrolyte component proposed in Ref.[14] as Eq.(1) was adopted to characterize the mass balance in the electrolysis cell. By linearizing that equation around the balance point (tae, Caf, Cao)=(950, 8.5, 3.3), varying the concentration of Al2O3 between 3.3% and 5.0% and the concentration of AlF3 between 8.5% and 12.0% while keeping the con- centrations of other components constant, it results in:
![]() (10)
(10)
where �� is the correction coefficient within the range from 0.3 to 0.5.
By combining Eq.(10) with Eq.(5), it results in:
![]()
![]() (11)
(11)
Eq.(11) is the coupled heat/mass-balance model, in which excess AlF3 concentration is correlated with aluminum electrolyte temperature. It reveals that if environmental temperature and Al2O3 concentration keep constant, excess AlF3 concentration decreases with aluminum electrolyte temperature linearly and its decrease rate is dependent on the heat transfer property of aluminum electrolyte, side wall and cell shell. Eq.(11) is based on the balances of both mass and heat, so it is called the coupled heat/mass-balance model. Since the major two transfer systems in an electrolysis cell, energy and mass, are taken into account simultaneously, this model is of high accuracy. Moreover, this model is linear and polynomial, so it is practical for engineering applications.
3 Experimental verification
3.1 Test devices and conditions
In order to verify the validity of the proposed coupled heat/mass-balance model for analyzing the correlation between the excess AlF3 concentration and the aluminum electrolyte temperature, on-site experiments were carried out on 160 kA pre-baked cells in an aluminum electrolysis plant of Guangxi Province, China. The tested cells were center feeding for adding Al2O3 and other additives. The parameters of the tested cells during the experiment period are listed as follows: cell voltage is (4.18��0.02) V; liquid aluminum level is (3��1) cm; electrolyte level is (18��1) cm, and the current efficient is about 95%. The feeding amount and interval of Al2O3 and AlF3 of the tested cells are controlled automatically by the ��three-temperature optimization (TTO)�� method.
3.2 Data acquisition and processing
Parameters of two aluminum electrolysis cells are measured and analyzed at the same time. The tested two cells, named A# and B#, are both stable in operation and are identical in structure, but they are different in age. The age of cell B# is twice that of cell B#. This is arranged to compare how the correlation between excess AlF3 concentration and aluminum electrolyte temperature varies with the service time of the cell. In addition to the aluminum electrolyte temperature, concentrations of Al2O3, excess AlF3, CaF2, MgF2 and LiF were also obtained by off-line analysis of the electrolyte samples during the measurement. In view of the large time lag of electrochemical reaction in aluminum electrolysis, the experiments were conducted continuously for 15 d.
The electrolyte temperature was measured with the type N thermal couples and was indicated directly by a hand-hold digital display device. The redundancy measurement using multiple thermal couples was adopted to reduce the measurement error. Firstly, eight identical thermal couples were used to measure the electrolyte temperature at the same point in an electrolysis cell, and then four thermal couples whose reading was the most proximal to each other were selected to act as the reference. Secondly, the four reference thermal couples were adopted to measure the same electrolyte temperature simultaneously, and their average value was considered the actual value of the electrolyte temperature. During the measurement, the thermal couples were inserted with the angle of 45? into the electrolyte through the hole under the crust breaker of metal tapping. The length and the depth of insertion were about 15 cm and 10 cm, respectively. The temperatures were recorded only when the indicator��s reading was steady. If the temperatures of the same cell in consequent two days are of the difference larger than 10 ��, the temperature of the latter day is required to be remeasured and the cause should be carefully checked. If the temperature difference is induced by the anode effect, then the measured value of the previous day is taken as the electrolyte temperature. The electrolyte temperatures measured during the experiments are shown in Fig.2.
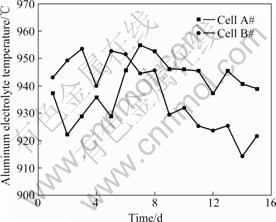
Fig.2 Aluminum electrolyte temperature in cell A# and cell B# during tested period
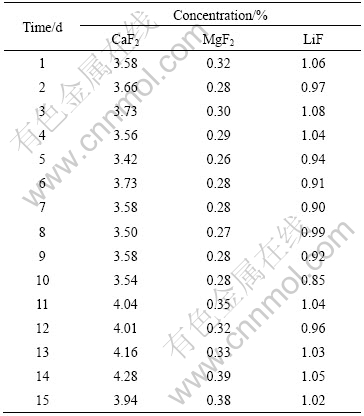
The concentrations of Al2O3, CaF2, MgF2 and LiF in the electrolyte were obtained by chemical analysis in accordance with the regulations ��the general principle and common definition of chemical analysis for metallurgy�� (GB1467��78) and ��The chemical analysis method for cryolite�� (YB122��63). The excess AlF3 concentration was acquired using the X-ray diffractometer. First of all, the electrolyte sample ground using a hermetic crushing machine was press formed by the back-holding method, and then the fluorescence intensity and diffraction intensity of the sample were measured by a PHILLIPS PW1 800 X-ray diffractometer. By comparing these measured intensities with the standard curve plotted using the prototype electrolyte with excess AlF3 concentration known, the excess AlF3 concentration of the sample was obtained. In the process of the analysis, the environment temperature was 15-27 �� with the variation less than 1 �� per 30 s, and the relative humidity was 40%-60%. The Al2O3 and excess AlF3 concentrations during the experiment period are presented in Fig.3 and Fig.4, and the concentrations of CaF2, MgF2 and LiF of cell A# and cell B# are listed in Table 1 and Table 2.
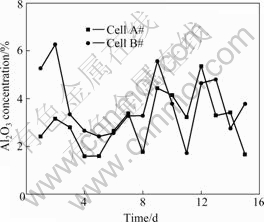
Fig.3 Al2O3 concentration in cell A# and cell B# during tested period
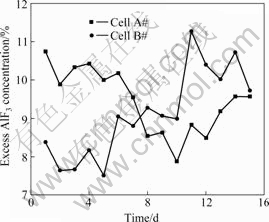
Fig.4 Excess AlF3 concentration in cell A# and cell B# during tested period
Table 1 Concentration (in mass fraction) of other additives in cell A#
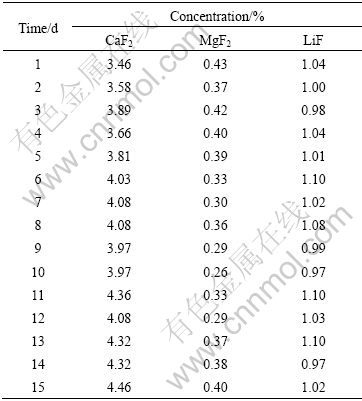
Table 2 Concentration of other additives in cell B#
From Fig.2 to Fig.4, it is seen that there exist considerable fluctuations in electrolyte temperature, Al2O3 and excess AlF3 concentrations during the tests, which provides a wide domain for the discussion of the correlation between electrolyte temperature and excess AlF3 concentration. As a whole, the relative variations of the Al2O3 concentrations in consecutive two days are more marked than those of the excess AlF3 concentrations. This reveals that in the aluminum electrolysis the consumption speed in changing the massof AlF3 is slow and the control of the concentration of AlF3 has to deal with relatively slow responses. However, the dynamics in the consumption of Al2O3 is faster, so the control of the concentration of Al2O3 has to deal with quick responses.
On the contrary, the concentrations of CaF2, MgF2 and LiF during the experiments, as listed in Table 1 and Table 2, are relatively stable. As for cell A#, the standard deviations of CaF2, MgF2 and LiF concentrations are 0.29%, 0.052% and 0.046%, respectively, respectively. The standard deviations of CaF2, MgF2 and LiF concentrations of cell B# are 0.27%, 0.040% and 0.069%. It is seen that the states of these two cells are quite similar. At the same time, these results also reveal the stabilization in production of the tested two cells during the experiments, which can effectively prevent abnormal factors from the establishment of the correlation between excess AlF3 concentration and aluminum electrolyte temperature. Therefore, the measurement results are suitable for the verification of the theoretical model.
3.3 Results discussion
Fig.5 presents the comparison results of the theoretical and experimental values for the correlation between excess AlF3 concentration and aluminum electrolyte temperature. The theoretical value was calculated from Eq.(11). In view of the specific conditions of the tested cells, the coefficients in Eq.(11) were assigned to the values as follows: t��=50 ��, Cao=3.3, ��=0.375. Fig.5 shows that the theoretical values are in good accordance with the experimental results, i.e., the experimental values distribute uniformly around the predicted line plotted according to the theoretical model. The maximal absolute errors between the theoretical and experimental values of cell A# and cell B# are 1.69% and 1.59%, which are both less than 2%. In view of the error induced by the electrolyte analysis method, the accuracy of the proposed theoretical model is quite acceptable. These results demonstrate that the coupled heat/mass-balance model can characterize the correlation between excess AlF3 concentration and aluminum electrolyte temperature accurately.
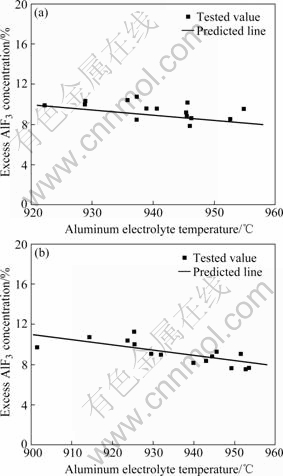
Fig.5 Relationship between aluminum electrolyte temperature and excess AlF3 concentration: (a) Cell A#; (b) Cell B#
By comparing the results of cell A# and cell B# in Fig.5, it is also found that at the same electrolyte temperature, the excess AlF3 concentrations of cell A# are slightly greater than their corresponding theoretical values on the whole, whereas the excess AlF3 concentrations of cell B# are more accordant with the theoretical values. The reason for this difference is mainly attributed to the cell age. As for normal aluminum electrolysis cells, the consumption of cryolite is small, but new cells may consume more cryolite than the old ones. This is because the carbon cathode of the new cell absorbs the cryolite and NaF remarkably during the startup of the cell, and it results in the higher excess AlF3 concentration in new cells (cell A#) than old cells (cell B#). The proposed model is based on the heat and mass stabilization of the electrolysis cell, and the average values of physical property parameters in the model are adopted from long-term normally operating cells. Therefore, the predicted result of the proposed model is closer to the cell of long age. Moreover, the effect of cell age on the predicted results could be reduced or even eliminated by adjusting the correction coefficient (��) to improve the accuracy of the theoretical model further, and this work will be carried out in the future research of the authors.
4 Conclusions
1) A coupled heat/mass-balance model for analyzing the correlation between excess AlF3 concentration and aluminum electrolyte temperature is established theoretically based on the mass and energy balance of an electrolysis cell, which is then simplified into a practical expression through certain appropriate processing.
2) The coupled heat/mass-balance model reveals that if the environmental temperature and the Al2O3 concentration maintain constant, the excess AlF3 concentration decreases with the aluminum electrolyte temperature linearly and its decrease rate is dependent on the heat transfer property of aluminum electrolyte, side wall and cell shell.
3) Experiment results show that the coupled heat/mass-balance model can properly characterize the correlation between excess AlF3 concentration and aluminum electrolyte temperature, and the maximum absolute error between the tested value and the calculated value of excess AlF3 concentration using the proposed model is less than 2%.
References
[1] EVANS J W. The evolution of technology for light metals over the last 50 years: Al, Mg, and Li [J]. JOM, 2007, 59(2): 30-38.
[2] HAUPIN W. The influence of additives on Hall-H��roult bath properties [J]. JOM, 1991, 43(11): 28-34.
[3] D J SALT. Bath chemistry control system [J]. Light Metals, 1990, 119: 369-374.
[4] LAI Yan-qing, TIAN Zhong-liang, LI Jie, YE Shao-long, LIU Ye-xiang. Preliminary testing of NiFe2O4-NiO-Ni cermet as inert anode in Na3AlF6-AlF3 melts [J]. Trans Nonferrous Met Soc China, 2006, 16(3): 654-658.
[5] KAN Hong-min, WANG Zhao-wen, BAN Yun-gang, SHI Zhong-ning, QIU Zhu-xian. Electrical conductivity of Na3AIF6-AlF3-Al2O3-CaF2- LiF(NaCl) system electrolyte [J]. Trans Nonferrous Met Soc China, 2007, 17(1): 181-186.
[6] PISKAZHOVA T V, MANN V C. The use of a dynamic aluminum cell model [J]. JOM, 2006, 58(2): 48-52.
[7] WILSON M J. Practical considerations used in the development of a method for calculating aluminum fluoride additions based on cell temperatures [J]. Light Metals, 1992, 121: 375-378.
[8] DRENGSTIG T, LJUNGQUIST D, FOSS B. On AlF3 and temperature control of aluminum electrolysis cell [J]. IEEE Transactions on Control Systems Technology, 1998, 6(2): 157-171.
[9] McFADDEN F J S, WELCH B J, AUSTIN P C. The multivariable model-based control of the non-alumina electrolyte variables in aluminum smelting cells [J]. JOM, 2006, 58(2): 42-47.
[10] ENTNER P M. Control of AlF3 concentration [J]. Light Metals, 1992, 121: 369-374.
[11] ENTNER P M. Further development of the AlF3-model [J]. Light Metals, 1993, 122: 265-268.
[12] MEGHLAOUI A, FARSI Y A A, ALJABRI N. Analytical and experimental study of fluoride evolution [J]. Light Metals, 2002, 131: 283-287.
[13] MEGHLAOUI A, ALJABRI N. Aluminum fluoride control strategy improvement [J]. Light Metals, 2003, 132: 425-429.
[14] KOLAS S. Defining and verifying the ��correlation line�� in aluminum electrolysis [J]. JOM, 2007, 59(5): 55-60.
[15] FENG Nai-xiang, LIANG Fang-hui, SUN Yang, PENG Jian-ping, LENG Zheng-xu, XIE Qing-song. Numerical calculation of thermal field and heat transfer coefficient for 160 kA aluminum reduction cell [J]. Trans Nonferrous Met Soc China, 2003, 13(4): 953-957.
[16] BRUGGEMAN J N, DANKA D J. Two-dimensional thermal modeling of the Hall-H��roult cell [J]. Light Metals, 1990, 119: 203-209.
Foundation item: Project(50376076) supported by the National Natural Science Foundation of China
Correspondence: HUANG Yong-bo; Tel: +86-776-5802842; E-mail: gx_huangyb@gx.chalco.com.cn
DOI: 10.1016/S1003-6326(08)60340-4
