

Effects of laser phase transformation hardening parameters on heat input and hardened-bead profile quality of unalloyed titanium
D. S. BADKAR1, K. S. PANDEY1, G. BUVANASHEKARAN2
1. Maulana Azad, National Institute of Technology, Bhopal- 462051, Madhya Pradesh, India;
2. Welding Research Institute, Bharat Heavy Electricals Limited, Tiruchirappalli-620014, Tamil Nadu, India
Received 13 July 2009; accepted 4 January 2010
Abstract:
Laser transformation hardening (LTH) of unalloyed titanium of 1.6 mm-thick sheet, nearer to ASTM Grade 3 of chemical composition was investigated using 2 kW CW Nd:YAG laser. The effects of laser power (750-1 250 W), scanning speed (1 000- 3 000 mm/min) and focal point position (from -10 to -30 mm) on the heat input, and hardened-bead geometry (i.e. hardened bead width (HBW), hardened depth (HD) and angle of entry of hardened bead profile with the surface (AEHB)) were investigated using response surface methodology (RSM). The experimental plan is based on Box-Behnken design matrix method. Linear and quadratic polynomial equations for predicting the heat input and the hardened bead geometry were developed. The results indicate that the proposed models predict the responses adequately within the limits of hardening parameters being used. It is suggested that regression equations can be used to find optimum hardening conditions for desired criteria.
Key words:
laser transformation hardening; response surface methodology (RSM); unalloyed titanium; titanium; hardened-bead profile;
1 Introduction
Titanium and titanium alloys are excellent candidates for aerospace applications both in airframes and engine applications owing to their high strength to mass ratio and excellent corrosion resistance. Titanium alloys were originally developed in the early 1950s for aerospace applications in which their high strength-to- density ratios were especially attractive. Although titanium alloys are still vital to the aerospace industry for these properties, recognition of the excellent resistance of titanium to many highly corrosive environments, particularly oxidizing and chloride-containing process streams, has led to widespread nonaerospace (industrial) applications[1]. Commercially pure titanium (Cp Ti) is considered to be the best biocompatible metallic material because its surface properties result in the spontaneous build-up of a stable and inert oxide layer. Commercially pure titanium and titanium alloys are known for their use in dental practice owing to their good corrosion resistance, biocompatibility, and biofunctionality in the human body[2-3].
Laser surface treatment/modification covers a wide variety of laser processing techniques by which the surface appearance or composition of the material is modified in order to improve its properties against wear or corrosion and other engineering properties. Surface medication can be achieved by remelting, surface alloying, cladding and surface transformation hardening technique. Laser surface transformation hardening (LSTH) is applied widely on alloying steel components with self hardening characteristic[4-5]. The carbon content in the material is the propelling factor in surface hardening technique. In conventional hardening technique, a hard layer is produced on plain carbon and low alloying steels of medium carbon content (0.3%- 0.6%) by rapid heating of the surface followed by water or oil quenching to form martensite. This technique is cheap; however, it cannot produce a consistent quality and is not possible to apply in selective locations. Induction hardening can offer selective hardening; however, quenching has to be carried out and titanium is a difficult candidate for hardening by this technique.
LSTH allows obtaining a hardened surface layer in titanium and its alloys by changing the base structure into hardened transformed beta martensite. Hardenability of titanium and its alloys is a phrase that refers to its ability to permit full transformation of the titanium and its alloys to transform beta (martensites, alpha) or to retain beta to room temperature[6-7]. The standard laser transformation hardening of titanium and its alloys involves two main steps: beta phase formation, in which the material is heated to/above the beta transus temperature, i.e., ��-transus (888 ?C or 1 621 ?F), in order to form the material with 100% beta phase (but below the melting point) and ��self quenching�� or cooling down, where ��-phase is transformed into harder acicular (plate-like) �� martensite (transformed ��) or retain beta to room temperature. The ��-transus is defined as the lowest equilibrium temperature at which the material is 100% beta or alpha, which does not exist. The ��-transus is critical in deformation processing and in heat treatment. A correct treatment requires the heating stage long enough for the ��-phase formation to complete and allow the alloying elements such as manganese, carbon, oxygen and nitrogen to stabilize it and dissolve iron, vanadium, molybdenum, copper, nickel and silicon into the matrix. Self quenching should be fast enough so as to suppress the normal breakdown of ��-phase into the initial �� or ��+�� phases and produce martensite instead.
Compared with standard hardening procedures, the laser techniques offer several advantages. The applied laser radiation instantaneously heats a localized region on the surface and the bulk of the material acts as an efficient heat sink producing high cooling rates[4-5]. This means that precise hardened depths can be achieved at high processing speeds and with low thermal distortion in the treated parts. In addition, it has been shown that laser surface hardening not only increases the wear and corrosion resistance but also increases the fatigue strength under certain conditions[8-9]. In this work, laser transformation hardening of unalloyed titanium, nearer to ASTM Grade 3 of chemical composition was investigated.
Laser transformation hardening with continuous wave (CW) spherical beam is characterized with semicircular hardened or fusion zone, minimum hardened depth with maximum width, and increase in hardness. The laser transformation hardening input parameters determine the shape of the laser-hardened bead due to the fact that the combination of these parameters controls the heat input. For a good hardened quality, the combination of the output power, assuming speed, focused position and position accuracy should be selected. Response surface methodology (RSM) is widely used to predict the weld-bead geometry and mechanical properties in many welding process[10-14]. In similar way here, it has been tried to optimize the laser process parameters of 2 kW Nd:YAG laser transformation hardening using CW spherical beam.
In statistical-based approaches response surface methodology has been extensively used. RSM is a collection of statistical technique for designing experiments, building models, evaluating the effects of factors and searching the optimum conditions[15]. It is a statistically designed experimental protocol in which several factors are simultaneously varied[16]. In RSM, the experimental responses to design of experiments (DOEs) are fitted to quadratic function. Many successful applications of RSM suggest that second-order relation can reasonably approximate many welding processes. In this work, RSM is used to develop the models to predict the heat input and to describe the laser hardened-bead profile parameters, hardened bead width (HBW, bhb), hardened depth (HD, dh) and angle of entry of hardened- bead (AEHB, ae) profile with the surface for CW 2 kW Nd:YAG laser transformation hardening of commercially pure titanium of 1.6 mm-thick sheet. The laser input parameters taken into consideration are laser power (LP, Pl), scanning speed (SS, vs) and focused position (FP, lf).
Sheets of titanium alloys Ti 64 and Ti 6242 are Ti-6AI-4V and Ti-6AI-2Sn4Zr2Mo which are used particularly in space laboratory chambers, air insects and fuel tanks. The diameter of these items can be up to 2 500 mm, but the thickness of the sheets is only 1.6-2 mm. Laser hardening technology was considered for the hardening of the same indicated surfaces of these components, because the heat input is much lower than that of other conventional hardening purposes in order to increase the wear and commission resistance. The distortion shrinkage and residual stress can be minimized and the mechanical properties are also excellent, consulting from the contribution of martensitic ��' due to the rapid self quenching.
The purpose of the present study is to investigate and develop the mathematical models for heat input and laser hardened bead profile parameters of laser phase transformation hardened unalloyed titanium sheet with 1.6 mm in thickness, and analyze the effects of the Nd:YAG laser phase transformation hardening parameters, such as laser power, scanning speed, and focused position on the laser heat input and hardened bead profile using RSM and multiple regression analysis.
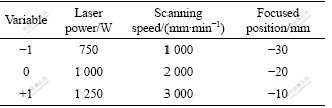
2 ExperimentalThe experiment was designed on a three level Box-Behnkin design with full replication[17]. Laser power (750-1 250 W), scanning speed (1 000-3 000 mm/min) and focused position (from -30 to -10 mm) are the laser independent input variables. Box-Behnkin designs are response surface designs specially made to require only 3 levels, coded as -1, 0, and +1. Table 1 shows the laser input variables and experimental design levels used.
Table 1 Process variables and experimental design levels used
A RSM has often been applied to optimize the formulation variables[18-19]. The optimization procedure based on RSM includes statistical experimental designs, multiple regression analysis, and mathematical optimization algorithms for seeking the best formulation under a set of constrained equations. RSM was applied to the experimental data using statistical software, Design-expert 7. Linear and second order polynomials were fitted to the experimental data to obtain the regression equations. The sequential F-test, lack-of-fit test and other adequacy measures were used in selecting the best models. A step-wise regression method was used to fit the second order polynomial Eq.(1) to the experimental data and to indentify the relevant model terms[20-21]. The same statistical software was used to generate the statistical and response plots.
![]() (1)
(1)
where Y is the response calculated by model (dependent variables); ��0 is the constant coefficient; ��i is the coefficient for the linear effect; ��ii is the coefficient for the quadratic effect; ��ij is the coefficient for the cross- product effect; Xij and Xj are the variables corresponding to factors (independent variables); �� is the error; k is the number of variables considered and i, j are the factors.
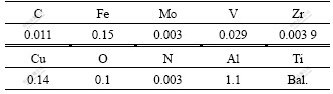
3 Experimental methodologyThe experiments are conducted on a given unalloyed titanium alloy substrate with chemical composition given in Table 2. The chemistry is nearer to ASTM Grade 3. The thickness of the substrate selected is 1.6 mm, to simulate the majority of the industrial applications that is in practice at present. For conducting the experiments on the substrate, the material surface is cleaned properly with suitable agents.
Table 2 Chemical composition of unalloyed titanium (mass fraction, %)
A CW 2 kW, with radiation wavelength ��=1.06 ?m Nd:YAG laser source from GSI Lumonics was employed for the experimental work as shown in Fig.1. The experiment was carried out according to the design matrix in a random order to avoid any systematic error. A spherical beam configuration was used throughout the study. The experiment set up is shown in Fig.2. The laser beam is transported through a fibre optic cable to the work centre. Siemens 802 CNC controller provided the process control during the experiments. The work centre has x, y and rotational movement for processing applications. The laser source, work centre and the controls are interfaced. Cooling was ensured by a chiller and a cooling tower. For the study, 120 mm focal optic was employed with varying beam spot size depending on defocus distance to obtain a wider scan area. Argon gas was employed as shielding medium with a constant flow rate throughout the experimental work. Transverse sectioned specimens were cut from laser hardened-bead on trial of unalloyed titanium sheet and mounted. Standard metallography was made for each transverse sectioned specimens. The bead profile parameters ��responses�� were measured using an optical microscope(a portable video microscope, LM525, was used for measurement with image processing computer controlled software based on LINUX OS 9.3) with digital micrometers attached to it with an accuracy of 0.001 mm, which allowed to measure directional movement in x-axes and y-axes.
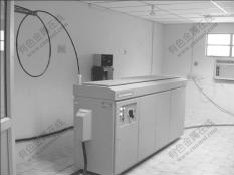
Fig.1 Solid state Nd:YAG laser source at WRI used for experimental work
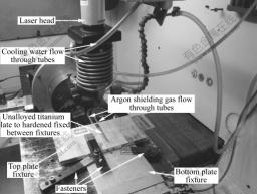
Fig.2 Experimental set-up showing laser beam head and shielding gas arrangements in working chamber
Fig.3 shows the microstructure of laser hardened- bead profile with measured parameters, such as hardened bead width, hardened depth and angle of entry of hardened bead profile for CW spherical beam. The measured laser hardened bead profile parameters ��responses�� were recorded. The design matrix and the
measured responses are listed in Tables 3 and 4.
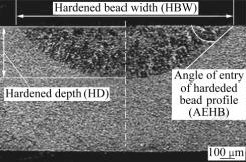
Fig.3 Microstructure of hardened-bead profile with parameters, HBW, HD and AEHB[22]
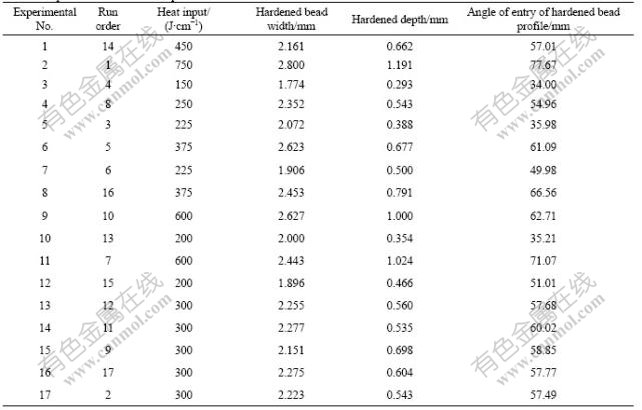
4 Results and discussionThe results of the laser hardened-bead profile were measured according to the design matrix with coded and actual independent process variables in Table 3 using the transverse sectioned specimens and the optical microscope mentioned earlier. The measured responses are listed in Table 4. Analyzing the measured responses by the Design-expert software, the fit summary output indicates that the linear model is significant for hardened bead width (HBW) (the second response), therefore it will be used for further analysis. While for the other responses, the quadratic models are statistically recommended for the further analysis.
Table 3 Design matrix with code independent process variables
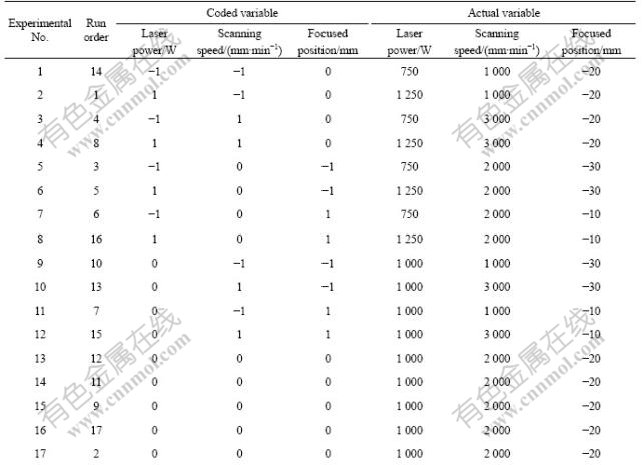
Table 4 Experimental measured responses
4.1 Analysis of variance
The adequacy of the developed models were tested using the analysis of variance technique and the results of the linear and quadratic order response surface model fitting in the form of analysis of variance are given in Tables 5-8. The test for significance of the regression models, the test for significance on individual model coefficients and the lack-of-fit test were performed using the same statistical Design-expert 7 software package. By selecting the step-wise regression method, which eliminates the insignificant model terms automatically, the resulting analyses of variance (Tables 5-8) for the response surface quadratic models summarize the analysis of variance of each response and show the significant model terms.
Table 5 Analysis of variance for heat input reduced quadratic model
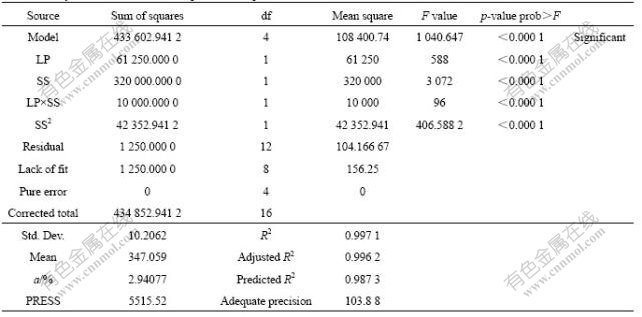
These tables also show the other adequacy measures R2, adjusted R2 and predicted R2. The coefficient of determination R2 indicates the goodness of fit for the model. In this case, all the values of coefficient of determination R2 are nearly equal to 1. Clearly, we must have 0��R2��1, with larger values being more desirable. The adjusted coefficient of determination R2 or ��adjusted�� R2 is a variation of the ordinary R2 statistic that reflects the number of factors in the model. The entire adequacy measures are close to 1, which is in reasonable agreement and indicates adequate models. The adequate precision compares the range of the predicted value at the design points with the average prediction error. Adequate precision measures signal to noise ratio. A ratio greater than 4 is desirable. In all cases the values of adequate precision are dramatically greater than 4. The adequate precision ratio above 4 indicates adequate model discrimination. Tables 5-8 also show the model terms standard, mean, a and PRESS. Standard deviation (Std. Dev.) is a square root of the error mean square, ![]() and ��a�� is the coefficient of variation, defined by
and ��a�� is the coefficient of variation, defined by ![]() where
where ![]() is the mean. The coefficient of variation, ��a��, measures the unexplained or residual variability in the data as a percentage of the mean of the response variable. At the same time a relatively lower values of the coefficient of variation, a, from the Tables 5-8 indicate improved precision and reliability of the conducted experiments. PRESS stands for prediction error sum of squares, and it is a measure of how well the model for the experiment is likely to predict the responses in a new experiment. Small values of PRESS are desirable. In all the cases the values of PRESS are considerably small.
is the mean. The coefficient of variation, ��a��, measures the unexplained or residual variability in the data as a percentage of the mean of the response variable. At the same time a relatively lower values of the coefficient of variation, a, from the Tables 5-8 indicate improved precision and reliability of the conducted experiments. PRESS stands for prediction error sum of squares, and it is a measure of how well the model for the experiment is likely to predict the responses in a new experiment. Small values of PRESS are desirable. In all the cases the values of PRESS are considerably small.
Table 6 ANOVA table for hardened bead width reduced cubic model
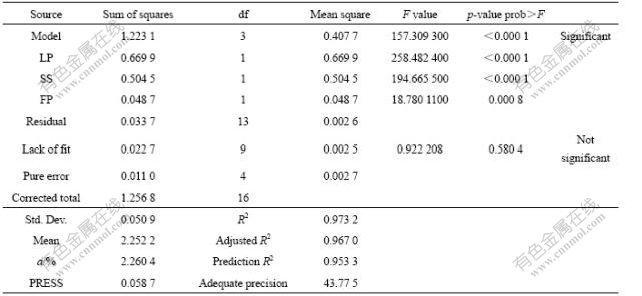
Table 7 ANOVA table for hardened depth reduced quadratic Model
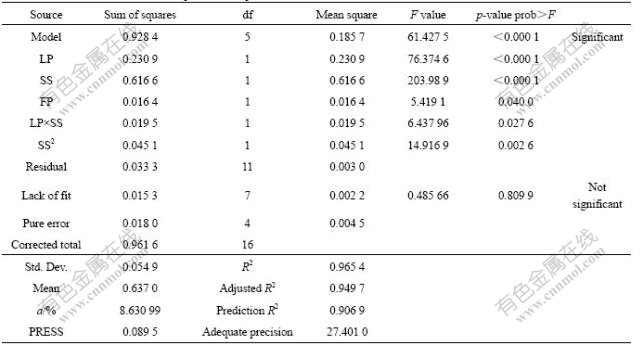
Table 8 ANOVA for angle of entry of hardened bead profile quadratic Model
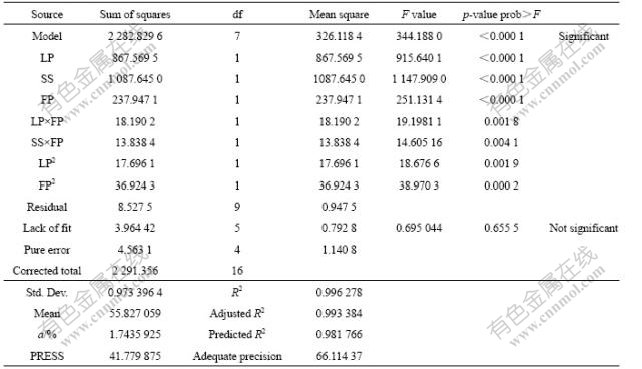
The values of ��p-value prob��F�� in Tables 5-8 for all models are less than 0.050 0, which indicates that all models are significant. In all cases the ��Lack-of-fit�� values implies the ��Lack-of-fit�� is not significant relative to the pure error. Non-significant lack-of-fit as it is desired and it is good.
Table 5 indicates that for the heat input (HI, Hi) model, the main effect of the laser power, scanning speed, two level interaction of laser power and scanning speed and the second order effect of scanning speed are the most significant model terms associated with heat input. Secondly for the hardened bead width model, from Table 6 the analysis indicated that there is a linear relationship between the main effects of the three process parameters. Also, in the case of hardened depth model, from Table 7 the main effect of laser power, scanning speed, focused position, interaction effect of laser power with scanning speed and the second order effect of scanning speed have significant effects.
However, the main effect of scanning speed and the main effect laser power are the most significant factors associated with the hardened-bead width as compared with focused position. Finally, for the angle of entry of hardened-bead profile model, it is evident that the main effect of laser, scanning speed, focused position, interaction effect of laser power with focused position, interaction effect of scanning speed with focused position, second order effect of laser power, second order effect of focused position are significant model terms. However, the main effect of scanning speed and laser power are the most important factors which influence the AEHB profile. It is observed from all models that except for the model angle of entry of hardened-bead profile, the main effect focused position has less influence, since the laser transformation hardening process itself is of heat treatment of surface layers with desired depth of penetration. In case of laser transformation hardening process the laser beam is defocused (negative focal position) instead of focused one. The final mathematical models in terms of coded factors/variables determined by design expert software are as follows:
Hi=300+87.5��Pl-200��vs-50��Pl��Vs+100��vs2 (2)
bhb=2.252 2+0.289 4��Pl-0.251��vs-0.078��lf (3)
dh=0.588 4+0.169 8��Pl-0.277 6��vs+0.045 2��lf-
0.069 7��Pl��vs+0.103 2��vs2 (4)
ae=58.182 1+10.413 7��Pl-11.660 0��vs+5.453 7��lf-
2.132 5��Pl��lf+1.860 0��vs��lf-2.047 2��Pl2-
2.957 2��lf2 (5)
While the following final empirical models are in terms of actual factors/variables:
Hi=350+0.75��Pl-0.4��vs-0.000 2��Pl��vs+0.000 1��vs2
(6)
bhb=1.441+0.001 16��Pl-0.000 251 1��vs-0.007 8��lf (7)
dh=0.409 41+0.001 23��Pl-0.000 41��vs+0.004 52��lf-
2.79��10-7��Pl��vs+1.032��10-7��vs2 (8)
ae=15.789 86+0.090 10��Pl-0.007 94��vs-0.156 51��lf-
0.000 85��Pl��lf+0.000 18��vs��lf-3.275 6��
10-5��Pl2-0.029 57��lf2 (9)
The above obtained mathematical models in terms of coded factors/variables (from Eq.(2) to Eq.(5)) are related to the coded laser process parameters and empirical models in terms of actual factors/variables (from Eq.(6) to Eq.(9)) are related to the actual (experimental) values of laser process parameters. By substituting the related values of coded variables and corresponding equivalent values of actual (experimental) variables of laser processing parameters in the mathematical models in terms of coded factors and empirical models in terms of actual factors, the corresponding output values of HI, HBW, HD and AEHB will be almost similar for the developed models of coded and actual factors/variables. The coefficient of each term in the final mathematical models in terms of coded factors and in the final empirical models in terms of actual factors as determined by design expert software are much different because coded factors values of laser process parameters are in the form of three levels -1, 0, +1; but for actual factors, laser process variables are of high values, Pl=750, 1 000, 1 250 W, vs=1 000, 2 000, 3 000 mm/min, lf=-10, -20, -30 mm for coded factors -1, 0, +1, respectively.
4.2 Validation of the models
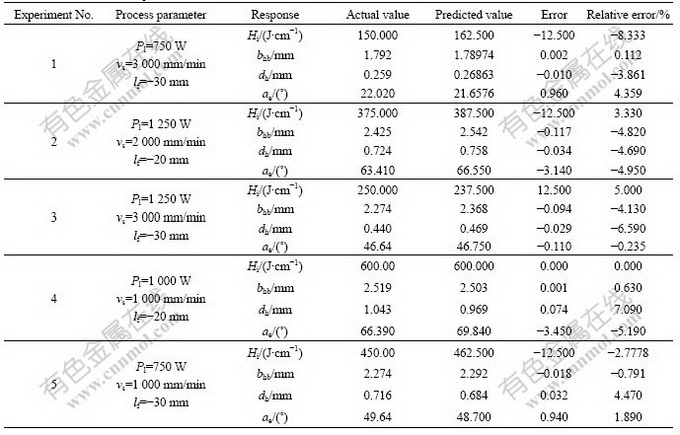
Figs.4-7 show the relationship between the actual and predicted values of the heat input (HI), hardened bead width (HBW), hardened depth (HD) and the angle of entry of hardened bead profile, respectively. This indicates that the developed models are adequate because the residuals in prediction of each response are minimum, since the residuals tend to be close to the diagonal line. Furthermore, to verify the adequacy of the developed models, five confirmation experiments were carried out using new test conditions, but were within the experimental range defined early. Using the point prediction option in the software, the HI, HBW, HD and AEHB of the validation experiments were predicted using the previously developed models. Table 9 summarizes the experiments condition, the actual experimental values, the predicted values, error and the percentages of error.z
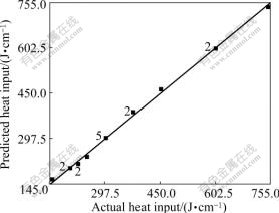
Fig.4 Scatter diagram of heat input (HI)
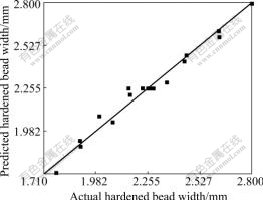
Fig.5 Scatter diagram of hardened bead width (HBW)
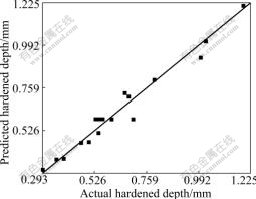
Fig.6 Scatter diagram of hardened depth (HD)
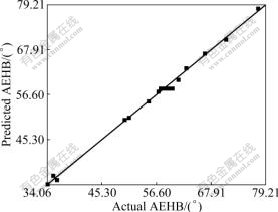
Fig.7 Scatter diagram of angle of entry of hardened bead profile
Table 9 Confirmation of experiments
 4.3 Effect of process factors on hardened-bead parameters
4.3.1 Heat Input (Hi)
The laser heat input (Hi) is directly related to the laser power (Pl) and scanning speed (vs). It can be calculated directly from the heat input Hi=Pl/vs. The reason of predicting the heat input is to develop a model to include it into optimum step in future work. From Figs.8 and 9, it is evident that as Pl increases and the vs decreases the heat input (Hi) increases.
4.3.2 Hardened bead width (bhb)
Figs.10-15 show the effect of process parameters on the hardened bead width (bhb). It is clear that the two parameters, laser power (Pl) and scanning speed (vs), significantly affect the hardened bead width (bhb) as compared with focused position (lf). From Figs.10 and 11, it is evident that the hardened bead width linearly increases with increasing LP and decreasing SS. At lower beam travel speed the time available for the laser beam to direct contact with the surface is more and hence hardened bead width increases. Therefore, the heat input decreases, leading to the less volume of the base being melted, consequently the width of the hardened zone decreases. From Figs.14 and 15, it is observed that as the SS decreases and the FP decreases (i.e. from -10 mm to -30 mm) the hardened bead width increases.
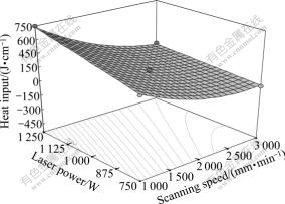
Fig.8 3D graph for effect of LP and SS on heat input
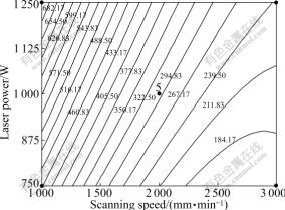
Fig.9 Contours graph for effect of LP and SS on heat input (J/cm)
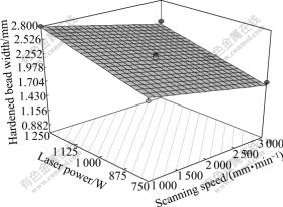
Fig.10 3D graph for effect of LP and SS on hardened bead width
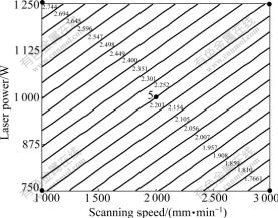
Fig.11 Contours graph for effect of LP and SS on hardened bead width (mm)
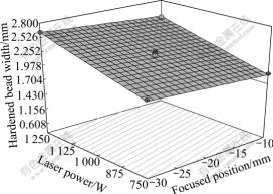
Fig.12 3D graph for effect of LP and FP on hardened bead width
The results show also that laser power (Pl) plays a very important role in the hardened bead dimensions. An increase in LP results in increase of the HBW, because of increase in the power density.
Moreover, increase in defocused beam, or decrease in focused position i.e. -10 mm, -20 mm, and -30 mm, respectively, means wide laser beam, resulting in spreading the laser power onto wide area. Therefore, wide area of the base metal will melt, leading to an increase in HBW or vise-versa. From the Figs.12 and 13 it is clear that as LP increases and FP decreases the hardened bead width (HBW) increases.
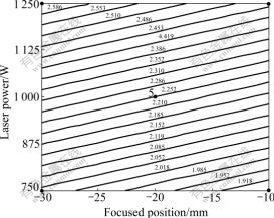
Fig.13 Contours graph for effect of LP and FP on hardened bead width (mm)
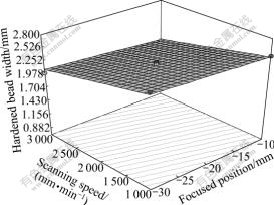
Fig.14 3D graph for effect of SS and FP on hardened bead width
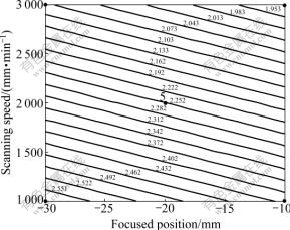
Fig.15 Contours graph for effect of SS and FP on hardened bead width (mm)
4.3.3 Hardened depth (dh)
The parameters that significantly affect the hardened depth are Pl and vs. Effect of focused position on hardened depth is significant bur it has less influence as compared with Pl and vs. These effects are due to following reasons: the increase in Pl leads to an increase in the heat input, therefore, more molten metal and consequently more dh will be achieved. However, the idea is reversed in case of vs effect, because the vs matches an opposite with heat input (Hi). From Figs.16 and 17, it is seen that dh increases as Pl increases and vs decreases. It is very important to note that in case of laser transformation hardening process main aim is to harden the surface with desired optimum depth. As much as possible instead of focusing the beam it is convenient to defocus beam with negative focal length (i.e. -10 mm, -20 mm and -30 mm), hence there is no loss of heat energy of laser beam above the focal point, since the laser beam is of converging type. Therefore, laser heat input with minimum loss will be converged and concentrated on a specified localized area with desired hardened bead width and depth without spreading of laser power. Below the focal point or focused beam, the laser beam is of divergent type, resulting in spreading of laser power with maximum loss of heat input energy. Using a focused beam results in increasing the power density, which means the heat will localize in small portion, resulting in increasing in power density and leading to better hardened bead width and depth, which is desirable for laser transformation hardening (LTH). Therefore, due to the above reasons mentioned, it may be noted that in order to achieve the desired optimum hardened width and depth, it is most convenient to defocus laser beam with negative focused position (i.e. above the focal point) for example -10 mm, -20 mm and -30 mm.
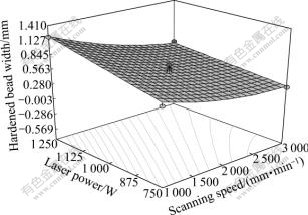
Fig.16 3D graph for effect of LP and SS on hardened depth
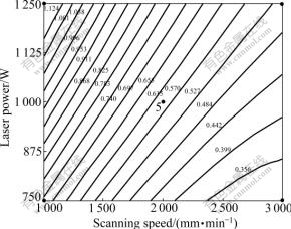
Fig.17 Contours graph for effect of LP and SS on hardened depth (mm)
From Figs.16 and 17, it is clear that hardened depth (dh) increases with increase in LP and decrease in SS. From Figs.18 and 19, as LP decreases and defocusing increases (i.e from -10 to -30 mm) the HD decreases. It is also observed from the Figs.20 and 21, it is evident that as SS increases, hardened depth (HD) decreases considerably and as FP increases hardened depth (HD) decreases marginally. From the results obtained in Table 4 and Figs.16-21, it is important to note that there is no large variation in the data of hardened depth (HD). Referring to Table 4, the range of HD lies between 0.293 and 1.191 mm and is of 0.898 mm variation only.
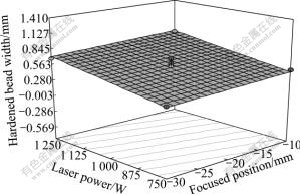
Fig.18 3D graph for effect of LP and FP on hardened depth
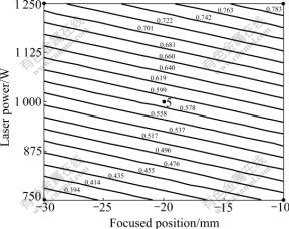
Fig.19 Contours graph for effect of LP and FP on hardened depth (mm)
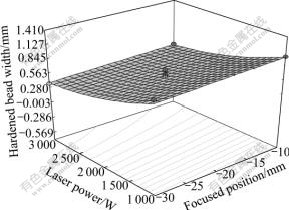
Fig.20 3D graph for effect of SS and FP on hardened depth
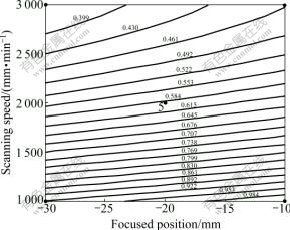
Fig.21 Contours graph for effect of SS and FP on hardened depth (mm)
4.3.4 Angle of entry of hardened bead profile (ae)
The main factor influencing the ae is the scanning speed (vs) as the results indicate. This is due to the fact that at low vs the heat input (Hi) will be greater. This large amount of heat will be conducted from the fusion zone to a greater depth of hardness, which in turn ensures the increase in the ae profile with the surface. The results also show that laser power (Pl) contribute secondary effect on ae. An increase in Pl results in the increase of ae, because power density (PD) increases the hardened depth. Moreover, defocused beam, i.e. decrease in focused position, which means wider laser beam spot, results in spreading the laser power onto wide area. Therefore, wide area of the base metal will be heated, leading to an increase in HBW and decrease in the HD, thereby decreasing the AEHB. The results also indicate that interaction effects of LP?FP and SS?FP, second order effects of Pl2 and lf2 contribute remarkable effect on ae. From Figs.22 and 23, it is evident that ae increases with increase in Pl and decrease in SS. From Figs.24 and 25, it is seen that ae decreases as the Pl increases and lf decreases from -10 mm to -30 mm. From Figs.26 and 27, it is also observed that the ae increases with decrease of vs and decrease of defocused beam.
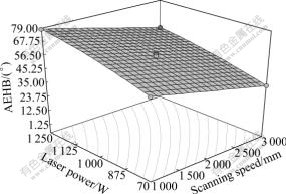
Fig.22 3D graph for effect of LP and SS on angle of entry of hardened bead profile
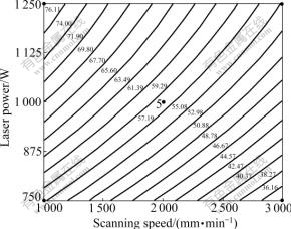
Fig.23 Contours for effect of LP and SS on angle of entry of hardened bead profile (?)
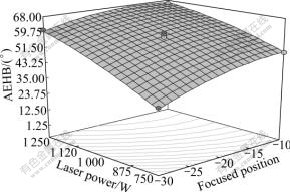
Fig.24 3D graph for effect of LP and FP on angle of entry of hardened bead profile
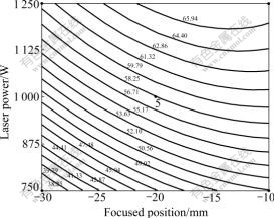
Fig.25 Contours for effect of LP and FP on angle of entry of hardened bead profile (?)
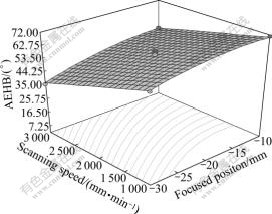
Fig.26 3D graph for effect of SS and FP on angle of entry of hardened bead profile
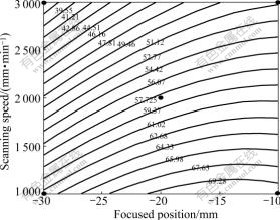
Fig.27 Contours for effect of SS and FP on angle of entry of hardened bead profile (?)
5 Conclusions1) Four models were developed for predicting the heat input (Hi), hardened bead width (bhb), hardened depth (dh), and angle of entry of hardened bead profile (ae) of the laser transformation hardened unalloyed titanium using response surface methodology (RSM).
2) Box-Behnken design can be employed to develop mathematical models for predicting laser hardened-bead geometry.
3) The desired hardened depth and width with high quality of laser transformation hardening (LTH) can be achieved by choosing the working condition using the developed models.
4) Heat input plays an important role in hardened-bead parameters dimension.
5) It is investigated that, in case of laser transformation hardening (LTH), as scanning speed increases, depth of hardening decreases and vice-versa, but we are concentrating on desired optimum minimum depth. Therefore, both scanning speed and laser power have positive effect on all the responses investigated.
6) Bead width as well as depth of hardening linearly decreases with increasing scanning speed.
7) It is evident that the bead geometry provides a useful tool to manipulate the hardened bead width and hardened depth during LTH. It is clearly observed that the hardened width linearly increases defocused beam i.e. with higher beam spot size. Depth of hardened surface increases linearly with decrease in defocused position from -30 mm to -10 mm.
AcknowledgementsThe authors thank the management of welding Research Institute, BHEL, Tiruchirappalli-620014, Tamil Nadu, India, for allowing to work in the area of laser materials processing and the constant encouragement received from the faculties of MANIT Bhopal during the course of work.
References
[1] Schutz, Ronald W. Corrosion of titanium and titanium alloys [M]// ASM Hand-book. Vol.13B. Corrosion: Materials. 2005: 252-299.
[2] ELIAS C N,LIMA J H C, VALIEV R, MEYERS M A. Biomedical applications of titanium and its alloys [J]. Journal of the Minerals, Metals and Materials Society, 2008, 60(3): 46-49.
[3] LEMONS J, VENUGOPALAN R, LUCAS L. Biomaterials evaluation [M]. New York, USA, Taylor & Francis, 1999: 155�C167.
[4] BUVANASHEKARAN G, MANOHARAN S, SAMIDURAI M. Surface hardening of carbon manganese steel using laser beam irradiation [J]. WRI Journal, 2005, 26(4).
[5] BUVANASHEKARAN G, MANOHARAN S. Studies on laser surface transformation hardening on medium carbon steel using Nd:YAG laser beam [C]// International Welding Symposium, IWS2005. Hyderabad, India, 2005: 18-20.
[6] DULEY W. Laser processing and analysis of materials [M]. New York: Plenum Press, 1983.
[7] STEEN W M. Laser materials processing [M]. 3rd Ed. London: Springer-Verlag, 2003.
[8] LO K H, CHENG F T, MAN H C. Laser transformation hardening of AISI 440C martensitic stainless steel for higher cavitation erosion resistance [J]. Surface Coating Technology, 2003, 173(1): 96-104.
[9] PANTELIS D I, BOUYLOURI E, KOULOUMBI N, VASSILIU P, KOUTSOMICHALIS A. Wear and corrosion resistance of laser surface hardened structural steel [J]. Surf Coating Tech, 2002, 161(2/3): 125-134.
[10] KIM D, RHEE S, PARK H. Modelling and optimization of a GMA welding process by genetic algorithm and response methodology [J]. Int J Prod Res, 2002, 40(7): 1699-1711.
[11] GUNARAJ V, MURUGAN N. Application of response surface methodology for predicting weld bead quality in SAW of pipes [J]. J Mater Process Technol, 1999, 88(1/3): 266-275.
[12] BENYOUNIS K Y, BETTAMER A H, OLABI A G, HASMI M S J. Predicting the impact strength of spiral-welded pipe joints I SAW of low carbon steel [C]// Proceedings of the IMC21. Limerick, Ireland, 2004.
[13] GUNARAJ V, MURUGAN N. Prediction of heat-affected zone characteristics in SAW of structural steel pipes [J]. Weld J, 2002: 94s-98s.
[14] ALLEN T T, RICHARDSON R W, TAGLIABLE D P, MAUL G P. Statistical process design for robotic GMA welding of sheet metal [J]. Weld J, 2002: 69s-77s.
[15] KALIL S J, MAUGERI F, RODRIGUES M I. Response surface analysis and simulation as a tool for bioprocess design and optimization [J]. Process Biochem, 2000, 35(6): 539-550.
[16] JAGANNADHA RAO K, CHUL-HO K, RHEE S K. Statistical optimization of medium for production of recombinant hirudin from saccharomyces cerevisia using response surface methodology [J]. Process Biochem, 2000, 35(7): 639-647.
[17] Design-expert software, version 7.1.6, User��s Guide, Technical Manual Minneapolis [M]. MN: Stat-Ease Inc., 2009.
[18] LEVISION K K, TAKAYAMA K, ISOWA K, OKABA K, NAGAI T. Formulation optimization of indomethacin gels containing a combination of three kinds of cyclic montoterpenes as percutaneous penetration enhances [J]. J Pharm Sci, 1994, 83(9): 1367-1372.
[19] SHIRAKURA O, YAMADA M, HASHIMOTO M, ISHIMARU S, TAKAYAMA K, NAGAI T. Particle size design using computer optimization technique [J]. Drug Dev Ind Pharm, 1991, 17(4): 471-483.
[20] DOUGLAS C. Montgomery, design and data analysis of experiments [M]. 5th Ed. New York: John Wiley & Sons, 2001.
[21] KHURI A I, CORNELL J A. Response surfaces design and analysis [M]. 2nd Ed. New York: Marcel Dekker, 1996.
Corresponding author: D. S. BADKAR; E-mail: dsbadkar_2007@yahoo.co.in
DOI: 10.1016/S1003-6326(09)60261-2
(Edited by LI Xiang-qun)
Abstract: Laser transformation hardening (LTH) of unalloyed titanium of 1.6 mm-thick sheet, nearer to ASTM Grade 3 of chemical composition was investigated using 2 kW CW Nd:YAG laser. The effects of laser power (750-1 250 W), scanning speed (1 000- 3 000 mm/min) and focal point position (from -10 to -30 mm) on the heat input, and hardened-bead geometry (i.e. hardened bead width (HBW), hardened depth (HD) and angle of entry of hardened bead profile with the surface (AEHB)) were investigated using response surface methodology (RSM). The experimental plan is based on Box-Behnken design matrix method. Linear and quadratic polynomial equations for predicting the heat input and the hardened bead geometry were developed. The results indicate that the proposed models predict the responses adequately within the limits of hardening parameters being used. It is suggested that regression equations can be used to find optimum hardening conditions for desired criteria.
