
J. Cent. South Univ. Technol. (2010) 17: 13-18
DOI: 10.1007/s11771-010-0003-9 ![]()
Characterization of stress corrosion crack growth of 304 stainless steel by electrochemical noise and scanning Kelvin probe
ZHAO Ru(����)1, ZHANG Zheng(����)2, SHI Jiang-bo(ʯ����)1, TAO Lei(����)1, SONG Shi-zhe(��ʫ��)1, 3
1. School of Materials Science and Engineering, Tianjin University, Tianjin 300072, China;
2. Institute of Seawater Desalination and Multipurpose Utilization, State Oceanic Administration Tianjin,
Tianjin 300192, China;
3. State Key Laboratory for Corrosion and Protection of Metals, Shenyang 110016, China
? Central South University Press and Springer-Verlag Berlin Heidelberg 2010
Abstract:
The fatigue pre-cracking 304 stainless steel (SS) specimens with lengths of 1.002 mm (L-crack) and 0.575 mm (S-crack) were prepared. Their corrosion behavior was studied by electrochemical noise (EN) in 4 mol/L NaCl + 0.01 mol/L Na2S2O3 solution under slow-strain-rate-testing (SSRT) conditions. Moreover, the characteristics of L-crack��s surface morphology and potential distribution with scanning Kelvin probe (SKP) before and after SSRT were also discussed. Compared with S-crack, L-crack is propagated and the features of crack propagation can be obtained. After propagation, the noise amplitudes increase with increasing stress and accelerating corrosion, the white noises at low and high frequencies (WL and WH) of the later stage are one order of magnitude larger than that at early stage in the current power spectral densities (PSDs). The potential PSDs also increase, but WH disappears. In addition, the crack propagation can be demonstrated according to variation of probability distribution, surface morphology and potential distribution.
Key words:
1 Introduction
Austenitic stainless steels, such as 304 stainless steel (SS) and 316SS have been widely used in many industrial applications because of their suitable mechanical properties, good fabricability and weldability, and excellent resistance to general corrosion. However, in some environments, the stress corrosion cracking (SCC) of austenitic stainless steels may occur when an alloy is simultaneously subjected to the tensile stress and a specific corrosive medium. SCC is a well known corrosion process, which can cause the failure of structures and their components [1-2]. Timely detection and proper action will reduce the cost of damage, and in some cases even prevent the occurrence of disastrous events.
Electrochemical noise (EN) measurement has proved to be one of the most promising methods for detecting localized types of corrosion [3-4], such as pit [5-6] and SCC [7-8]. EN is useful in revealing the initiation mechanisms of SCC. So far, several studies using EN techniques have been conducted aiming at detecting SCC behaviors. KIM et al [9] obtained some interesting results about an initiation and a propagation of Pb-assisted SCC of intact C-ring alloy 600 in a simulated environment of steam generator sludge piles. ARGANIS-JUAREZ et al [10] detected the EN characteristics of intergranular SCC and transgranular SCC of 304SS in simulated environment of boiling water reactor (BWR) by using long-term EN measurements. ANITA et al [11] reported that the visual records, the statistical parameters and the current power spectral density (PSD) were good indicators of the corrosion process. SHI et al [12] obtained some results about the film breakdown behaviors of intact 321SS involved in SCC by electrochemical potential noise (EPN). According to those results, EN appears to be able to successfully indicate SCC susceptibility. The SCC detection of intact specimen by EN mainly focuses on the crack initiation. Actually, there are many specimens with crack or innate defect that are vulnerable to SCC. It is necessary not only to detect the nucleation of the crack but also to estimate the propagation directly. So, the research on the behavior of small crack material under stress has great theoretical and practical significance. However, the report is hardly found.
The main aim of this work is to study SCC growth of specimens with different fatigue pre-cracking lengths by EN and scanning Kelvin probe (SKP) method [13]. It is expected that the study will make a contribution to detecting crack propagation.
2 Experimental
2.1 Specimens and solution preparation
The material used was 304SS alloy (chemical composition, in mass fraction, %: C, ��0.080%; Cr, 18.0%-20.0%; Ni, 8.00%-11.0%; Mn, ��2.0%; Si, ��1.0%; P, ��0.045%; S, ��0.03%; Fe, balance), which was supplied by Taiyuan Steel Company in China. The specimens of 120 mm��15 mm��1 mm were cut from 304 plates, and a small 3.00 mm��0.18 mm notch was machined in the middle of specimens by wire cut electrical discharge machining (WEDM). The fatigue pre-cracking specimens were made by an INSTRON 8562 fatigue machine and a QUESTAR remote measuring system, whose lengths were 1.002 and 0.575 mm, respectively. The specimen with long crack was named as L-crack, and S-crack referred to the short fatigue pre-cracking. By rubbing out the notch in the middle of specimens and perforating at both ends, the specimens were used to study the features of SCC growth for the SSRT experiment.
The test solution was 4 mol/L NaCl aqueous solution containing 0.01 mol/L Na2S2O3. The solution was made from analytical grade reagents and distilled water. The tests were carried out at ambient temperature.
2.2 Techniques
Slow strain rate test (SSRT) was conducted using SCC-I stress corrosion test system at 1��10-4 mm/s in 4 mol/L NaCl + 0.01 mol/L Na2S2O3 solution. The EN measurements were performed with a ZF-3 potentiostat and a homemade test system called NI Compact FieldPoint, and the EN data were collected using a sampling frequency of 2 Hz. The Sb electrode was used as reference electrode (-331 mV vs saturated calomel electrode (SCE) in this solution) and a small area platinum electrode as counter electrode (the low counter/ work area ratio minimized polarization over the steel electrode). The electrochemical current noise (ECN) and EPN were measured simultaneously in the zero resistance ammeter mode. The morphologies of the specimens were examined by Olympus optical microscope BX51Mt.
The Kelvin probe in M370 scanning electrochemical workstation was used. The Kelvin scanning direction is shown in Fig.1, which displays the probe scanning along x-axis, moving along y-axis from the crack tip to the root of notch A��B. The scanning mode is ��sweep�� in surface morphology image, and potential distribution is ��step�� in potential map.
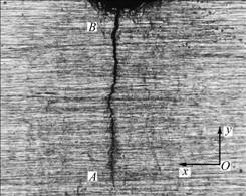
Fig.1 Sketch map of Kelvin scanning direction
3 Results and discussion
3.1 Features of crack propagation by electrochemical noise
Fig.2 shows variation of stress with time, and Fig.3 demonstrates variation of potential and current density with time. It is found that the corrosion potential of L-crack shifts negatively and its corrosion current density increases remarkably with increasing stress, which means that it is in active state. However, the potential of S-crack changes little and basically keeps stable, while its corrosion current density increases to a less extent with increasing stress, indicating that the state of S-crack has no obvious change. The results show that the longer the crack length, the lower the corrosion potential. In order to analyze different behaviors, the EN data of potential and current density in 1 024 s are analyzed respectively at the early-stage marked by 1 and the later-stage marked by 2 in Fig.3.
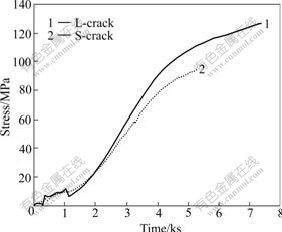
Fig.2 Variation of stress with time during SSRT for L-crack and S-crack in 4 mol/L NaCl + 0.01 mol/L Na2S2O3 solution
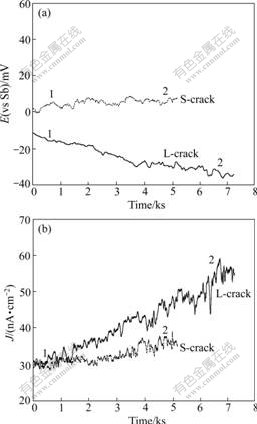
Fig.3 Variation of potential (a) and current density (b) with experimental time during SSRT for L-crack and S-crack in 4mol/L NaCl+0.01mol/L Na2S2O3 solution: 1��Early-stage; 2��Later-stage
3.1.1 Time domain and frequency domain analysis
EPN and ECN of L-crack and S-crack in time domain at stages 1 and 2 were analyzed. It is found that the noise amplitude of current density at stage 2 increases markedly than that at stage 1, and noise fluctuation is in the slow frequency, indicating that the state of L-crack surface is changed after the tensile test. Compared with L-crack, the spectra of S-crack are obvious different. The noise amplitude and the noise fluctuation of stage 2 change little, indicating that the state of S-crack does not change. But a small transient peak appears, indicating that S-crack is about to change.
It is well known that the localized corrosion is initiated easily on crack-tip because of larger stress and higher activity in this area. With increasing tensile stress, surface film of crack-tip breaks down, and then corrosion is accelerated, leading to the increase of noise amplitude. Since Cl- continuously spreads to the occluded region where crack forms, the crack begins to grow. After a period of dissolution, corrosion products may increase, making material transfer rate slow down. At this time, the noise fluctuation is in the low frequency. According to these analyses, the crack of L-crack propagates, but that of S-crack does not propagate. S-crack is inspected after experiment, and plastic deformation is found in its perforated area, so the stress of crack-tip is not large enough to make crack propagation.
Potential and current density PSDs obtained by fast Fourier transformation (FFT) are shown in Fig.4. Table 1 lists the parameters from PSDs. In frequency domain, PSDs values of potential (see Fig.4(a)) and current density (see Fig.4(b)) for L-crack at stage 2 are larger than those at stage 1, exhibiting ��white noise�� which is independent of frequency in low frequency region (WL), but the potential PSD at high frequency is in linear downward, without ��white noise�� in high frequency region (WH). According to data in Table 1, W��L and W��H in PSDs of current density including WL in PSD of potential are one order of magnitude larger than those at stage 2. All these features can be attributed to the crack propagation. However, according to PSDs (see Figs.4(c) and (d)) and the parameters in Table 1, the state of S-crack has no obvious changes.
Table 1 Parameters from PSDs
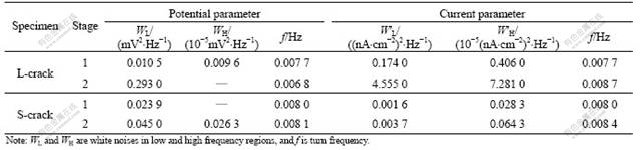
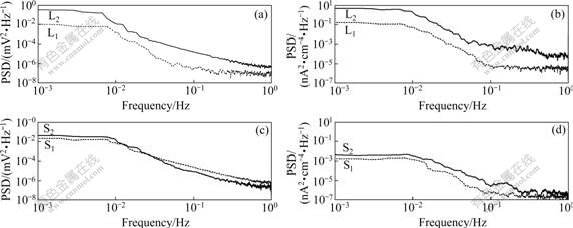
Fig.4 Potential and current density PSDs for L-crack ((a), (b)) and S-crack ((c), (d)) at early-stage (1) and later-stage (2) of experiment
3.1.2 Probability distribution analysis
Probability distribution was introduced to analyze the EN data by GABRIELLI et al [14] and ROBERGE [15], which intuitively showed the distribution of EN signal amplitude. Fig.5 intuitively shows the variation of probability distribution potential and current at stages 1 and 2. Compared Figs.5(a) and (b) with Figs.5(c) and (d), it is easy to note that if the crack does not propagate, the current density and potential probability distributions mainly distribute around zero, and the peak value does not move and increase. Based on probability density variation, L-crack grows because the potential peak moves to the left (see Fig.5.(a)), while the concentration of current density is high and its peak moves to the right at stage 2 (see Fig.5(b)). However, the similar changes of S-crack are not obvious.
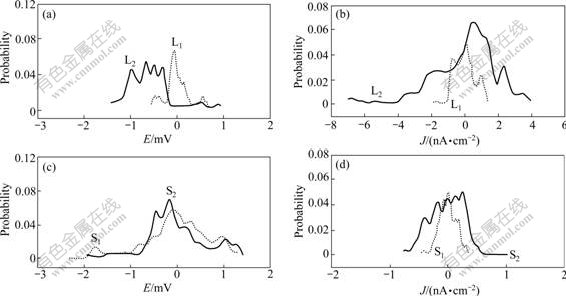
Fig.5 Probability distribution of potential and current density for L-crack ((a), (b)) and S-crack ((c), (d) at stages 1 and 2
3.2 Morphology analysis
The morphologies of L-crack and S-crack before and after SSRT are shown in Fig.6. Compared Fig.6(a) with Fig.6(b), the width of crack increases for L-crack, and its length increases by 1.103 mm, which also confirms the growth of crack after experiment. However, the crack length of S-crack does not increase obviously, as shown in Figs.6(c) and (d). The results are consistent with the EN analysis.
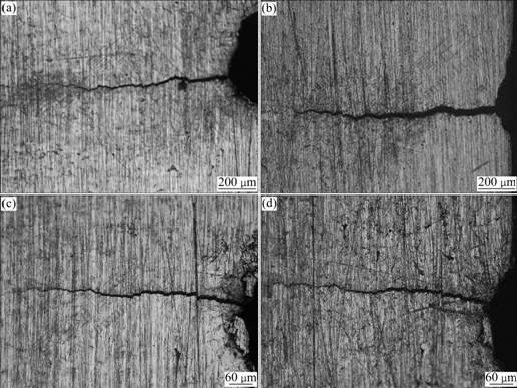
Fig.6 Morphologies of L-crack ((a), (b)) and S-crack ((c), (d)) before and after SSRT respectively in 4 mol/L NaCl+0.01 mol/L Na2S2O3 solution
3.3 Characteristics of cracking propagation by SKP
Fig.7 shows surface morphologies and potential distributions of L-crack before and after SSRT experiments. Fig.7(a) and Fig.7(c) present surface morphologies of L-crack before and after SSRT experiments, where different grays from shallow to deep refer to the distance with probe from far to near, which provides an intuitive picture about the changes of crack deformation region. The white region on left side is the notch made by WEDM, and the light gray region is a plastic deformation region caused by the crack growth. Comparing Fig.7(a) with Fig.7(c), the scanning area significantly expends from 1.4 mm��1.0 mm to 2.2 mm��2.0 mm, and the distance with probe also increases from 12 to 23 mm. After SSRT, the plastic deformation region of crack on the specimen surface is increased so that the deformation is larger. It is obvious that the deformation of S marked in Fig.7(c) is significantly larger than that of K in Fig.7(a).
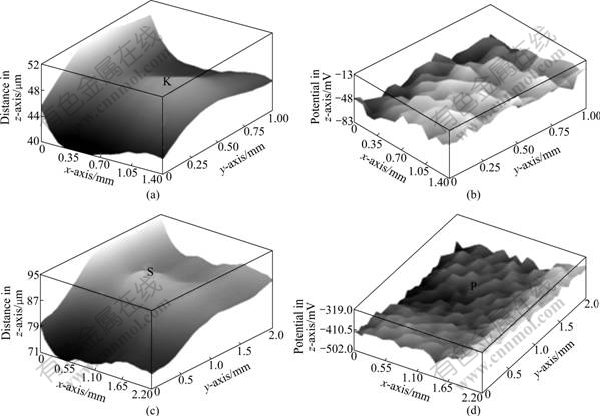
Fig.7 Surface morphologies and potential distributions of L-crack before and after SSRT (z-axis shows distance (mm) between probe and specimen in surface morphology image, while it represents potential (mV) in potential map): (a) Surface morphology before experiment; (b) Potential distribution before experiment; (c) Surface morphology after experiment; (d) Potential distribution after experiment
Fig.7(b) and Fig.7(d) show potential maps of L-crack, where different grays from shallow to deep represent potential from high to low. Surface morphologies exactly match potential distribution maps. Comparing Fig.7(b) with Fig.7(d), the measured Kelvin potential on deformation area shifts negatively after SSRT. Moreover, the potential difference increases from 70 to 183 mV, which is attributed to corrosion reaction of specimen occurring at crack tip. The length of negative potential region increases from 0.35 to 1.2 mm, and the width increases from 1 to 2 mm, indicating that not only the crack width increases, but also the length changes. This is similar to the morphology analysis. After SSRT, the less negative potential of -502.0 mV in region P marked in Fig.7(d) is corresponding to the largest deformation region S marked in Fig.7(c), indicating that the crack extends the trend of moving. Surface potential distribution can be a direct reflection of the crack growth after tensile test. SKP method can qualitatively characterize the surface morphology and potential distribution before and after tensile test.
4 Conclusions
(1) Based on time and frequency domain analysis, various features of different fatigue pre-cracking 304SS specimens at the early-stage and the later-stage are obtained by EN in solution of 4 mol/L NaCl+0.01 mol/L Na2S2O3 under SSRT condition. After propagation, the noise amplitude increases with increasing stress and accelerating corrosion, parameters WL and WH at later stage are one order of magnitude larger than those at the early stage in the current density PSDs, the potential PSDs also increase, but WH disappears.
(2) The probability distribution plot is able to provide useful information about corrosion process of specimen according to the position of maximum relative probability distribution, and the evolution of crack propagation according to the variation of probability distribution.
(3) SKP method is also applied to demonstrating crack growth according to the variation of surface morphology and potential distribution before and after experiment.
References
[1] TURNBULL A. Modeling of environment assisted cracking [J]. Corrosion Science, 1993, 34(6): 921-960.
[2] LEBAN M, BAJT ?, LEGAT A. Detection and differentiation between cracking processes based on electrochemical and mechanical measurements [J]. Electrochimica Acta, 2004, 49(17/18): 2795-2801.
[3] GIRIJA S, KAMACHI-MUDALI U, RAJU V R, DAYAL R K, KHATAK H S, RAJ B. Determination of corrosion types for AISI type 304L stainless steel using electrochemical noise method [J]. Materials Science and Engineering A, 2005, 407(1/2): 188-195.
[4] AL-MAZEEDI H A A, COTTIS R A. A practical evaluation of electrochemical noise parameters as indicators of corrosion type [J]. Electrochimica Acta, 2004, 49(17/18): 2787-2793.
[5] CAO F H, ZHANG Z, CHENG Y L, WANG J M, ZHANG J Q, CAO C N. Electrochemical noise features of pure aluminum during pitting corrosion in neutral NaCl solution [J]. Acta Metallurgica Sinica: English Letters, 2003, 16(1): 22-32.
[6] ZHANG T, SHAO Y, MENG G, WANG F H. Electrochemical noise analysis of the corrosion of AZ91D magnesium alloy in alkaline chloride solution [J]. Electrochimica Acta, 2007, 53(2): 561-568.
[7] KOVA��C J, LEBAN M, LEGAT A. Detection of SCC on prestressing steel wire by the simultaneous use of electrochemical noise and acoustic emission measurements [J]. Electrochimica Acta, 2007, 57(27): 7607-7616.
[8] DURAN M G, MACDONALD D D. Stress corrosion cracking of sensitized type 304 stainless steel in thiosulphate solution (��): Dynamics of fracture [J]. Corrosion Science, 2006, 48(7): 1608-1622.
[9] KIM S W, KIM H P. Electrochemical noise analysis of PbSCC of alloy 600 SG tube in caustic environments at high temperature [J]. Corrosion Science, 2009, 51(1): 191-196.
[10] ARGANIS-JUAREZ C R, MALO J M, URUCHURTU J. Electrochemical noise measurements of stainless steel in high temperature waters [J]. Nuclear Engineering and Design, 2007, 237(24): 2283-2291.
[11] ANITA T, PUJAR M G, SHAIKH H, DAYAL R K, KHATAK H S. Assessment of stress corrosion crack initiation and propagation in AISI type 316 stainless steel by electrochemical noise technique [J]. Corrosion Science, 2006, 48(9): 2689-2710.
[12] SHI Z M, SONG G L, CAO C N, LIN H C, LU M. Electrochemical potential noise of 321 stainless steel stressed under constant strain rate testing conditions [J]. Electrochimica Acta, 2007, 52(5): 2123-2133.
[13] NAZAROV A, THIERRY D. Application of Volta potential mapping to determine metal surface defects [J]. Electrochimica Acta, 2007, 52(27): 7689-7696.
[14] GABRIELLI C, HUET F, KEDDAM M, KEDDAM M, OLTRA R. A review of the probabilistic aspects of localized corrosion [J]. Corrosion, 1990, 46(4): 266-278.
[15] ROBERGE P R. Analysis of electrochemical noise by the stochastic process detector method [J]. Corrosion, 1994, 50(7): 502-512.
Foundation item: Project(2006CB605004) supported by the National Basic Research Program of China
Received date: 2009-05-25; Accepted date: 2009-08-31
Corresponding author: SONG Shi-zhe, Professor; Tel: +86-22-27407338; E-mail: szsong@tju.edu.cn
(Edited by CHEN Wei-ping)
Abstract: The fatigue pre-cracking 304 stainless steel (SS) specimens with lengths of 1.002 mm (L-crack) and 0.575 mm (S-crack) were prepared. Their corrosion behavior was studied by electrochemical noise (EN) in 4 mol/L NaCl + 0.01 mol/L Na2S2O3 solution under slow-strain-rate-testing (SSRT) conditions. Moreover, the characteristics of L-crack��s surface morphology and potential distribution with scanning Kelvin probe (SKP) before and after SSRT were also discussed. Compared with S-crack, L-crack is propagated and the features of crack propagation can be obtained. After propagation, the noise amplitudes increase with increasing stress and accelerating corrosion, the white noises at low and high frequencies (WL and WH) of the later stage are one order of magnitude larger than that at early stage in the current power spectral densities (PSDs). The potential PSDs also increase, but WH disappears. In addition, the crack propagation can be demonstrated according to variation of probability distribution, surface morphology and potential distribution.
