
J. Cent. South Univ. (2016) 23: 497-507
DOI: 10.1007/s11771-016-3095-z

Modeling on dynamic recrystallization of aluminium alloy 7050 during hot compression based on cellular automaton
LI Jun-chao(�����), XIE Zhi-yuan(л־Զ), LI Song-pu(������), ZANG Yan-yan(�����)
College of Material Science and Engineering, Chongqing University, Chongqing 400044, China
 Central South University Press and Springer-Verlag Berlin Heidelberg 2016
Abstract:
The dynamic recrystallization (DRX) process of hot compressed aluminium alloy 7050 was predicted using cellular automaton (CA) combined with topology deformation. The hot deformatation characteristics of aluminium alloy 7050 were investigated by hot uniaxial compression tests in order to obtain the material parameters used in the CA model. The influences of process parameters (strain, strain rate and temperature) on the fraction of DRX and the average recrystallization grain (R-grain) size were investigated and discussed. It is found that larger stain, higher temperature and lower strain rate (less than 0.1 s�C1) are beneficial to the increasing fraction of DRX. And the deformation temperature affects the mean R-grain size much more greatly than other parameters. It is also noted that there is a critical strain for the occurrence of DRX which is related to strain rate and temperature. In addition, it is shown that the CA model with topology deformation is able to simulate the microstructural evolution and the flow behavior of aluminium alloy 7050 material under various deformation conditions.
Key words:
cellular automaton; dynamic recrystallization; aluminium alloy 7050; flow stress��
1 Introduction
Aluminum alloy 7050 is a typical structural material with high strength and toughness, and it is widely used in automotive and aviation industry [1�C3]. In order to meet the ever-increasing requirements of the synthetic property of aluminum alloy, grain refinement is an available approach which is mostly induced by large plastic deformation [4�C5]. For most metals and alloys, the refined grains are dependent heavily on the occurrence of dynamic recrystallization (DRX) during hot working [6�C8]. Therefore, it is of great significance to anticipate and manage the microstructure evolution of aluminum alloys undergoing hot deformation. For the purpose of fulfilling this target, process parameters including strain, temperature and strain rate, should be reasonably arranged [9�C10]. As DRX is a complex dynamic process [11�C12], it is time-consuming and costly if various combinations of process parameters are successively tried out in a traditional manner. In recent years, cellular automaton (CA) method has been applied to investigate the complex microstructural evolution during dynamic recrystallization because of its high efficiency and flexibility [13�C15]. DING and GUO [16] coupled metallurgical principles with the CA method to predict the microstructural evolution and the flow stress of copper under kinds of working conditions, and the simulated values are in agreement with the experimental results. CHEN et al [17] also adopted the CA method to simulate the DRX of 30Cr2Ni4MoV rotor steel and the microstructure evolution before DRX was considered. XIAO et al [18] realized the microstructure evolution of DRX by integrating a CA model with the topology deformation technique which is based on vector operation. Although most experimental researches have been carried out on the flow behavior and microstructural evolution of aluminium alloy 7050 [9�C10, 19�C21], few attempts are made on the simulation of DRX of this material. HUANG et al [22] developed a CA program to research the influence of the deformation parameters on the fraction of DRX and the mean size of recrystallized grain (R-grain) for aluminium alloy 7050. However, the topology deformation was neglected in his simulation. As a result, the numerical result might not be completely in accordance with the experimental process and further developments on the simulation method are needed.
In this work, a CA model with a 2D matrix coupling with a topology deformation technology was established based on the platform of MATLAB and used to estimate the DRX behavior of aluminium alloy 7050. The hot compression tests of aluminum alloy 7050 were conducted to obtain the material parameters and the constitutive model for the CA simulation. Then, the process of CA simulation was developed including the topology deformation, followed by the CA simulation results of microstructural evolution. And the influences of process parameters including strain, stain rate and temperature on the percentage of DRX and the mean R-grain size of 7050 material were analyzed and discussed.
2 Experiments and constitutive model
2.1 Experiments of hot compression tests of aluminum alloy 7050
A series of uniaxial hot compression tests of aluminum alloy 7050 was conducted to obtain the material parameters for the CA simulation. The cylindrical specimens have a diameter of 10 mm and a height of 15 mm. The chemical composition of aluminium alloy 7050 (mass fraction, %) is shown in Table 1. All the hot compression tests were performed on a Gleeble-1500 thermo-simulation machine in the temperature range of 300 ��C�C450 ��C and in the strain rate range of 0.01 s�C1 to 10 s�C1.
Table 1 Chemical composition of 7050 aluminium alloy (mass fraction, %)
Each specimen was heated to a required deformation temperature at an increasing rate of 3 ��C/s, and then was held for 5 min to eliminate the unevenness. In order to minimize the influence of the friction between the specimen and the die on the stress state, thin graphite flakes were placed between the specimen and the punch. Additionally, argon atmosphere was assured to prevent from oxidation during the test, and the samples were taken out quickly and quenched with room temperature water when the amount of deformation reached 85%.
Figure 1 shows the true stress�Cstrain curves achieved from hot compression tests of aluminium alloy 7050 at various temperatures and strain rates. On the whole, with the increase of strain, the stress increases at first. Then the increasing rate of the flow stress slows down. After experiencing a peak value, the flow stress decreases or directly goes to a relatively steady state. In addition, the flow stress increases with the increase of the strain rate at a given temperature and decreases with the rising temperature when the strain rate is fixed. Further, when the strain rate  the flow stress lowers down evidently after a peak value, which indicates the occurrence of DRX during hot deformation. In general, at a given temperature, the higher the strain rate, the later the DRX. However, when the strain rate
 the significant drop of the flow stress does not occur and the flow stress peak value is immediately maintained, which presents a phenomenon of dynamic recovery.
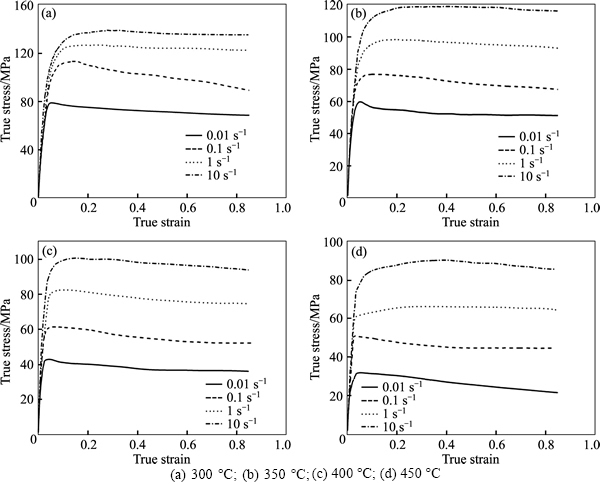
Fig. 1 Typical true stress�Cstrain curves for 7050 aluminium alloy at various strain rates and temperatures:
2.2 Establishment of model of flow stress at high temperature
When plastic deformation occurs for a given material, atomic diffusion and dislocation motion are determined by the deformation temperature, and the dislocation density and the accumulating rate of grain boundary energy are dependent on the strain rate. Therefore, it can be considered that the peak flow stress is only influenced by the deformation temperature and the strain rate. Previous researches have shown that the relation between the flow stress and the two parameters can be expressed by mathematical models. In this work, the hyperbolic sine Arrhenius model [23], which considers the activation energy, the deformation temperature and the strain rate, was selected.
 =A[sinh(����)]nexp(�CQact/RT) (1)
where is the strain rate; T is the deformation temperature; Qact is the activation energy; A, �� and n are constants which need to be calculated; R is gas constant (R=8.314 kJ/mol); and �� is the flow stress.
And the hyperbolic sine Arrhenius model has two forms:
=A1��nexp(�CQact/RT), ���ҡ�0.8 (2)
=A2exp(�¦�)exp(�CQact/RT), ���ҡ�1.2 (3)
where A1, A2, n1 and �� are contants. As A2=A/2n, and ��=��n1, the equations can be transformed as follows:
ln=lnA1+n1ln�ҨCQact/RT (4)
ln=lnA2+�¦ҨCQact/RT (5)
When the deformation temperaturea T is definite, n1 and �� correspond to the slopes of the curves of ln�ҨCln and �ҨCln respectively. Figures 2(a) and (b) show the relationships of
 and
and at different temperatures through linear regression. According to the slopes of these curves, n1=9.5324 and ��=0.11894 MPa�C1, and ��=0.012478 MPa�C1 as ��=��n1.
In addition, at a given deformation temperature, Eq. (1) can be changed into the following equation by taking natural logarithms on both sides:
ln=lnA+nln[sinh(����)]�CQact/RT (6)
It is certain that ln and ln[sinh(����)] present a linear relationship as shown in Fig. 3. As the slopes of the linear regression curves are 1/n, n is calculated to be 7.04359. Meanwhile, the intercepts of these curves equal to (Qact /RT�ClnA)/n.
Fig. 2 Relationship between peak stress and strain rate:
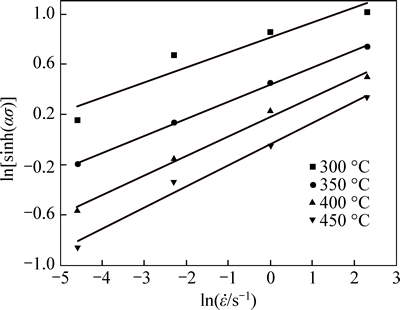
Fig. 3 Relationship between ln[sinh(����)] and 
Further, if the strain rate is definite, take natural logarithms on both sides of Eq. (1) and another expression would be obtained as follows:
ln[sinh(����)]=Qact/nRT�ClnA/n (7)
From regression analysis, the relationship between ln[sinh(����)] and T�C1 is still linear at a certain strain rate as shown in Fig. 4. The slopes of the four curves are Qact/ Rn, and the average value can be calculated to be 2487.2605 as n=7.04395 and R=8.314 kJ/mol, Qact=145.66 kJ/mol. Considering that the intercepts of curves in Fig. 3 are (Qact/nRT�ClnA)/n and Qact, R, T and n are known, we get A=6.076��1010 s�C1.
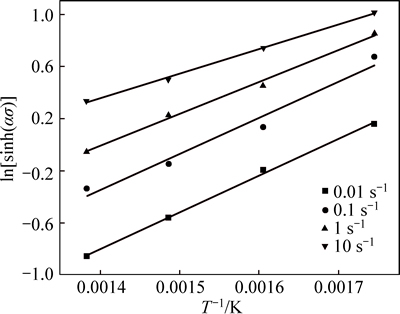
Fig. 4 Relationship between ln[sinh(����)] and T�C1
After substituting the calculated value of Qact , A and �� into Eq. (1), the peak flow stress models of aluminum alloy 7050 under the experimental conditions are as follows:

 (8)
(8)

 (9)
(9)
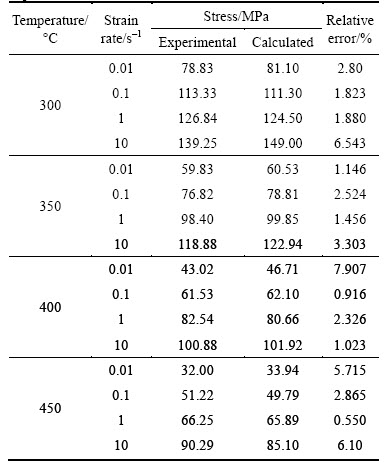
In this way, the calculated values of peak flow stress under different deformation conditions can be achieved by Eq. (9), and the experimental values can be obtained from the true stress�Cstrain curves of hot compression experiments. Table 2 shows the comparison of the calculated and experimental values of peak flow stress. It is shown that the errors between them are almost less than 8%. Thus, the previous flow stress model is proved to be able to describe the experimental peak stress accurately.
3 Simulation procedures
3.1 Theoretical rules of CA model
It is commonly believed that DRX won��t occur until the dislocation density or the strain reaches a critical value which is dependent on thermo-mechanical parameters such as deformation temperature and strain rate. In this work, two assumptions are made so as to simplify the CA model.
1) The dislocation density of all the grains within the matrix is initially uniform and then increases with the increase of strain. When it exceeds the critical dislocation density, the nucleation of DRX comes out. And the dislocation density of a newly nucleated grain is initially presumed to be zero and will also be able to become larger as the strain increases.
Table 2 Comparison of peak stress between calculation and experiments
2) DRX occurs on the grain boundaries and the dynamically recrystallized grain boundaries.
3.1.1 Model of dislocation density
The development of dislocation density is generally determined by work hardening and dynamic recovery softening. The variation of the dislocation density of cell (i, j) in a matrix in respect of strain can be expressed as [16]:
 (10)
(10)
where k1 is a constant coefficient representing work hardening and k2 is the softening parameter that represents recovery of dislocation. Then, the overalldislocation density �� can be expressed as ��= and N is the sum of cells in the matrix.
According to the assumption of Kocks-Meching model (K-M model) [24], the correlation between the flow stress ��, an external variable, and the dislocation density ��, an internal variable, is ��=����b where �� is a dislocation interaction constant which is around 0.5 for most metals, �� is the shear modulus and b is Burger��s vector. It should be noted that the shear modulus varies with the deformation temperature T and can be expressed as:
��=��0[1�C0.91��(T�C300)/Tm] (11)
where ��0 equals the shear modulus at room temperature and Tm is the material��s melting temperature.
From Eq. (10), it can be deduced that
d��/d��=��0(1�C��/��s) (12)
where ��0=����bk1/2 and ��s=����bk1/k2. ��0 is the hardening rate which equals the slope of the experimental flow stress�Cstrain curve in the stage of working hardening at a specific temperature and ��s is the saturated stress which can also be obtained from the stress�Cstrain curve [17]. Therefore, the two coefficients k1 and k2 in Eq. (10) can be calculated under the condition of k1=2��0/(����) and k2=2��0b/��s as long as ��0 and ��s are determined.
3.1.2 Model of DRX nucleation
As mentioned before, DRX nucleation is assumed to only occur on the grain boundaries. The nucleation rate of per unit grain boundary area (length for 2D model) for DRX can be described as a function of both temperature and strain rate [16]:
 (13)
(13)
where C is a constant, and  is the strain rate given by Eq. (8). Meanwhile, the exponent m is set to be 1 in the present work.
3.1.3 Model of grain growth
It is commonly thought that the growth of a grain is thermo-dynamically activated by the difference between the dislocation densities of the R-grain and the matrix [17]. The velocity of grain growth vi for the ith R-grain is generally expressed as [16]:
vi=Mfi=MFi/(4��ri2) (14)
where fi is the driving force per unit area for the ith R-grain with the assumption that the R-grain is spherical and has a radius of ri; M is the GB mobility [25] and M=(��Dbb/KT)exp(�CQb/RT). With the growth of ri, the driving force Fi=4��ri �� (��m�C��i)�C8��ri ��i, where ��m is the dislocation density of the matrix, ��i is the dislocation density of the ith R-grain and ��i is the GB energy given as [25]
 (15)
(15)
where ��i is the misorientation between the ith R-grain and its neighboring grain, ��m (taken as 15��) and ��m are the misorientation and the GB energy of a high angle grain boundary, respectively.
3.2 CA model
3.2.1 CA model of grain growth
In the present study, a 2D square lattice is employed using MATLAB platform. Each cell corresponds to an element of the matrix and has four state variables: the dislocation density variable which can be calculated from Eq. (11), the grain orientation variable which can discriminate different grains and the values of GB energy, the GB variable which indicates whether the cell is located at the GB, and the fraction variable which represents recrystallization fraction. The recrystallization fraction can be normally calculated from the following equation [18]:
 (16)
(16)
where ft represents the recrystallization fraction of a cell at the GB at time t and l0 is the length of a unit cell (4 ��m in this simulation).
The present square lattice is set to 400��400 and the periodic boundary condition is employed. The size of each cell represents 4 ��m of the real dimension of the material and thus the total simulation area is equivalent to a real sample with the area of 1.6 mm��1.6 mm. The initial microstructure as shown in Fig. 5 is generated using a normal grain growth algorithm [16].
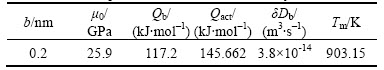
Then, the simulation of thermal compression of aluminium alloy 7050 is conducted under various deformation conditions. The the input parameters for the 7050 aluminium alloy material are shown in Table 3, where b is the Burger��s constant, ��0 the shear modulus at room temperature, Qb the boundary diffusion activation energy, Qac the active energy, �� thecharacteristic grain boundary thickness, Db the boundary self-diffusion coefficient, and Tm the material��s melting temperature.
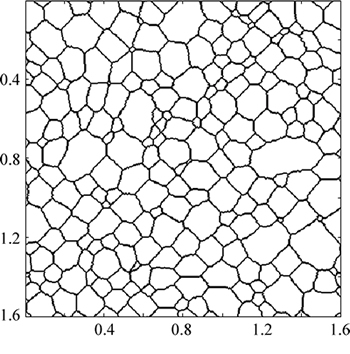
Fig. 5 Generated initial microstructure before simulation (Unit: mm)
Table 3 Material parameters for aluminium alloy 7050
3.2.2 Topological deformation for CA model
It should be noticed that as the size of the matrix varies during hot compression deformation, the topology deformation should be considered. In this work, it is realized that the matrix transformation for every cell is determined by its location (i, j) in the matrix. The matrix transformation includes two aspects: one is the size of the matrix, with the assumption that an initial a��b matrix S(a,b) transforms into one with the size of m��n S(m,n). The other is the state transfer of a given cell after transformation. If the current true strain is ��t, the column number of the formed matrix, n, can be calculated as n= bexp(�C��t). And the row number m can be obtained from m=ab/n for the volume (area for a 2D model) remaining constant during deformation. As the values of m and n should be integers, it will bring about the calculation error for the simulated deformation area. It is confirmed that all the round-off area errors are less than 0.5% at various strains when the 400��400 matrix is employed, indicating an acceptable precision. Further, as different cells have different state variables, the state transfer of cells should be implemented to avoid the confusion of grains. In essence, the transformation from cell C(i, j) in the initial matrix S(a, b) to cell C(x, y) in the transformed matrix S(m, n) can be successfully carried out in terms of the following rule:
 (17)
(17)
where ��e is the engineering strain and ceil(x) is a round function which returns the minimum integer larger than x. In each deformation step of the present simulation, as the strain increment is known, the geometrical position of each cell can be updated based on this topology deformation model. In this way, the evolution of grain topology during deformation can be simulated.
4 Results and discussion
4.1 Comparison of flow stress-strain curves
The previously proposed CA model was adopted to simulate the process of DRX of aluminium alloy 7050 at different temperatures and strain rates. Figure 6 exhibits the simulated and experimental flow stress�Cstrain curves at different temperatures (300�C450 ��C) and strain rates (0.01�C10 s�C1). The numerical stress value is a little larger than the experimental one, and the largest error between them happens at the peak stage. The reason might be that in the simulation the nucleation is assumed to only occur at the grain boundary and the initial dislocation density gradient in each grain is ignored. In addition, it is difficult to measure the actual dislocation density of material and thus the dislocation density in the simulation is not accuracy enough. However, on the whole, the simulated flow stress�Cstrain curves are generally in agreement with the actual experimental curves, indicating that the CA model is effective.
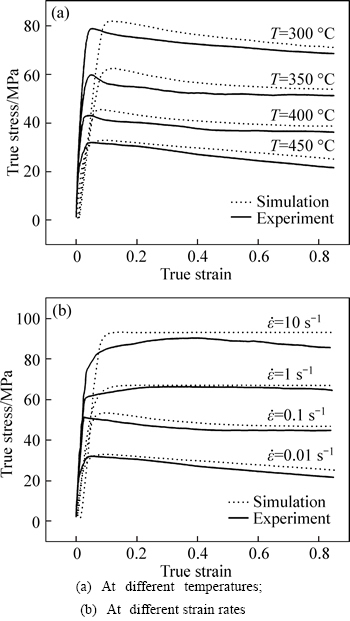
Fig. 6 Comparison of simulated and experimental flow stress�Cstrain curves:
4.2 Effect of strain on DRX
Figure 7 illustrates the microstructure evolution of aluminium alloy 7050 with different stains at the temperature of 450 ��C and the strain rate of 0.01 s�C1. The regions in different colors represent the newly formed recrystallized grains with different crystallographic orientations and the white regions are the deformed matrix. It is noted when the temperature and the stain rate are kept constant during hot compression, the amount of recrystallization nuclei grows significantly with the increase of strain. The fraction of DRX as well as the average R-grain size under four certain conditions of strain is shown in Table 4. It is certain that the fraction of DRX increases largely from 7.95% to 41.17% with increasing strain. However, the R-grain size increases very slowly as the value of strain grows. This phenomenon is generally in accordance with the results by HU et al [26].
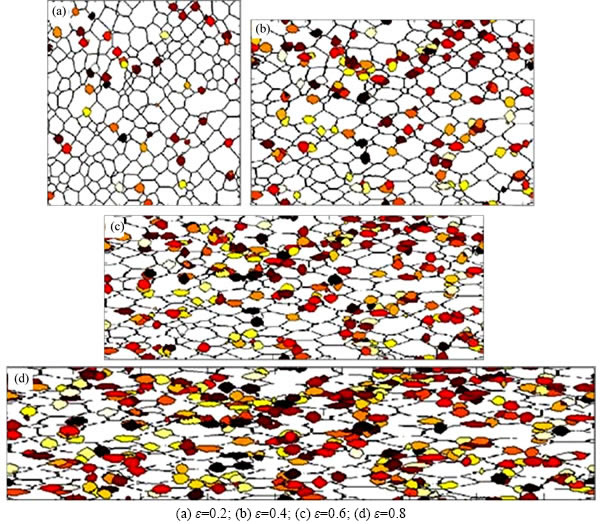
Fig. 7 Microstructure evolution with different stains at T=450 ��C and  =0.01:
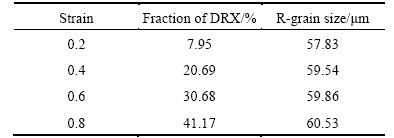
Table 4 Fraction of DRX and average R-grain size with different strains
4.3 Effect of strain rate on DRX
The simulation result of recrystallized process at certain strain rates (0.01 s�C1, 0.1 s�C1, 1 s�C1 and 10 s�C1) at 450 ��C and strain of 0.85 is shown in Fig. 8. Figure 9 presents the history of the fraction of DRX with increasing strain. It can be seen that the corresponding values of the average R-grain size when the strain rates varies from 0.01 s�C1 to 10 s�C1 are 59.83 ��m, 37.54 ��m, 11.6 ��m and 5.52 ��m, respectively, and the relevant fractions of DRX are 46.67%, 19.17%, 1.67% and 0.26% in sequence. At a strain rate greater than 1 s�C1, the proportion of DRX is rather small as the deformation is so quick that few R-grains are generated during the process. However, when the strain rate decreases to 0.01 s�C1, the fraction of DRX increases swiftly to 46.67%, indicating that a low strain rate is beneficial to the occurrence of DRX at a fixed temperature. It is interesting to find that the simulated R-grain size at a high strain rate is much smaller. Even so, the fraction of DRX is very low and can be negligible. It shows that the recrystallization nearly does not occur under the condition of high strain rate.
The metallographical images at different strain rates (0.01 s�C1, 0.1 s�C1, 1 s�C1 and 10 s�C1) at 450 ��C and with the strain of 0.85 are shown in Fig. 10. It presents that the grain size increases gradualy with the decrease of strain rate. The uniform and fine microstructures are obtained when the strain rate is 0.1 s�C1. However, when the strain rate decreaes to 0.01 s�C1, the grains become coase evidently. This is because there is no enough time for recrystallization at high strain rate as mentioned before.And the experimental images exhibit the same result with simulation, verifying the effectiveness of the DRX model.
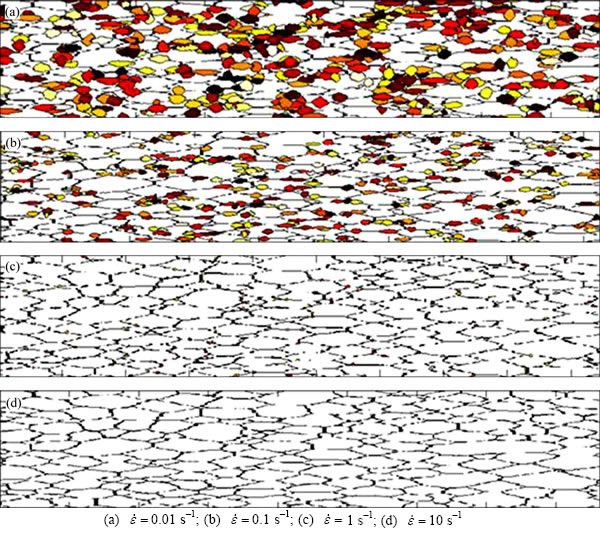
Fig. 8 Effect of strain rate on simulation microstructure evolution (T=450 ��C and ��=0.85):
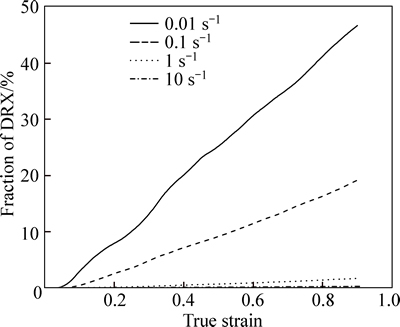
Fig. 9 History of fraction of DRX with increasing stain at different strain rates (T=450 ��C)
4.4 Effect of temperature on DRX
Figrue 11 shows the simulation microstructure evolution under different temperatures with the strain rate of 0.01 s�C1 and the strain of 0.85. It is calculated that the average sizes of R-grain with temperature from 300 ��C to 450 ��C are 12.87, 17.36, 20.89 and 59.83 ��m in turn. Figure 12 presents the relation between the fraction of DRX and temperature. It is found that at a certain strain rate, both the fraction of DRX and the mean R-grain size increase with the increase of temperature under the same condition of strain. This indicates that the effect of temperature on recrystallization is embodied in two aspects. On the one hand, the rising temperature provides the necessary energy and contributes to the nucleation and growth of R-grains. On the other hand, too high temperatures will lead to coarse grains. In short, when the stain is constant, the higher the temperature or the lower the strain rate, the easier the recrystallization phenomenon to occur. It is also noted from Fig. 6 and Fig. 8 that the recrystallization always happens when the strain reaches a critical value. When the temperature remains constant, the higher the strain rate, the larger the critical strain for the occurrence of DRX. And for a given stain rate, the higher the temperature, the smaller the critical strain.
The metallographical images under different temperatures with the strain rate of 0.01 s�C1 and the strain of 0.85 is shown in Fig. 13. It is found that there is only microstructure of original grain, and no obvious recrystallization nucleation is seen at the temperature of 300 ��C. At 350 ��C, the fiber structure is stretched which means dynamic recovery has happened, there are some small grains or grain boundary which shows the recrystallization has occurred. With the temperature increases to 400 ��C, the fiber structure and the small grains become bigger. When the temperature gets 450 ��C, the recrystallization is more obvious, the recrystallization grain continues to grow up. The tendency shown in Fig. 13 is the same as the simulation result shown in Fig. 11, which proves the effectiveness of the simulation.
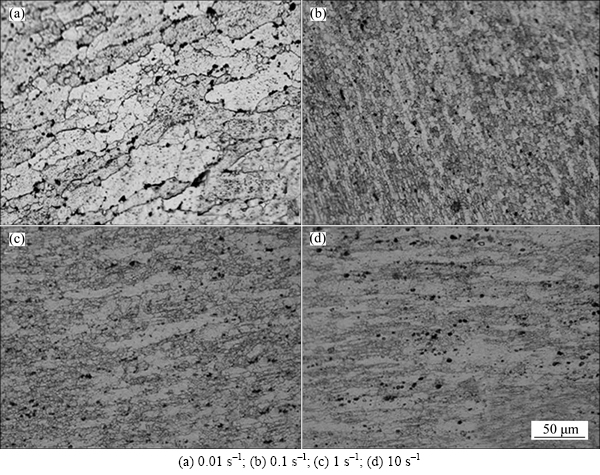
Fig. 10 Metallographical image at different strain rates (T=450 ��C and ��=0.85):
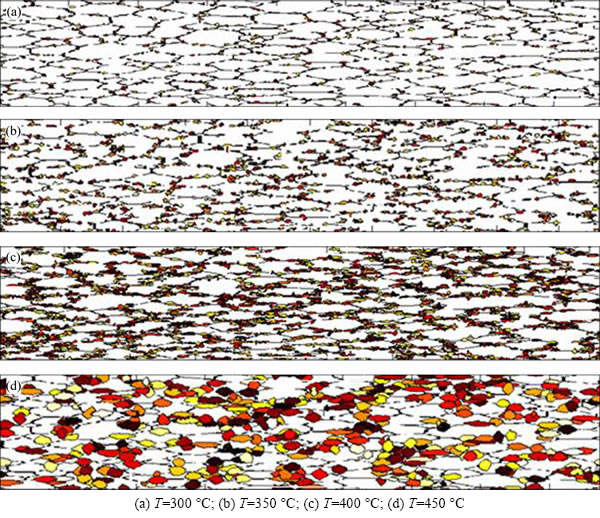
Fig. 11 Effect of temperature on microstructure evolution:
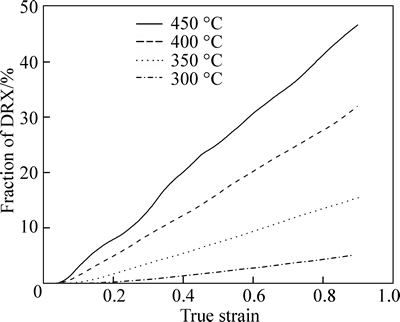
Fig. 12 History of fraction of DRX with increasing stain at different temperatures
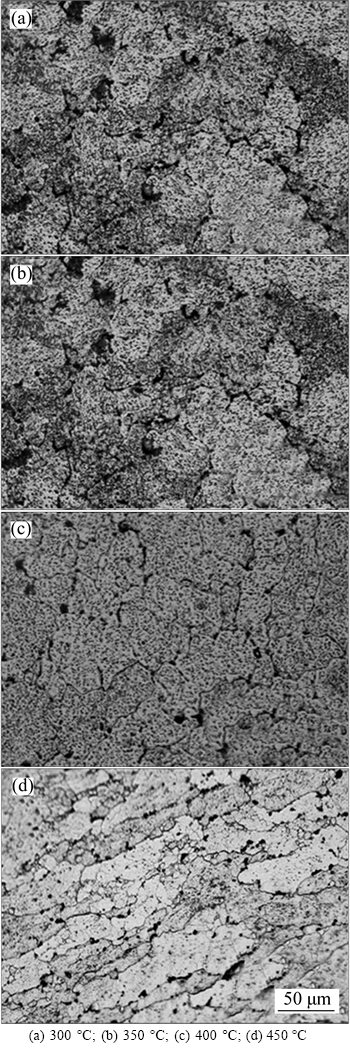
Fig. 13 Metallographical images at different temperatures  =0.01 s�C1 and ��=0.85):
5 Conclusions
1) A model of flow stress at high temperature for simulating the dynamic recrystallization of aluminum alloy 7050 is developed and used to get the true stress�Cstrain curve of the simulated deformation process. The flow stress results predicted from CA simulation are in good agreement with the experimental ones of hot compression tests, indicating that the proposed CA model could provide a theoretical reference for the control of the microstructure and properties of aluminium alloy 7050.
2) The influences of strain, strain rate and deformation temperature on the fraction of DRX and the average R-grain size are analyzed. It is found the fraction of DRX rises with the increase of strain and deformation temperature and with the decrease of strain rate. Meanwhile, the R-grain size increases a little when the strain increases, but increases significantly with the rising temperature. And although the simulated R-grain size at a high strain rate is much smaller, the fraction of DRX is very low and can be negligible.
3) The occurrence of the recrystallization is related to a critical value of strain. At the same temperature, a higher strain rate results in a larger critical strain for recrystallization. And at a given strain rate, the critical strain will become small when the temperature increases.
References
[1] HAN N, ZHANG X, LIU S, HE D, ZHANG R. Effect of solution treatment on the strength and fracture toughness of aluminum alloy 7050 [J]. Journal of Alloys and Compounds, 2011, 509(10): 4138�C4145.
[2] JIN Neng-ping, ZHANG Hui, HAN Yi, WU Wen-xiang, CHEN Jiang-hua. Hot deformation behavior of 7150 aluminum alloy during compression at elevated temperature [J]. Materials Characterization, 2009, 60(6): 530�C536.
[3] WILLIMS J C, STARKE E A Jr. Progress in structural materials for aerospace systems [J]. Acta Materialia, 2003, 51(19): 5775�C5799.
[4] SAKAI G, HORITA Z, LANGDON T G. Grain refinement and superplasticity in an aluminum alloy processed by high-pressure torsion [J]. Materials Science and Engineering A, 2005, 393(1): 344�C351.
[5] FURUKARA M, HORITA Z, NEMOTO M, LANGDON T G. The use of severe plastic deformation for microstructural control [J]. Materials Science and Engineering A, 2002, 324(2): 82�C89.
[6] CHO J, BAE W, HWANG W, HARTLEY P. A study on the hot-deformation behavior and dynamic recrystallization of Al�C5% Mg alloy [J]. Journal of Materials Processing Technology, 2001, 118(1/2/3): 356�C361.
[7] CHEN Fei, CUI Zhen-shan, CHEN Shi-jia. Recrystallization of 30Cr2Ni4MoV ultra-super-critical rotor steel during hot deformation. Part 1: Dynamic recrystallization [J]. Materials Science and Engineering A, 2011, 528(15): 5073�C5080.
[8] MIRZAEE M, KESHMIRI H, EBRAHIMI G, MOMENI A. Dynamic recrystallization and precipitation in low carbon low alloy steel 26NiCrMoV 14-5 [J]. Materials Science and Engineering A, 2012, 551: 25�C31.
[9] WU B, LI M. The flow behavior and constitutive equations in isothermal compression of 7050 aluminum alloy [J]. Materials Science and Engineering A, 2012, 542: 79�C87.
[10] LUO J, LI M, WU B. The correlation between flow behavior and microstructural evolution of 7050 aluminum alloy [J]. Materials Science and Engineering A, 2011, 530(1): 559�C564.
[11] BROWN A A, BAMMANN D J. Validation of a model for static and dynamic recrystallization in metals [J]. International Journal of Plasticity, 2012, 32: 17�C35.
[12] CHEN Ming-song, LIN Y, MA Xue-song. The kinetics of dynamic recrystallization of 42CrMo steel [J]. Materials Science and Engineering A, 2012, 556: 260�C266.
[13] JIN Zhao-yang, CUI Zhen-shan. Investigation on dynamic recrystallization using a modified cellular automaton [J]. Computational Materials Science, 2012, 63: 249�C255.
[14] CHEN Fei, CUI Zhen-shan, LIU Juan, CHEN Wen, CHEN Shi-jia. Mesoscale simulation of the high-temperature austenitizing and dynamic recrystallization by coupling a cellular automaton with a topology deformation technique [J]. Materials Science and Engineering A, 2010, 527(21/22): 5539�C5549.
[15] CHEN Fei, QI Ke, CUI Zhen-shan, LAI Xin-min. Modeling the dynamic recrystallization in austenitic stainless steel using cellular automaton method [J]. Computational Materials Science, 2014, 83: 331�C 340.
[16] DING R, GUO Z X. Coupled quantitative simulation of microstructural evolution and plastic flow during dynamic recrystallization [J]. Acta Materialia, 2001, 49(16): 3163�C3175.
[17] CHEN Fei, CUI Zhen-shan, LIU Juan, ZHANG Xin-min, CHEN Wen. Modeling and simulation on dynamic recrystallization of 30Cr2Ni4MoV rotor steel using the cellular automaton method [J]. Modelling and Simulation in Materials Science and Engineering, 2009, 17(7): 1969�C2015.
[18] XIAO Na-min, ZHENG Cheng-wu, LI Dian-zhou, LI Yi-yi. A simulation of dynamic recrystallization by coupling a cellular automaton method with a topology deformation technique [J]. Computational Materials Science, 2008, 41(3): 366�C374.
[19] ROBSON J. Microstructural evolution in aluminium alloy 7050 during processing [J]. Materials Science and Engineering A, 2004, 382(1/2): 112�C121.
[20] YI Y P, CHEN H, LIN Y C. Investigation of flow stress behavior and microstructural evolution of 7050 Al alloy [J]. Materials Science Forum, 2007, 546-549: 1065�C1068.
[21] DENG Ying, YIN Zhi-min, HUANG Ji-wu. Hot deformation behavior and microstructural evolution of homogenized 7050 aluminum alloy during compression at elevated temperature [J]. Materials Science and Engineering A, 2011, 528(3): 1780�C1786.
[22] HUANG Shi-quan, YI You-ping, LIU Chao. Simulation of dynamic recrystallization for aluminium alloy 7050 using cellular automaton [J]. Journal of Central South University of Technology, 2009, 16(1): 18�C24.
[23] SHI H, MCLAREN A J, SELLARS C M, SHAHANI R, BOLINGBROKE R. Constitutive equations for high temperature flow stress of aluminum alloys [J]. Materials Science and Engineering, 1997, 3(12): 210-216.
[24] MCKING H, KOCKS U. Kinetics of flow and strain-hardening [J]. Acta Metallurgica, 1981, 29(11): 1865�C1875.
[25] YAZDIPOUR N, DAVIES C H, HODGSON P D. Microstructural modeling of dynamic recrystallization using irregular cellular automata [J]. Computational Materials Science, 2008, 44(2): 566�C576.
[26] HU H E, ZHEN L, ZHANG B Y, YANG L, CHEN J Z. Microstructure characterization of 7050 aluminum alloy during dynamic recrystallization and dynamic recovery [J]. Materials Characterization, 2008, 59(9): 1185�C1189.
(Edited by FANG Jing-hua)
Foundation item: Project(2012ZX04010-8) supported by National Key Technology R&D Program of China
Received date: 2014-12-24; Accepted date: 2015-05-05
Corresponding author: LI Jun-chao, Associate Professor, PhD; Tel: +86�C23�C65111493; E-mail: ljchust@163.com
Abstract: The dynamic recrystallization (DRX) process of hot compressed aluminium alloy 7050 was predicted using cellular automaton (CA) combined with topology deformation. The hot deformatation characteristics of aluminium alloy 7050 were investigated by hot uniaxial compression tests in order to obtain the material parameters used in the CA model. The influences of process parameters (strain, strain rate and temperature) on the fraction of DRX and the average recrystallization grain (R-grain) size were investigated and discussed. It is found that larger stain, higher temperature and lower strain rate (less than 0.1 s�C1) are beneficial to the increasing fraction of DRX. And the deformation temperature affects the mean R-grain size much more greatly than other parameters. It is also noted that there is a critical strain for the occurrence of DRX which is related to strain rate and temperature. In addition, it is shown that the CA model with topology deformation is able to simulate the microstructural evolution and the flow behavior of aluminium alloy 7050 material under various deformation conditions.
