

Effect of particle characteristics on deformation of
particle reinforced metal matrix composites
ZHANG Peng(�� ��), LI Fu-guo(���)
School of Materials Science and Engineering, Northwestern Polytechnical University, Xi��an 710072, China
Received 3 March 2009; accepted 21 June 2009
Abstract:
The particle characteristics of 15% SiC particles reinforced metal matrix composites (MMC) made by powder metallurgy route were studied by using a statistical method. In the analysis, the approach for estimation of the characteristics of particles was presented. The study was carried out by using the mathematic software MATLAB to calculate the area and perimeter of each particle, in which the image processing technique was employed. Based on the calculations, the sizes and shape factors of each particle were investigated respectively. Additionally, the finite element model (FEM) was established on the basis of the actual microstructure. The contour plots of von Mises effective stress and strain in matrix and particles were presented in calculations for considering the influence of microstructure on the deformation behavior of MMC. Moreover, the contour maps of the maximum stress of particles and the maximum plastic strain of matrix in the vicinity of particles were introduced respectively.
Key words:
metal matrix composites; deformation mechanism; particle characteristic; finite element model;
1 Introduction
Discontinuously particles reinforced metal matrix composites (MMC) are being recognized as an important class of engineering material due to their lightweight and superior mechanical and thermal properties[1-4]. The experimental investigations[5-7] show that the mechanical properties of particle reinforced composites are largely dependent on the particle microstructures. For example, local stress and strain around the particles in a microstructure significantly depend on the particle shapes, which can affect the macroscopic mechanical properties of the material. Particularly, crack growth in particle reinforced metal matrix composites[8] is very much dependent on the particle microstructures. Thus, the knowledge of the deformation and fracture mechanism in particle reinforced metal matrix composites is of critical importance for estimation of the reliability of engineering application. Therefore, for reliable predictions of material properties, it is imperative to study the effect of particle characteristics on the deformation of MMC.
As an important approach, it is useful using computational materials science to simulate the microstructure at the relevant lengthen scales for the material behavior prediction. However, many previous numerical models in particle reinforced composites have not really considered the true microstructure of particles in last decades[9-11]. These simulations often assume idealized simple particle shapes such as sphere and ellipsoid in three dimensions and circle and ellipse in two dimensions or incorporate unrealistic arbitrary particle shapes [12-15]. Also, when more than one particle is considered, the particles are generally assumed to be the uniform random spatial arrangement and identical shape. In reality, the particle microstructures are quite complex. Thus, the simulation methodology mentioned above cannot show the realistic material deformation. In contrast, recent investigations of the FEM model of MMC have focused mainly on the microstructure-based simulation. The performance of this approach may include many microstructure variables, such as particle size, morphology and distribution. BALASIVANANDHA et al[16] investigated the stress-strain behavior and failure mechanisms from the microstructure-based model using 2D finite element analysis. ROMANOVA et al[17] investigated the heterogeneous material behavior on the meso-scale level using 2D model. Hence, it is essential to use the microstructure-based model to analyze the plastic response of MMC. In this contribution, the digital image processing technique is employed that enables us to obtain the digital images of the particles in real microstructures. In this manner, any realistic complex particle shapes or sizes can be analyzed. Thus, the particle features based on the microstructure in this contribution enable computation of realistic microstructure deformation. Further, the correlation between the deformation and the particle features can be obtained that is likely to yield the material with the required microstructure that has a desired combination of properties. Clearly, this is a complex problem that cannot be addressed. Therefore, the aim of the present work is to study the influence of particle characteristics on the compressive behavior of material. In this study, the image processing technique is applied to obtain the particle characteristics. Based on these characteristics, the microstructure-based simulation is developed to investigate the microstructure deformation in detail.
2 Image processing
The material examined is aluminum alloy-silicon carbide composites made by a powder metallurgy route. Aluminum powder was blended with 15% (volume fraction) of silicon carbide powder to make the SiCp/Al composites. According to statistical principle, the microstructure of MMC as shown in Fig.1 is selected, in which each pixel has a particular color described by the amount of red, green, and blue in it. In case of each of these components has a range of 0-255, this gives a total of 2553 (16 777 216) different possible colors in the image. If there is a similar color in some location, it is too difficult to choose object from the original image. Therefore, to discern in some detail the micro structural features, it is necessary to apply special image processing techniques, such as background removal, opening, closing, dilation and erosion to render the resulting image more suitable for the job to follow[10]. Fig.2 shows the binary image after image processing. In binary image, each pixel is just black or white. Since there are only two possible values for each pixel, as a result some objects in the image can be efficient to be obtained in terms of pixel value. Fig.1 shows 500 times magnification, which is 170 ��m��125 ��m, including 295��221 pixels, each pixel corresponding to size of 0.57 ��m.

Fig.1 Microstructure of MMC
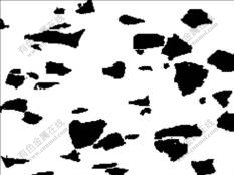
Fig.2 Binary image after image processing
3 Characteristics of particle
Generally, the characteristics of particles in MMC include three items: particle arrangement, particle size and particle shape. However, the MMC sample given in Fig.1 presents the random distribution of particles, in which particle clustering region is not evident in the microstructure. Thus, in the following investigation, the particle characteristics are depicted by two items: particle size and particle shape.
3.1 Description of characteristics
The particle size was characterized in terms of the equivalent diameter:
![]()
where �� is the perimeter of particle, A is the area of particle.
To obtain the shape of particle, the shape factor (S) is adopted, which is given by
![]()
The relationship between shape factor and regular particle shape can be seen in Table 1. It is clearly observed that the shape factor can show the aspect ratio of particle. The smaller the shape factors are, the smaller aspect ratios of particles are. Otherwise, the aspect ratios are great.
Table 1 Shape factor of regular particle shape

From Eqs.(1) and (2), it is obvious that the area and perimeter of particle play an important role in analysis. In this work, for accurately gaining the area and perimeter of particle, the digital image processing technique has been introduced, in which the concept of pixel is used. In the study, the description of area for particle is defined as the total of pixels of particle, while the description of perimeter is defined as the total of pixels of outline. Therefore, the precision is decided by the description of particle shape. In the mathematic software MATLAB, the isolated particle in the binary image can be captured, furthermore, the skeleton can also be presented. In general, the binary image is described by a matrix composed of 1 and 0, and 1 means the foreground, 0 means the background, therefore, the values of area and perimeter are the total of foreground pixels, respectively.
3.2 Results of characteristics
Quantitative analysis of particle size distribution holds great importance in correlating the microstructure features of MMC to their mechanical response. To predict the particle size distribution, the particles in Fig.2 are assigned a number as shown in Fig.3, respectively. Then the area and perimeter of particles are measured by program in software MATLAB respectively. Based on these results, according to Eq.(1), the equivalent diameter of each particle is obtained, as shown in Fig.4. It can be seen from Fig.4 that the particle distribution is divided into six parts according to equivalent diameter values. Clearly, the quantity of particles is 17 within the range of 3-5 ��m and it is the most compared with other ranges. And the quantity of particles beyond 13 ��m is only 3 and it is the least. Studies on the fracture mechanism of metal matrix composite[16, 18] indicate that the particle size dominates the rupture of MMC, for example, cracks usually occur in particles with a dimension greater than 5 ��m, while small particles (��5 ��m) incline to debond at interface between matrix and particle. Thereby, from Fig.4, it can be understood that the particle fracture and interface debonding may lead to the fracture of composites.
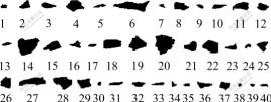
Fig.3 Particle number from microstructure
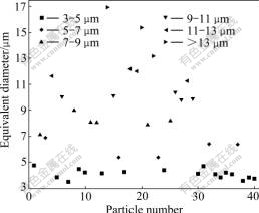
Fig.4 Equivalent diameter of each particle size
In the analysis of particle shapes, 40 particles discussed above are still used. The shape factor values of these particles are exhibited in Fig.5. It can be seen that from Fig5 that the values of these particles fluctuate within the wide range from 1.003 49 to 2.875 68. In order to demonstrate the variation of particle quantities, the particle distribution is divided into four parts according to shape factor values. Obviously, the number of particles within the range of 1.0-1.5 is 24 and it is the most compared with other ranges. And the number of particles beyond 2.5 is only 2 and it is the least when compared with other ranges. According to Table 1, it is found that when the value of shape factor exceeds 1.5, the particle possesses high aspect ratio. Thus, the majority particles investigated has low aspect ratio.

Fig.5 Shape factor of each particle
4 Microstructure-based FEM
4.1 FEM model
To predict the effects of particles on the deformation of MMC, the FEM model based on the microstructure (Fig.1) is established as shown in Fig.6. When compared with Fig.1, it can be seen that only very small particles (number 38 and 39 in Fig.3) are canceled.
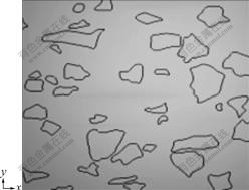
Fig.6 FEM model based on microstructure
4.2 Material description
The SiC particle was modeled as linear elastic, characterized by elastic modulus Ep=440 GPa and Poisson ratio ��P=0.17. The Al matrix behaved as isotropic elastic-plastic response, with elastic modulus EAl=70 GPa and Poisson ratio ��Al=0.33. The elastic- plastic stress-strain constitutive law for the matrix was approximated by the deformation theory flow relation (Ludwik hardening law)[18]:
![]()
where ��Y and ![]() represent flow stress and accumulated equivalent plastic strain, respectively,
represent flow stress and accumulated equivalent plastic strain, respectively, ![]() is the initial yield stress, h is the hardening coefficient, n is the hardening exponent. The parameter values for the matrix[19] are as follows:
is the initial yield stress, h is the hardening coefficient, n is the hardening exponent. The parameter values for the matrix[19] are as follows: ![]() =250 MPa, h=173 MPa, n=0.455.
=250 MPa, h=173 MPa, n=0.455.
4.3 Boundary condition
The nodes at the bottom border are defined as Uy=0. And the nodes at the upper border are defined as negative displacement Uy to keep 10% compressive deformation.
5 Results and discussion
5.1 Stress and strain distribution
The contour plots of von Mises effective stress in matrix with the deformation are shown in Fig.7. It can be seen that the field of von Mises effective stress in matrix is inhomogeneous during the initial stage of deformation due to the mismatch of elastic modulus between the particles and the matrix. Additionally, high stress develops in the matrix which closes to the tip of the particles along loading axis. The stress concentration in the vicinity of the particles is due to the strain constraint in the presence of SiC particles. It is also observed from Fig.7 that along the direction which is perpendicular to the loading axis, the von Mises effective stress in matrix presents marked gradient distribution in the initial stage. However, the stress gradient field only occurs in the vicinity of larger particles with further deformation.
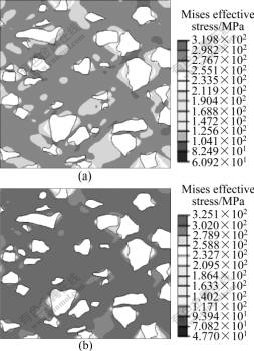
Fig.7 Contours of von Mises effective stress in matrix: (a) 2.5% deformation; (b) 10% deformation
Fig.8 shows the von Mises effective stress in particles. Compared with the von Mises effective stress in matrix, it is noticeable that the von Mises effective stress in particles is greater than that in the matrix. In addition, it can be seen that the maximum stress occurred in particles has relation between the particle shapes and sizes.
Fig.9 shows the distribution of effective plastic strain in matrix. It can be seen that there is a great plastic strain gradient in the matrix. It also can be understood from the stress distribution pattern that the plastic flow initiates at the particle tip along the loading direction. Similarly, the plastic strain is low along the particle sides (perpendicular to the loading direction). In addition, it is evident that the strain distribution is still inhomogeneous and concentrates in an array of rather straight shear bands that form at an angle of about 45? to the loading axis. However, the location of these bands is determined by the particle arrangement. The comparison of Fig.9 reveals that the strain bands form early and the widths of the bands do barely change with the further deformation. By comparing the deformation process, it becomes clear that the pattern of the local plastic strain increases with the further deformation. Furthermore, it is noteworthy that some low strain regions are free of particles during the deformation.
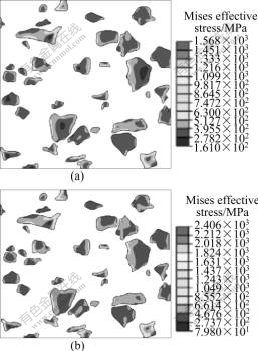
Fig.8 Contours of von Mises effective stress in particles: (a) 2.5% deformation; (b) 10% deformation
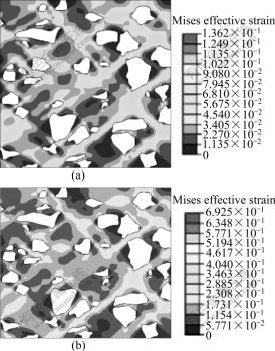
Fig.9 Contours of von Mises effective strain in matrix: (a) 2.5% deformation; (b) 10% deformation
5.2 Contour map of maximum stress in particles
To predict the stress distribution in particles during the deformation, the minimum stress and maximum stress in particles are given in Fig.10. It is evident that the minimum stress in these particles fluctuates within the limited range from 0 MPa to 500 MPa. While the maximum stress in particles fluctuates within the wide range from 500 MPa to 2 500 MPa. Therefore, it can be seen that during deformation, the particles can provide higher stress gradient, which results in the inhomogeneous stress distribution. In contrast with Fig.4 and Fig.5, it can be seen that the maximum stress in particles is a multifactor result, including particle sizes and shapes. Here, to investigate the contributions of these particle characteristics on particle maximum stress, the effects of shape factors and particle sizes on the maximum stress in particles are considered, as shown in Fig.11. The contour number represents the maximum stress in particles. From Fig.11, it can be seen that the stress map exhibits two distinct domains. The first domain has been identified in the shape factors range of 1.6-3.0 and particle sizes range of 10-18 ��m. The stress in this zone lies in the range of 1.5��103-2.2��103 MPa. The characteristics of particles in this zone possess high particle sizes and aspect ratios. In other words, the particles often crack in this zone. The second domain occurs in the shape factors range of 1.0-2.0 and the particle sizes range of 2-10 ��m. The stress in this zone is 1 000 MPa or so. The characteristics of the particles in this zone have small particle sizes and low aspect ratios. Consequently, compared with the particles with a large size and high aspect ratio, the particles with small sizes and low aspects are much less prone to fracture at a given loading.
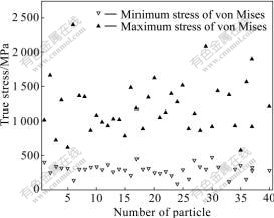
Fig.10 Stress in particles
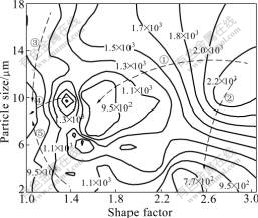
Fig.11 Contour map of maximum stress (MPa) in particles
Furthermore, to investigate the development trend of maximum stress in particles, five trendlines are introduced in Fig.11 to illuminate the variation. Along arrow 1 and arrow 4, it can be seen that the particle shape factor plays an important role in determining the stress value of particles. The trend shows that the stress decreases with decrease of particle shape factor. Along arrows 2, 3 and 5, the maximum stress in particles is sensitive very much to particle size.
5.3 Contour map of maximum plastic strain in matrix
During the deformation, matrix fracture has similarly played an important role. As a ductile material, strain usually has been applied as a criterion to study the matrix fracture. To show the effect of particle characteristics on the matrix strain, the maximum plastic strain in the vicinity of each particle is obtained respectively. As a result, the strain distribution is shown in Fig.12. From Fig.12, it can be seen that the mean strain of matrix is 0.138 52 (corresponding to straight line in Fig.12). Thus, it is noteworthy that the maximum plastic strain in the vicinity of each particle is larger than the average strain in matrix. To highlight the correlation between particle characteristics and matrix plastic strain, the effects of shape factors and particle sizes on the matrix maximum plastic strain have been depicted as shown in Fig.13. The map reveals the potential fracture in matrix during the deformation of materials. The contour number represents the maximum plastic strain occurred in the vicinity of particles. From Fig.13, it can be seen that the strain map exhibits two marked domains. The first domain has been identified in the shape factors range of 1.0-3.0 and the particle size range of 13-18 ��m. The strain of this zone fluctuates from 0.5 to 0.65. The characteristics of particle in this zone provide large particle sizes. The second domain occurs in the shape factors range of 1.0-3.0 and particle sizes of 2-10 ��m. The strain in this zone lies in the range of 0.25-0.4. The characteristics of particles in this zone provide small particle sizes. Thus, it can be concluded that in contrast with shape factor, the strain in matrix is sensitive very much to the particle size.
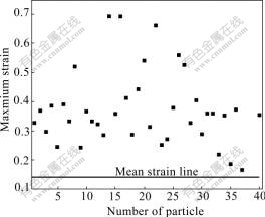
Fig.12 Strain distribution in matrix

Fig.13 Contour map of maximum plastic strain in matrix
Likewise, to investigate the development trend of maximum plastic strain in matrix, four trendlines are introduced in Fig.13 to analyze the variation. It is found along arrow 1 and arrow 2 that the particle size and shape factor are all important in determining the maximum plastic strain in matrix. In contrast, the arrow 3 and arrow 4 show that the plastic strain in matrix is sensitive very much to particle size.
6 Conclusions
1) By means of the technique of image processing, the characteristics of the particles in sample were successfully picked up. The particle sizes fluctuate within the wide range of 3-18 ��m. And the shape factors distribute within the wide range of 1.003 49-2.875 68.
2) Based on the microstructure, the two-dimensional cell model was established to investigate the particle characteristic effects on the deformation behavior of MMC. Furthermore, the contour maps of maximum stress in particles and maximum plastic strain in matrix are obtained respectively. The results show that the high stress in particles occurs in the shape factor range of 1.6-3.0 and the particle size range of 10-18 ��m; the high strain in matrix occurs in the shape factor range of 1.0-3.0 and the particle size range of 13-18 ��m.
3) In the analysis of the variation of the maximum stress in particles and the maximum strain in matrix with particle sizes and shape factors, the trendlines are introduced to investigate the development trend in contour maps.
References
[1] CHAWLA N, DENG X, SCHNELL D R M. Thermal expansion anisotropy in extruded SiC particle reinforced 2080 aluminum alloy matrix composites [J]. Materials Science and Engineering A, 2006, 426(1/2): 314-322.
[2] MIRACLE D B. Metal matrix composites��From science to technological significance [J]. Composites Science and Technology, 2005, 65(15/16): 2526-2540.
[3] BASAVARAJAPPA S, CHANDRAMOHAN G. Application of Taguchi techniques to study dry sliding wear behaviour of metal matrix composites [J]. Materials & Design, 2007, 28(4): 1393-1398.
[4] RAMANATHAN S, KARTHIKEYAN R, GANASEN G. Development of processing maps for 2124Al/SiCp composites [J]. Materials Science and Engineering A, 2006, 441(1/2): 321-325.
[5] CHAWLA N, SIDHU R S, GANESH V V. Three-dimensional visualization and microstructure-based modeling of deformation in particle-reinforced composites [J]. Acta Materialia, 2006, 54(6): 1541-1548.
[6] CESCHINI L, MINAK G, MORRI A. Tensile and fatigue properties of the AA6061/20vol%Al2O3p and AA7005/10vol%Al2O3p composites [J]. Composites Science and Technology, 2006, 66(2): 333-342.
[7] SOPPA E, SCHMAUDER S, FISCHER G. Influence of the microstructure on the deformation behaviour of metal-matrix composites [J]. Computational Materials Science, 1999, 16(1/4): 323-332.
[8] AYYAR A, CHAWLA N. Microstructure-based modeling of the influence of particle spatial distribution and fracture on crack growth in particle-reinforced composites [J]. Acta Materialia, 2007, 55(18): 6064-6073.
[9] YAN Y W, GENG L, LI A B. Experimental and numerical studies of the effect of particle size on the deformation behavior of the metal matrix composites [J]. Materials Science and Engineering A, 2007, 448(1/2): 315-325.
[10] YOTTE S, BREYSSE D, RISS J, GHOSH S. Cluster characterization in a metal matrix composite [J]. Materials Characterization, 2001, 46(2/3): 211-219.
[11] LI Y, LANGDON T G. High strain rate superplasticity in metal matrix composites: The role of load transfer [J]. Acta Materialia, 1998, 46(11): 3937-3948.
[12] SHEN Y L, FINOT M, NEEDLEMAN A. Effective plastic response of two-phase composites [J]. Acta Matallurgica et Materialia, 1995, 43(4): 1701-1722.
[13] GUSTAFSON T W, PANDA P C, SONG G. Influence of microstructural scale on plastic flow behavior of matrix composites [J]. Acta Materialia, 1997, 45(4): 1633-1643.
[14] ZHU H T, ZBIB H M, KHRAISHEH M K. Flow behavior and size effect of an Al-Si-Mg composite model system under multiaxial loadings [J]. Scripta Metallurgica et Materialia, 1995, 32(11): 1895-1902.
[15] HONLE S, SCHMAUDER S. Micromechanical simulation of crack growth in WC/Co using embedded unit cells [J]. Computational Materials Science, 1998, 13(1/3): 56-60.
[16] BALASIVANANDHA PRABU S, KARUNAMOORTHY L. Microstructure-based finite element analysis of failure prediction in particle-reinforced metal matrix composite [J]. Journal of Materials Processing Technology, 2008, 207(1/3): 53-62.
[17] ROMANOVA V, BALOKHONOV R, SOPPA E. Comparative analysis of two- and three-dimensional simulations of Al/Al2O3 behavior on the meso-scale level [J]. Computational Materials Science, 2007, 39(2): 274-281.
[18] LEON L, MISHNAEVSK Y Jr. Three-dimensional numerical testing of microstructure of particle reinforced composites [J]. Acta Materialia, 2004, 52(14): 4177-4188.
[19] WANG J C. The simulation of damping capacity of SiCp/Al composites [D]. 1991. (in Chinese)
Corresponding author: LI Fu-guo; Tel: +86-29-83070387; E-mail: fuguolx@nwpu.edu.cn
DOI: 10.1016/S1003-6326(09)60194-1
Abstract: The particle characteristics of 15% SiC particles reinforced metal matrix composites (MMC) made by powder metallurgy route were studied by using a statistical method. In the analysis, the approach for estimation of the characteristics of particles was presented. The study was carried out by using the mathematic software MATLAB to calculate the area and perimeter of each particle, in which the image processing technique was employed. Based on the calculations, the sizes and shape factors of each particle were investigated respectively. Additionally, the finite element model (FEM) was established on the basis of the actual microstructure. The contour plots of von Mises effective stress and strain in matrix and particles were presented in calculations for considering the influence of microstructure on the deformation behavior of MMC. Moreover, the contour maps of the maximum stress of particles and the maximum plastic strain of matrix in the vicinity of particles were introduced respectively.
