
J. Cent. South Univ. Technol. (2009) 16: 0503-0512
DOI: 10.1007/s11771-009-0084-5
![]()
Evaluation of group effect of pile group under dragload embedded in clay
KONG Gang-qiang(��ǿ)1, YANG Qing(�� ��)1, 2, ZHENG Peng-yi(֣��һ)1, LUAN Mao-tian(��ï��)1, 2
(1. School of Civil and Hydraulic Engineering, Dalian University of Technology, Dalian 116085, China;
2. State Key Laboratory of Coastal and Offshore Engineering, Dalian University of Technology,
Dalian 116085, China)
Abstract:
A simple semi-empirical analysis method for predicting the group effect of pile group under dragload embedded in clay was described assuming an effective influence area around various locations of pile group. Various pile and soil parameters such as the array of pile group, spacing of the piles (S), embedment length to diameter ratio of piles (L/D) and the soil properties such as density (��), angle of internal friction (��) and pile-soil interface friction coefficient (��) were considered in the analysis. Model test for dragload of pile group on
Key words:
pile group effect; dragload; model tests; clay��
1 Introduction
The negative skin friction (NSF), which is caused by downward vertical soil stress near the pile transferred to the pile shaft when the settlements of soil next to the pile are more than those of the pile, was a common problem in the designing and construction of pile foundations in soft ground. The development of additional compressive force (dragload) in a pile and excessive pile settlement (downdrag) could cause difficulty in construction and maintenance of the structure supported [1].
SHIBATA et al [2] and KONG et al [3] demonstrated that the dragload on individual piles in a group was smaller than that on an isolated single pile because of group effect. POULOS [4] pointed out that the group effect could influence the dragload and downdrag of pile foundations. Some studies on group effect were conducted by JEONG et al [5-6], CHOW et al [7], LEE et al [8], and COMODROMOS et al [9]. These studies were very helpful for understanding the behavior of pile group under dragload and predicting the group effect, while the studies on the group effect of pile group embedded in clay were scanty.
It was evident from the literatures as cited above that the most available studies were limited to empirical methods or numerical methods, while little on theoretical methods. So it was necessary to develop theoretical methods to predict the group effect of pile group and such an analysis was presented in this work. The group effect of pile group includes several variables such as group arrangement, spacing of piles, embedment length to diameter ratio of piles, soil type and its density, and pile-soil interface friction coefficient [10-11]. Considering the above parameters a simplified analysis based on effective influence area was proposed to predict the group effect of the pile group. Laboratory model tests on pile group were conducted in saturated or near saturated clay under surface loading at different numbers of piles and pile spacing. The predicted values of group effect were compared with the model test results obtained and with other published experimental data to check the validity of the developed analysis method.
2 Method of calculating group effect for pile group
Fig.1 shows an example of pile group in rectangular arrangement, effective influence area of single typical location of piles and overlap times of each influence area part. For the purpose of explanation first assume that a given vertical pile group was arranged at a spacing S (S��6.0D) in a rectangular arrangement as shown in
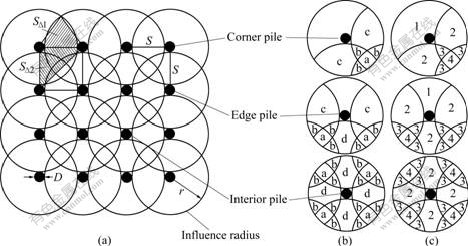
Fig.1 Example of pile group in rectangular arrangement (a), effective influence areas of single typical location of piles (b) and overlap times of each influence area part (c)
Fig.1(a). Taking notice of a typical location of pile arrangement, it was possible to define the unit typical location of pile effective influence area, as shown in Fig.1(b). Then, consideration of the balance of forces in the vertical direction leads to Eqn.(1) for the soil region whose horizontal section was single repeated in Fig.1(b).
![]() (1)
(1)
where �á� is the submerged unit weight of soil, ![]() is the vertical effective stress, z is the vertical coordinate, ���� is the ultimate shaft friction, D is the pile diameter, and Ai is the influence area of soil. Parameters Ai and ���� are expressed as follows:
is the vertical effective stress, z is the vertical coordinate, ���� is the ultimate shaft friction, D is the pile diameter, and Ai is the influence area of soil. Parameters Ai and ���� are expressed as follows:
Ai=a��r2+b��D2+c(r+D/2)2+dC1+eC2+fC3+gG4 (i=1, 2, 3) (2)
where r is the influence radius. For corner pile: a=3/4, b=-1/4, c=1/4, d=-2, e=1/2, f=1/2, g=-1/2; edge pile: a=1/2, b=-1/4, c=1/2, d=-3, e=3/4, f=1, g=-1; interior pile: a=0, b=-1/4, c=1, d=-4, e=1, f=2, g=-2;
![]() ,
,
![]()
![]()
 .
.
The influence areas of typical location of piles are listed in Table 1, and the overlap times of each influence area part are shown in Fig.1(c).
Table 1 Influence areas of single piles
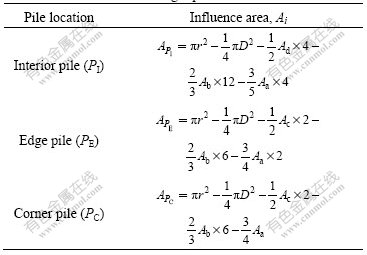
The influence area of interior pile is:
![]()
![]()
![]()
 (3)
(3)
The influence area of edge pile is:
![]()
![]()
![]()
 (4)
(4)
The influence area of corner pile is:
![]()
![]()
![]()
 (5)
(5)
![]() (6)
(6)
where ![]() is the horizontal effective stress,
is the horizontal effective stress, ![]() is the angle of friction mobilized between pile and soil, and k is the ratio of the horizontal to the vertical effective stress.
is the angle of friction mobilized between pile and soil, and k is the ratio of the horizontal to the vertical effective stress.
Substituting Eqn.(6) into Eqn.(1) yields
![]() (7)
(7)
where ![]() The boundary condition assumed here is
The boundary condition assumed here is
����=��p at z=0 (8)
where p is the intensity of surface loading.
Substituting Eqn.(8) into Eqn.(7) yields
![]() (9)
(9)
It should be noted that putting parameter ����Dz/A to be zero in Eqn.(9) restores the expression for the single pile, i.e.
![]() (10)
(10)
Next, in order to express the degree of reducing dragload by installing piles in group, the group efficiency parameter �� was introduced in the form:
 (11)
(11)
where H0 is the distance from the ground surface to the neutral point of the given pile. The substitution of Eqns.(9) and (10) into Eqn. (11) allows the group efficiency parameter to be expressed as
![]() (12)
(12)
where ![]()
Using triangle of hatched section (S��1 and S��2) shown in Fig.1(a) can calculate the effective influence area. The simplified style of Ai was obtained. Its precise results satisfy the demands of practical engineering.
![]() (i=1, 2, 3) (13)
(i=1, 2, 3) (13)
where ![]() equals 0.77, 1.77 and 2.70 when i equals 1, 2 and 3, respectively, and S is the spacing of pile.
equals 0.77, 1.77 and 2.70 when i equals 1, 2 and 3, respectively, and S is the spacing of pile.
Pile groups are arranged in a hexagonal arrangement, as shown in Fig.2. From the same reason as stated above it can be concluded that Eqn.(12) adapts to the pile group of hexagonal pattern as well when parameter Ai is modified.
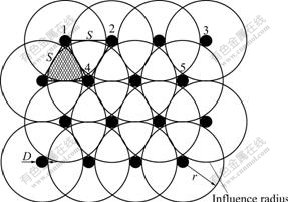
Fig.2 Example of pile group in hexagonal arrangement
And for the need of practical engineering, the area of the hatched section is calculated by the triangle instead of curve side triangle. Then,
![]() (i=1, 2, 3, 4, 5) (14)
(i=1, 2, 3, 4, 5) (14)
where ![]() equals 7/3, 3, 5/3, 4 and 11/3 when i is from 1 to 5, respectively, and S��=0.433��S2.
equals 7/3, 3, 5/3, 4 and 11/3 when i is from 1 to 5, respectively, and S��=0.433��S2.
Before closing this sub-section it may be appropriate to supplement that Eqn.(12) can be reduced to Eqn.(15a) when the surface loading term (p-term) dominates, whereas Eqn.(12) can be reduced to Eqn.(15b) when the body-force term (�á�H0-term) dominates.
![]() (15a)
(15a)
![]() (15b)
(15b)
For S��6.0D, �� = 0.
3 Experimental
3.1 Test description
A series of pile group model tests were arrangement in a steel tank (1 500 mm��700 mm��1 000 mm) with 10 mm in thickness. As the influence zone of piles was in the pile diameter range of 3-8, the tank in this work was sufficiently large enough to reduce the effect of the
edges [12]. At the bottom of the tank side, there were 12 holes whose pore size was 10 mm and pile distance was 175 mm for drained consolidation.
Model piles were prepared from plexiglas pipes of 1 000 mm in length (L), 40 mm in outer diameter and 3 mm in thickness with strain gauge on the inner wall of the pipe piles and micro-earth pressure cell on the tip of piles. This physical diagram of model test apparatus is shown in Fig.3.
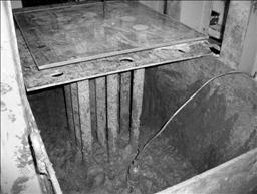
Fig.3 Physical diagram of model test apparatus
In order to improve the friction coefficient of pile-soil interface, sand with particle size of 0-2 mm was pasted on the pile surface. So the real average pile diameter (D) was nearly 41 mm. The modulus of pile (Ep) was 2.3��103 MPa [13]. Pile cap was prepared for 2��2 and 3��3 pile groups (at 3.0D and 4.0D spacing) using 10 mm thick organic glass with sizes of 350 mm�� 350 mm and 600 mm��600 mm, respectively. The length of embedment of pile in clay bed was 700 mm, while H0/D was 17.1, and the surface load (p) equaled 5.1 kPa.
The pile-soil interface friction coefficient (��) was found to be 0.59 from the direct shear test (SII test) [14]. The spacing of pile group (S) was set as 3.0D and 4.0D in the test, and single pile was also tested in the same condition for comparison. Experiment set-up and pile arrangement are shown in Fig.4.
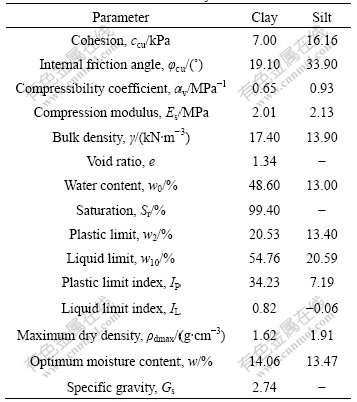
The model piles were embedded in 700 mm thick homogeneous saturated or near saturated clay bed, and 200 mm thick silt was used as bearing stratum. The parameters of saturated clay and silt for test are listed in Table 2.
3.2 Test procedure
Strain gauges were arranged on the inner wall of the pipe piles in order to test the skin friction of pile shaft, whose surfaces were protected by epoxy resin. The positions are shown in Fig.4. Firstly, sand was put into the model tank for drainage layer. Its thickness was 50 mm, and pore size of sand was 2-10 mm. Fine gauze was put nearby the draining hole to avoid sand outflow. Secondly, 200 mm thickness silt was backfilled into the tank twice by artificial method for bearing stratum. Thirdly, model piles were arranged on the designed position where micro-earth pressure cells were arranged on the tip of piles. Fourthly, the saturated or near saturated clay was pushed into the tank. A settlement standard (4.5 mm diameters slender steel rod with 40 mm��50 mm thin steel sheet welded on one side and dial gauge on the other side) was set on -70 cm and -35 cm soil layers and small PVC pipe with holes on side used for draining water to improve consolidated speed in the same time. Finally, pile cap was put on the top of
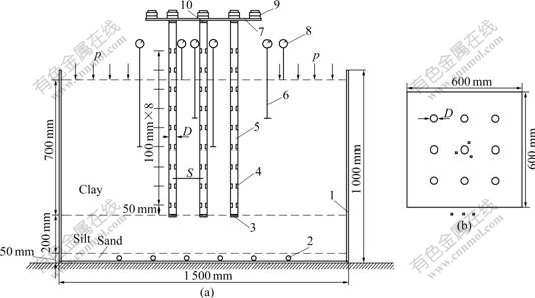
Fig.4 Experimental set-up (a) and pile arrangement (b): 1��Model tank; 2��Drain hole; 3��Micro-earth pressure cell; 4��Strain gauge; 5��Model piles; 6��Settlement standard; 7��Model pile cap; 8��Dial gauge; 9��Dead load; 10��Flexible gasket
Table 2 Parameters of saturated clay and silt for test
piles, and flexible gasket between pile cap and pile top was set to balance the force of each piles.
After the burying process and standing for 12 h, the test was carried out. Based on the fast load-keeping method on JGJ94��2008 code, the pile cap was step- loaded every 15 min by using weight. After pile head load, nearly 5.1 kPa surface load was applied. When the values tended to be stable, pile head load was unloaded steeply.
4 Results and discussion
Four different conditions, such as single pile, 2��2 pile group (3D), 2��2 pile group (4D) and 3��3 pile group (4D) were tested in this work. The results and discussion are as follows.
4.1 Settlement of pile cap under load-unload on pile cap
Fig.5 shows that the settlement of pile cap reaches the maximum when the load of pile tope reaches the maximum. In the same single pile loading condition, the maximum settlement of pile cap of 3��3 pile group (4D) equals 72.5% of that of 2��2 pile group (4D), and the maximum settlement of pile cap of 2��2 pile group (4D) equals 60.0% of that of 2��2 pile group (3D). This also shows that in the same single pile loading and pile spacing condition, the settlement of pile cap will be increased with the increase of pile numbers. In the same pile number condition, the settlement of pile cap will be decreased with the increase of pile spacing (S��6D). In
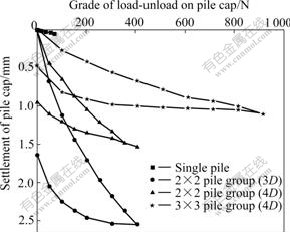
Fig.5 Curves of load-unload on pile cap vs settlement of pile cap
addition, the settlement of single pile cap is small because of the influence of pile self weight and loading force.
4.2 Resistance of pile tip under load-unload on pile cap
The resistance of pile tip reaches the maximum value when the pile top loads of single pile, 2��2 pile group and 3��3 pile group reach the maximum load 72.25, 408 and 918 N, respectively. It is nearly in linear growth relationship between loading of pile cap and the resistance of pile tip, as shown in Fig.6.
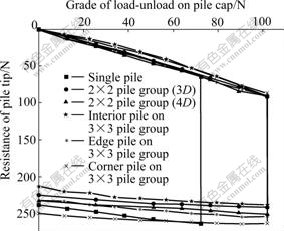
Fig.6 Curves of load-unload on pile cap vs resistance of pile tip
4.3 Resistance of pile tip with consolidation time
Fig.7 shows that the resistance of pile tip increases with the increase of consolidation time, while the increasing rate changes from quick to slow and to a stable value at last in the process of consolidation. The resistance of single pile tip increases slower than that of 2��2 pile group because of the smaller load of single pile
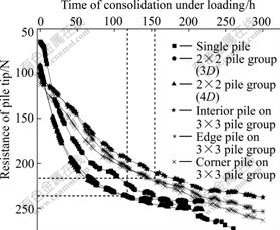
Fig.7 Curves of resistance of pile tip vs consolidated time
cap. It also shows that the tip resistances of interior pile, edge pile and corner pile on 3��3 pile group (4D) reach 238, 253.8 and 263.6 N respectively after 300 h consolidation, in which the tip resistance of corner pile is equal to 111% of interior pile and 104 % of edge pile.
4.4 Axial force of pile shaft with pile depth
Take the contact department of pile and soil surface as zero point. The axial force of pile equals the load of pile top behind the zero point, while below the zero point negative skin friction of pile side caused by pile-soil relative displacement leads to an increase part of axial force of pile, i.e. dragload. Fig.8 shows that axial force of single pile or pile group changes with the depth of pile. The increasing rate becomes gentle when the pile depth increases. This is because the pile-soil relative displacement of upper soil layer is larger than that of lower soil layer, which leads to negative skin friction of pile shaft larger on upper part of pile. Fig.8 also shows that axial force of single pile or pile group increases with the increase of consolidated time, while increasing rate becomes gentle. Negative skin friction of pile shaft develops gradually along the depth of pile, when pile-soil relative displacements increase. The neutral point develops to nearly 0.9H (where H equals the thickness of clay) after 240 h consolidated time.
4.5 Layered settlement of soil with consolidation time
Fig.9 shows that layered settlement of soil inside or outside of pile group increases gradually with the increase of consolidated time, while the increasing rate changes from quick to slow and to a stable value at last. Settlement on the surface is larger than that on the interface layer of clay, and settlement of external pile group is larger than that of internal pile group. It can be seen that the internal and external settlement ratio (Rf) of 2��2 pile group (3D) on -35 cm layer equals 0.85, Rf of 2��2 pile group (4D) on -35 cm layer equals 0.92, Rf of 3��3 pile group (4D) on surface (0 cm) layer equals 0.95, and Rf of 3��3 pile group (4D) on -35 cm layer equals 0.70. This also shows that the layered settlement of soil of single pile is larger than that of pile group in the same consolidated time as pile restricts the settlement of soil. Rf increases with the growth of pile spacing when the pile group is in the same pile numbers condition. Rf decreases with the growth of pile numbers in the same pile spacing. In the same pile group, the internal and external settlement ratio of upper part is larger than that of the lower part.
When pile-soil relative displacement reaches 2 mm, negative skin friction will approximately reach 80%- 90% of the maximum value, as shown in Figs.7 and 9. The results are similar to those obtained in Ref.[15].
5 Verification by test results and previous observations
Comparing the predicted data obtained by using the present method with the experimental data obtained by the present investigation, the accuracy of the model was further checked with the experimental data reported by various investigators as follows. The details of the pile arrangements are shown in Fig.10, and the principal items regarding each pile test are listed in Table 3.
5.1 Example case studied by LITTLE [16]
Measurements of dragloads for two 3��3 pile groups (friction piles and end-bearing piles) with pile spacing of 4.0D (D equals 0.406 m) were presented by LITTLE [16] (for the position of piles, refer to Fig.10(a)). The friction piles were driven to 20.4 m, approximately 1 m above the gravel layer. The end-bearing piles were driven onto the gravel layer, and the piles length was 20.8 m. The soil modulus (Es) of 3.5 MPa was back-calculated for the clay layer from the measured ground settlement (180 mm). The interface friction coefficient��of 0.35 was used, which was typical for a driven concrete pile. The submerged unit weight of soil (�á�) equaled 9 kN/m3, �� equaled 0.3, the effective cohesion (c��) equaled 3.0 kN/m2 and effective friction angle (�ա�) equaled 25?. An embankment loading of 40 kPa was applied on the top of the clay after driving the piles. The measured and predicted results are shown in Fig.11.
5.2 Example case studied by COMBARIEU [17] and JEONG [5]
Measurements of dragloads for 3��4 pile group with 3.54D pile spacing were presented by COMBARIEU

Fig.8 Curves of axial force of pile shaft vs pile depth: (a) Single pile; (b) 2��2 Pile group (3D); (c) 2��2 Pile group (4D); (d) Interior pile on 3��3 pile group (4D); (e) Edge pile on 3��3 pile group (4D); (f) Corner pile on 3��3 pile group (4D); (g) 240 h
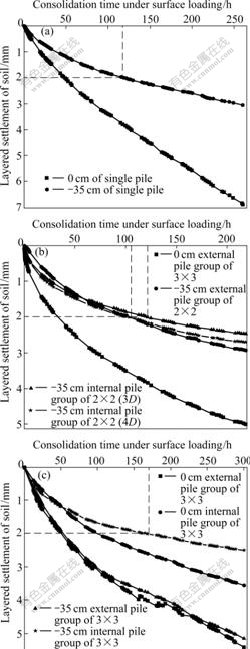
Fig.9 Curves of layered settlement of soil vs consolidation time: (a) Single pile; (b) 2��2 Pile group; (c) 3��3 Pile group
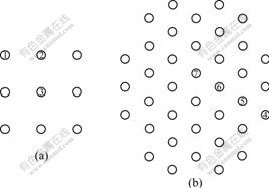
Fig.10 Arrangement of pile group and code of typical piles: (a) Rectangular arrangement; (b) Hexagonal arrangement
Table 3 Principal parameters of test
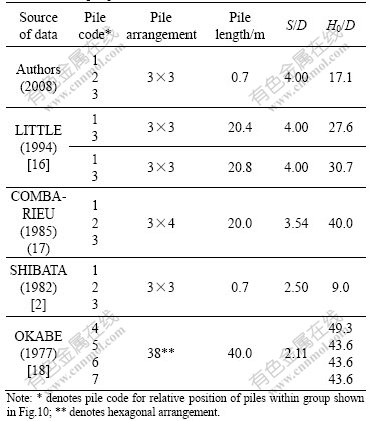
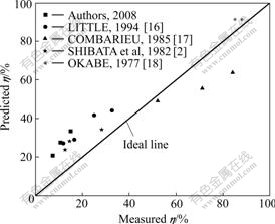
Fig.11 Comparisons of measured and predicted group efficiency parameter ��
[17] and JEONG [5]. The model pile length (L) equaled 20 m, and pile diameter (D) equaled 0.5 m. The soil properties were that the submerged unit weight of soil (�á�) equaled 18 kN/m3, �� equaled 0.3, the effective cohesion (c��) equaled 30.0 kN/m2, and the surface load (p) equaled 200 kPa. Assuming a K value of 0.6-0.7 for normally consolidated clay and a �� value of 0.3 as given by COMBARIEU [17], a rough estimate for interface friction coefficient (��) of 0.4 and 0.5 was obtained. The stiffness modulus (Es) of clay was taken to be 5 and 10 MPa, respectively. The measured and predicted results are shown in Fig.11.
5.3 Example case studied by SHIBATA et al [2]
Model tests for a single pile and piles in group were carried out by SHIBATA et al [2]. The model steel pipe piles had an outer diameter (D) of 0.06 m, a length (L) of 0.7 m and wall thickness (d) of 1.2 mm. The pile group consisted of 3��3 piles with a spacing (S) of 2.5D (for pile positions, refer to Fig.10(a)). The modulus of the steel pipe pile (Ep) equaled 15.7��106 kPa. The piles were assumed as end-bearing. The clay model was formed from kaolin slurry under self-weight consolidation, which had the following index properties: wL equaled 52%, wp equaled 39%, clay fraction equaled 39%, and specific gravity equaled 2.61. The effective unit weight of the clay slurry (�á�) was equal to 5.3 kN/m3. A surface loading of 20 kPa was applied on the top of the clay surface to produce soil settlement after completion of the self-weight consolidation. The soil modulus (Es) of 150 kPa was assumed from the consideration of measured soil settlement (65 mm). The measured results showed that the dragload of single pile reached 410 N after consolidation, and the corner pile, edge pile and central pile of 3��3 pile group reached 358, 350 and 294 N, respectively. The measured and predicted group effect results are shown in Fig.11.
5.4 Example case studied by OKABE [18]
Full-scale field measurements of dragload in a pile group, resulting from a combination of draining and surcharge loading were reported by OKABE [18]. The pile group consisted of 38 piles with 2.11D pile spacing. The diameter of the pile (D) was 0.71 m and embedded length (L) was 40 m (the arrangement of pile group was shown in Fig.10(b)). There were 14 external piles free to move, which took most of the NSF. The other 24 internal end-bearing piles were connected to a rigid pile cap. After installation of the piles, the embankment as a surcharge was placed on a very soft clay layer with SPT N-values of 0-10 and unconfined compressive strength of 0-110 kN/m2 from 0 to 40 m in depth. Below the soft clay was a medium sandy gravel layer with SPT N-values of about 50. Ground settlement was reported both by the fill and dewatering from the underlying aquifer for urban water supply. The properties of the soft clay were assumed as follows: the submerged unit weight of soil (�á�) 18 kN/m3, �� 0.3, the soft clay elastic modulus (Es) 5 MPa, the effective cohesion (c��) 5.0 kN/m2 and effective friction angle (�ա�) 25?. The soil settlement reached 10 cm on ground surface after 300 d at a 5.6 m surcharge placement, and the surface load (p) equaled 250 kPa. The measured and predicted results are shown in Fig.11.
Computations of group efficiency parameter �� were made by using Eqns.(12) and (13) for the pile group of rectangular arrangement, and Eqns.(12) and (14) for the pile group of hexagonal arrangement. It was evident from Fig.11 that there was a good agreement between the measured and predicted values of the group efficiency parameter.
6 Conclusions
(1) A simple calculation formula to predict the group efficiency parameter of pile group under dragload is built by assuming an effective influence area. Pile group arrangement, embedment length to diameter ratio of piles, pile spacing, soil properties such as angle of internal friction, density and pile-soil interface friction coefficient are considered. The calculation formula is simple and the parameters in the formula are easy to obtain, especially for the simplified effective influence area which accords with engineering demand. The calculated results and measured data from the model test and previous observations are in excellent agreement, which indicates that the presented approach is feasible for applications in engineering practice.
(2) The model test results show that the dragload of pile group has group effect, and the group efficiency parameters are different in different pile positions. There exists time effect during the development of negative skin friction of pile shaft. The drag load increases with the increase of consolidated time, while the increasing rate becomes gentle at last. When pile-soil relative displacement reaches 2 mm, the negative skin friction will reach 80%-90% of the maximum value approximately.
References
[1] FELLENIUS B H. Recent advances in the design of piles for axial loads, dragloads, downdrag, and settlement [C]// Proceedings of a Seminar by American Society of Civil Engineers. New York, 1998.
[2] SHIBATA T, SEKIGUCHI H, YUKITOMO H. Model test and analysis of negative friction acting on piles [J]. Soils and Foundations, 1982, 22(2): 29-39.
[3] KONG Gang-qiang, YANG Qing, ZHENG Peng-yi, LUAN Mao-tian. Model test study on negative skin friction for inclined pile groups considering time effect [J]. Chinese Journal of Geotechnical Engineering, 2009, 31(4): 617-621. (in Chinese)
[4] POULOS H G. A practical design approach for piles with negative friction [J]. Geotechnical Engineering, 2008, 161(1): 19-27.
[5] JEONG S. Nonlinear three dimensional analysis of downdrag on pile group [D]. Texas: Texas A & M University, 1992.
[6] JEONG S, LEE J, LEE C J. Slip effect at the pile-soil interface on dragload [J]. Computers and Geotechnics, 2004, 31(2): 115-126.
[7] CHOW Y K, LIM C H, KARUNARATNE G P. Numerical modeling of negative skin friction on pile group [J]. Computers and Geotechnics, 1996, 18(3): 201-224.
[8] LEE C J, BOLTON M D, AL-TABBAA A. Numerical modeling of group effects on the distribution of dragloads in pile foundations [J]. Geotechnique, 2002, 52(5): 325-335.
[9] COMODROMOS E M, BAREKA S V. Evaluation of negative skin friction effects in pile foundations using 3D nonlinear analysis [J]. Computers and Geotechnics, 2005, 32(4): 210-221.
[10] POULOS H G. Piles subjected to negative friction: A procedure for design, geotechnical engineering [J]. Journal of Southeast Asian Geotechnical Society, 1997, 28(1): 23-44.
[11] FELLENIUS B H. Results from long-term measurements in piles of drag loads and downdrag [J]. Canadian Geotechnical Journal, 2006, 43(4): 409-430.
[12] ZHAO Ming-hua, JIANG Chong, CAO Wen-gui, LIU Jian-hua. Catastrophic model for stability analysis of high pile-column bridge pier [J]. Journal of Central South University of Technology, 2007, 14(5): 725-729.
[13] ZAI Jin-min, JIANG Gang, WANG Xu-dong, LI Xiong-wei, HE Li-ming. Model test on pile-raft foundation interaction under ultimate load [J]. Chinese Journal of Geotechnical Engineering, 2007, 29(11): 1597-1603. (in Chinese)
[14] XIAO Hong-bin, ZHANG Chun-shun, HE Jie, FAN Zhen-hui. Expansive soil-structure interaction and its sensitive analysis [J]. Journal of Central South University of Technology, 2007, 14(3): 425-430.
[15] KISHIDA H, UESUGI M. Test of the interface between sand and steel in the simple shear apparatus [J]. Geotechnique. 1987, 37(1): 45-52.
[16] LITTLE J A. Downdrag on piles: Review and recent experimentation [C]// Proceedings of Settlement 94: Vertical and Horizontal Deformations of Foundations and Embankment. New York: Geotechnical Special Publication, 1994: 1805-1826.
[17] COMBARIEU O. Frottement n��gatif sur les pieux, Rapport de recherche LCPC, No. 136[R]. Paris: Laboratoire Central des Ponts et Chauss��es, 1985.
[18] OKABE T. Large negative friction and friction-free pile methods [C]// Proceedings of the 9th International Conference on Soil Mechanics and Foundation Engineering. Tokyo, 1977: 679-682.
(Edited by YANG You-ping)
Foundation item: Project(50679015) supported by the National Natural Science Foundation of China
Received date: 2008-08-10; Accepted date: 2008-11-25
Corresponding author: YANG Qing, Professor; Tel: +86-411-84708511; E-mail: qyang@dlut.edu.cn
