

Temperature and stress fields of multi-track laser cladding
ZHAO Hong-yun (�Ժ���), ZHANG Hong-tao(�ź���), XU Chun-hua(�촺��), YANG Xian-qun(����Ⱥ)
School of Materials Science and Engineering, Harbin Institute of Technology at Weihai,
Weihai 264209, China
Received 10 June 2009; accepted 15 August 2009
Abstract:
Based on genetic algorithm and neural network algorithm, the finite element analyses on the temperature fields and stress fields of multi-track laser cladding were carried out by using the ANSYS software. The results show that, in the multi-track cladding process, the temperature field ellipse leans to the cladding formed, and the front cladding has preheating function on the following cladding. During cladding, the longitudinal stress is the largest, the lateral stress is the second, and the thickness direction stress is the smallest. The center of the cladding is in the tensile stress condition. The longitudinal tensile stress is higher than the lateral or thickness direction stress by several times, and the tensile stress achieves the maximum at the area of joint between the cladding and substrate. Therefore, it is inferred that transversal crack is the most main crack form in multi-track laser cladding. Moreover, the joint between cladding and substrate is the crack sensitive area, and this is consistent with the actual experiments.
Key words:
finite element analysis; multi-track cladding; stress field; transversal crack;
1 Introduction
The laser cladding, as a new material processing, is a superficially modified technology. It has high energy density, good controllability, compact cladding microstructure, few microscopic flaw, and high bonding strength. And it has also many advantages in the technological process, such as being easy to realize automation, little pollution to the environment, no radiation, and low noise[1-2]. So, widespread interests have been aroused.
Laser cladding is a process of heating, phase transformation, cooling, and coagulation, whose thermal process is complex. Because its heating and cooling are very quick, large internal stress will occur, which causes the components of laser cladding contorted and cladding cracked, and so on[3-5]. This has serious influence on the quality of the cladding components, even causes the components abandoned. Therefore, researching the producing principle of the stress of laser cladding, and then proposing the methods to reduce and eliminate the residual stress have the vital practical significance to perfect and popularize the laser cladding technology [6-10].
2 Testing methods and materials
The power for the test is a crossflow CO2 JKF-6 laser, with a wide band cladding powder feeder. The size of nozzle section is 15 mm��(0.7-0.8) mm, and the size of facula is 25 mm��2 mm. The light beam pattern is in the multi-mold, and the work table is the X-Y 2-coordinate lathe controlled by SCM.
The matrix material is the Q235 steel plate, and the cladding material is Ni60 self fluxing alloy. The granularity of cladding material is 50-60 ?m, and the loose-packed density of the powder is 4.16 g/cm3.
The temperature and stress fields of the laser cladding were forecasted by the simulation software of ANSYS on the basis of genetic algorithm and neural network algorithm.
3 Temperature field of laser cladding
3.1 Physical model
The heat source model was divided into two parts of the substrate and the powder. The powder receives heating from the laser beam before arriving at the substrate. Because the time is extremely short, it is supposed that all the power absorbed by the powder in flight process is used in temperature rising completely, and temperature of powder after rising is exerted to cladding units. According to Picasso theory, the energy absorption of the substrate was divided into two parts: the direct absorption and the heat transfer. The direct absorption was realized through the form of body heat. The temperature rising was computed by analysis methods. The heat source model of laser beam was considered a heat source of columnar Gauss body [11-13].
The moving program of the heat source was compiled in APDL language. In actual operation, Decca coordinate system was used as solution coordinate system throughout. The load was exerted under the partial coordinate system, so the transformation from time to spatial was realized by the coordinate transformation in cladding direction, namely the Z axis direction. The growth process of the cladding units was simulated simultaneously depending on the life and death unit technology of ANSYS[14-15].
3.2 Simulation analysis on temperature field of single- track laser cladding
The simulation realizes the process that the cladding grows gradually along with the movement of laser facula. Fig.1 shows a distribution chart of the temperature field in a moment. It is shown that, the substrate scanned by the laser beam will form cladding, and the cladding units that have not been scanned were ��killed to death��. Fig.1 does not show the death units, and this process is similar with the actual laser cladding process. In Fig.1, the highest temperature of the cladding center is 2 372 K, higher than the melting point of the cladding material.
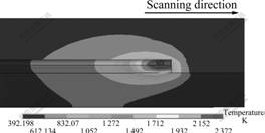
Fig.1 Cloud chart of temperature field at some time
Fig.2 shows the contrast image between the actual molten pool and the simulated molten pool, and they are consistent basically. The simulated fusion depth is 0.5 mm, and the actual fusion depth is 0.48 mm. The fusion depth of the substrate is shallow, which is in agreement with the low dilution in actual laser cladding. And the substrate under the entire cladding has a certain fusion depth, which ensures the bonding strength between the substrate and the cladding. So, the model used in this work is reasonable, and it can be used in the next simulation analysis.
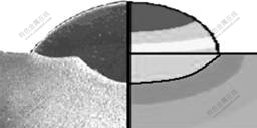
Fig.2 Simulated and actual molten pool
4 Temperature field of multi-track laser cladding
In the actual production, the laser cladding is actually a multi-track bead welding process. In this experiment, the laser power is 2.0 kW, the scanning rate is 3.0 mm/s, the speed of delivering powder is 71.36 mg/s, the initial temperature of the cladding powder is 1 570 ��, and the power of the substrate absorption is 816 W. The simulation is the same as the single track cladding, with the cladding and nearby mesh refined. Fig.3 shows a schematic diagram of multi-track laser cladding points, and the overlap ratio takes 20%.
One track cladding needs 16.667 s, and the return time of the laser is 1 s, that is, overlapping time-gap is 1 s. Completing 3-track cladding needs approximately 52 s, and all the tests are in the condition of cooling in air. Fig.4 shows the cloud charts of the temperature field at different moments. Fig.4(a) shows the temperature field when the second cladding finishes, and the temperature field presents a towed semi-ellipse. Fig.4(b) shows the temperature field distribution after the laser returns, and the temperature field is no longer the towed ellipse, whose maximum temperature is 861.602 K, lowest temperature is 630.836 K, and the temperature drops very quickly. Fig.4(c) shows the temperature field distribution of the third cladding process, and the temperature field presents a towed partial ellipse. The ellipse of temperature field is not symmetrical by the center of the facula, but forms the deviation on one side of the cladding, which is the difference between the multi-track temperature field and the single-track cladding. The phenomenon that the multi-track cladding forms the partial ellipse, is induced by the influence of the former cladding on the latter one. There is an initial temperature difference between the cladding region and non-cladding region. Fig.4(d) shows the temperature field distribution at the time of 310 s later from the beginning. It can be seen that the temperature field becomes a sealed ring with the medium temperature of the entire workpiece higher than that at perimeter, but the temperature difference is only 2 K, and the temperature field is in the stable state.
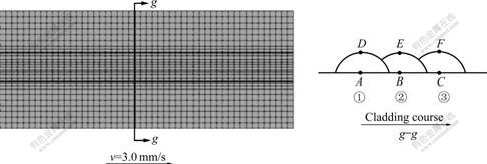
Fig.3 Order of multi-track laser cladding and points taken
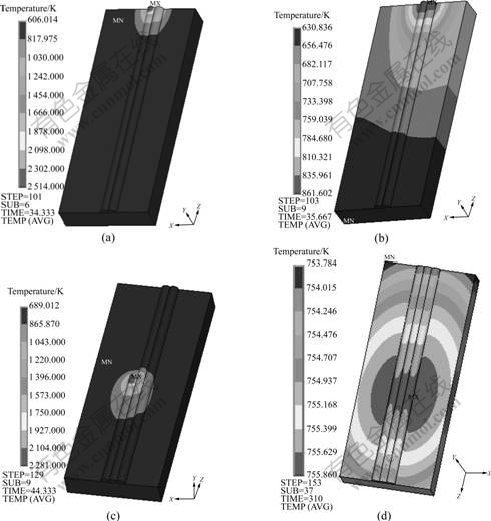
Fig.4 Cloud charts of temperature field: (a) t=34.333 s; (b) t=35.667 s; (c) t=44.333 s; (d) t=310 s
Along with increasing tracks of the cladding, the temperature field of the entire workpiece tends to be balanced, and the influence of the temperature field of the former track on the latter one becomes smaller and smaller, so the towed partial ellipse of the multi-track cladding gradually turns to towed ellipse.
5 Stress field of laser cladding
The internal stress in the laser cladding is the typical heat stress formed as a result of the material temperature change, and the most direct-viewing flaw is the lateral coagulation crack. Therefore, the heat stress fields are constructed on the basis of the temperature fields above. The initial conditions are: ambient temperature 293 K, and stress 0 MPa. Using the life and death unit technology of ANSYS, the growth process of the cladding was simulated. All the cladding units were killed before the cladding started, and at each step of heat stress computation, the computed result of corresponding temperature field was loaded to the model of stress field. Before the computation started, the attribution of molten metal was defined, including cladding powder and substrate in the melted state, and their yield strength and elasticity coefficient were defined to be very low without changing along with temperature. The mechanical property parameters of the cladding material and the substrate not melted will change along with temperature.
Fig.5 shows the distribution of longitudinal stress field in the cladding process. It can be found that, the substrate in front of the pool produces heat expansion, which is restricted by the materials around, so it has the non-uniform compression plastic deformation. In the compress stress condition, the stress of the cladding metal in the pool nearby is equal to zero. The coagulated cladding metal is in the tensile stress condition, and the center of coagulated cladding approaching the substrate is the area where the tensile stress is the largest. Because the temperature gradient in this region is the largest, the thermal stress produced should also be the largest.
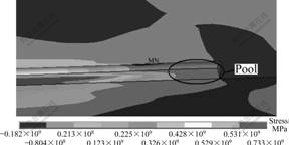
Fig.5 Cloud chart of longitudinal stress distribution
Fig.6(a) shows the contour map of temperature field of the longitudinal residual stress at time of 600 s. In this chart, the maximal longitudinal residual stress is ��z, max= 978 MPa, and it appears in the cladding approaching to the surface of the substrate. This is determined by the differences between the cladding material and the matrix. The yield strength and shear modulus of cladding material are both higher than those of the substrate, and temperature difference of cladding is large, so the larger residual stress is caused. Fig.6(b) shows the contour map of temperature field of the transverse residual stress after cooling for 600 s, and the maximum of transverse residual stress appears in the interface of the cladding boundary and substrate, ��x, max=378 MPa.
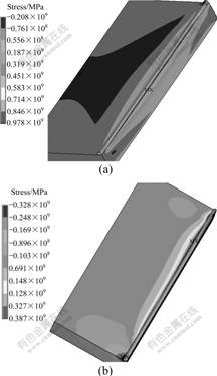
Fig.6 Cloud charts of residual stress distribution: (a) Longitu- dinal residual stress; (b) Lateral residual stress
Fig.7 shows the curves of the stress of one point in cladding center changing along with cladding time. Before the laser facula arrives at this point, the unit of this point is killed, and the computation value of the stress field is zero. When the time is 6.667 s and the laser facula shines on this point, the unit is activated, and the temperature achieves the melting point rapidly. At this moment, the yield strength, shear modulus, elastic modulus and so on in the fusing unit are all very small, and the computation value of stress field is approximately zero. When the time is 7.333 s, the laser facula emigrates from this point, the temperature reduces rapidly to the melting point, and this point starts to coagulate. With the temperature continuing to decrease, the material contracts induced by cooling. But the behavior of contraction is not free, which is limited by the parent metal or the temperature non-uniformity, and it is in the tensile stress condition. The restraint to the contraction in each direction is different. The tensile stress is different. The longitudinal stress is the largest, the transverse stress is the second, and the thickness direction stress is the smallest. In the plastic range, the tensile stress is decided by the flow stress of the material. Along with the temperature dropping, the flow stress increases, and the tensile stress has the trend of escalation. After the material enters the elastic stage, lateral and Z-direction tensile stresses drop obviously, and the longitudinal stress maintains basically.
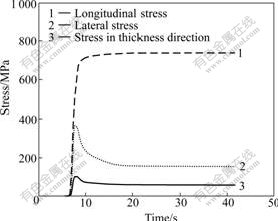
Fig.7 Stress changing with time
The changing progresses of three-direction strain at this point in cladding center are shown in Fig.8, including thermal strain, elastic strain, plastic strain and total strain. When t=6.0-6.33 s, this point is just in the laser facula, and at the melted state, therefore the situation appears that the strain rises suddenly, but the distortion at melted state does not have the influence on the distortion of the material coagulating later. With the laser facula leaving away, the temperature of this point is reduced rapidly, and the strain is reduced rapidly too. In the elastic stage, the total strain goes gently. It is also found that, in the three strains, the thermal strain is the largest, and it is always larger than zero, but the plastic strains of lateral and Z-direction are smaller than zero. The plastic strain of longitudinal direction is larger than zero. No matter how the expressions of the elastic strain and the plastic strain change, the total strain is always larger than zero. This indicates that, whether the materials have tensile or plastic deformation depends on the thermal strain. The final situation is that the lateral strain is smaller than zero, the thickness direction strain tends to zero, and the longitudinal direction strain is the largest.
Fig.9 shows the cloud charts of the lateral and Z-direction strain after cooling. It can be seen that the lateral and Z-direction strains change from positive to negative along with the way from cladding surface to substrate. The positive strain is only at the surface of cladding, and the negative strain achieves the maximum in the area near the pool (substrate). In Fig.9(b), the longitudinal strain in the cladding changes from negative to positive along with the way from cladding surface to substrate; the largest positive strain is in the cladding-side pool; and the longitudinal shrinkage of the cladding is obvious. No matter it is in positive or negative strain, the strain at the cladding surface is smaller than that at the joint between the cladding and the substrate. So, the crack sensitive areas are in the center of the cladding and the joint between the cladding and the substrate.
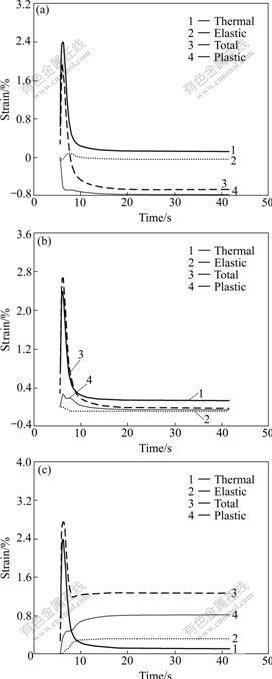
Fig.8 Change of strain with cladding time: (a) Lateral strain; (b) Z-direction strain; (c) Longitudinal strain
Fig.10 shows the curves of the longitudinal stress and the lateral stress changing along with Z-direction after 600 s cooling. It is shown that, the longitudinal stress of the cladding which is defined in 1 mm, achieves the maximum at the joint between the cladding and the substrate. The lateral stress in the cladding changes from pressing to pulling and then to pressing, and the tensile stress also achieves the maximum which is about 20% of the maximum longitudinal stress at the joint between the cladding and the substrate. So, the joint is the crack sensitive area, and the transversal crack is the main form of cracking.
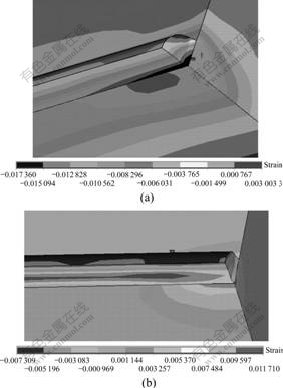
Fig.9 Cloud charts of strain: (a) Lateral and Z-direction strain; (b) Longitudinal strain
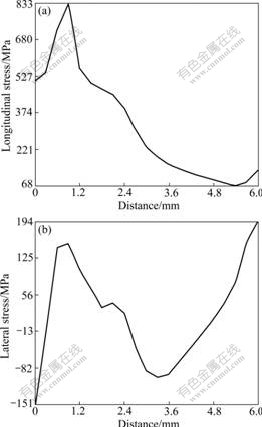
Fig.10 Curves of stress: (a) Longitudinal stress; (b) Lateral stress
Because the cooling rate of cladding center is low, the concreting and shrinking rate is also lower than that around. Among the three-direction stresses, the longitudinal stress is much larger than others, so that the longitudinal bounding function is more serious, and finally longitudinal direction has tensile strain, and other two have compress strain, which causes the transversal cracks. This is consistent with the actual experiments. Fig.11 shows the appearance and distribution of transversal cracks in actual experiments.
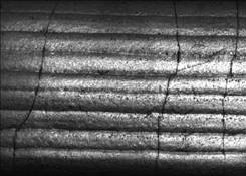
Fig.11 Transversal cracks of laser cladding
6 Conclusions
1) The finite element model of the laser cladding process is founded, and the delivering process of powder in the laser cladding is realized by the life and death units technology of ANSYS. From the simulations, the fusion depth of substrate is shallow, which is consistent with the low dilution ratio in the actual experiments. The simulated depth of fusion is 0.5 mm, and that in the actual experiments is 0.48 mm, which proves that the model used to simulate the temperature field of laser cladding is reasonable.
2) The temperature field of multi-track cladding looks like a towed partial ellipse. It is not symmetrical by the center of the laser facula, but inclines to the cladding layers, which is the difference of the temperature fields between the multi-track and the single-track.
3) The front tracks have preheating function on the following tracks. No matter in the substrate or the cladding, the maximum temperature of the next track is higher than the former.
4) The stress fields are simulated based on the temperature field, and the kinetic simulations are realized on the stress field changing along with the time. The results indicate that the longitudinal stress of the cladding is the largest (978 MPa), the lateral stress is the second, and thickness direction stress is the smallest. The center of the cladding is in the tensile stress condition. The longitudinal tensile stress is higher than the lateral and thickness direction stress, and achieves the maximum in the joint of cladding and substrate.
5) The transversal crack is the most main crack form. Moreover, the joint of cladding and substrate is the crack sensitive area, and this is consistent with the actual experiments.
References
[1] KATHURIA Y P. Some aspects of laser surface cladding in the turbine industry [J]. Surface and Coatings Technology, 2000, 132: 262-269.
[2] SEXTON L, LAVIN S, BYRNE G, KENNEDY A. Laser cladding of aerospace materials [J]. Journal of Materials Processing Technology, 2002, 122: 63-68.
[3] WANG D, LIANG E, CHAO M. Investigation on the microstructure and cracking susceptibility of laser-clad V2O5/NiCrBSiC alloy coatings [J]. Surface and Coatings Technology, 2008, 202: 1371- 1378.
[4] JENDRZEJEWSKI R, SLIWINSKI G, KRAWCZUK M, OSTACHOWICZ W. Temperature and stress fields induced during laser cladding [J]. Computers and Structures, 2004, 82: 653-658.
[5] JENDRZEJEWSKI R, KREJA B I, SLIWINSKI G. Temperature distribution in laser-clad multi-layers [J]. Mater Sci Eng A, 2004, 379: 313-320.
[6] ZHANG Kai, LIU Wei-jun, SHANG Xiao-feng. Research on the processing experiments of laser metal deposition shaping [J]. Optics & Laser Technology, 2007, 39: 549-557.
[7] CLALAS K, TSIRBAS G, CHRYSSOLOURIS K. Analytical model of the laser clad geometry [J]. Int J Adv Manuf Technol, 2007, 32: 34-41.
[8] ZHU Wei-dong, LIU Qi-bin, LI Hai-tao, ZHENG Min. A simulation model for the temperature field in bioceramica coating cladded by wide-band laser [J]. Materials and Design, 2007, 28: 2673-2677.
[9] DAVIM P, OLIVEIRA C, CARDOSO A. Predicting the geometric form of clad in laser cladding by powder using multiple regression analysis (MRA) [J]. Materials & Design, 2007, 1: 1-4.
[10] ONWUBOLU G C, DAVIM J P, OLIVEIRA C. Prediction of clad angle in laser cladding by powder using response surface methodology and scatter search [J]. Optics & Laser Technology, 2007, 39: 1130-1134.
[11] COSTA L, VILAR R, RETI T, DEUS A. Rapid tooling by laser powder deposition: Process simulation using finite element analysis [J]. Acta Materialia, 2005, 53: 3987-3999.
[12] SANTOS E C, SHIOMI M, OSAKADA K. Rapid manufacturing of metal components by laser forming [J]. International Journal of Machine Tools & Manufacture, 2006, 46: 1459-1468.
[13] KUMAR S, ROY S. Development of theoretical process maps to study the role of powder preheating in laser cladding [J]. Computational Materials Science, 2006, 37: 425-433.
[14] ZHAO Hong-yun, YANG Xian-qun, SHU Feng-yuan, XU Chun-hua. Camparative analysis on predictions of the geometric form of laser cladding [J]. Transactions of the China Welding Institution, 2009, 30: 51-54. (in Chinese)
[15] HUANG Yan-lu, LI Jian-guo, LIANG Gong-ying, SU Jun-yi. Effect of powder feeding rate on interaction between laser beam and powder stream in laser cladding process [J]. Rare Metal Materials and Engineering, 2005, 34: 1520-1523. (in Chinese)
(Edited by YANG Bing)
Foundation item: Project(HIT(WH)200711) supported by the Study Fund of Harbin Institute of Technology at Weihai, China
Corresponding author: ZHAO Hong-yun; Tel: +86-631-5687479; E-mail: hy_zhao66@163.com
