

ARTICLE
J. Cent. South Univ. (2019) 26: 2175-2184
DOI: https://doi.org/10.1007/s11771-019-4164-x

A pre-warning system of abnormal energy consumption in lead smelting based on LSSVR-RP-CI
WANG Hong-cai(�����)1, FANG Hong-ru(������)1, MENG Lei(����)2, XU Feng-xiang(�����)3
1. School of Energy Science and Engineering, Central South University, Changsha 410083, China;
2. School of Automation, Wuhan University of Technology, Wuhan 430070, China;
3. Hubei Key Laboratory of Advanced Technology of Automotive Components, Wuhan University of Technology, Wuhan 430070, China
 Central South University Press and Springer-Verlag GmbH Germany, part of Springer Nature 2019
Abstract:
The pre-warning of abnormal energy consumption is important for energy conservation of industrial engineering. However, related studies on the lead smelting industries which usually have a huge energy consumption are rarely reported. Therefore, a pre-warning system was established in this study based on the intelligent prediction of energy consumption and the identification of abnormal energy consumption. A least square support vector regression (LSSVR) model optimized by the adaptive genetic algorithm was developed to predict the energy consumption in the process of lead smelting. A recurrence plots (RP) analysis and a confidence intervals (CI) analysis were conducted to quantitatively confirm the stationary degree of energy consumption and the normal range of energy consumption, respectively, to realize the identification of abnormal energy consumption. It is found the prediction accuracy of LSSVR model can exceed 90% based on the comparison between the actual and predicted data. The energy consumption is considered to be non-stationary if the correlation coefficient between the time series of periodicity and energy consumption is larger than that between the time series of periodicity and Lorenz. Additionally, the lower limit and upper limit of normal energy consumption are obtained.
Key words:
Cite this article as:
WANG Hong-cai, FANG Hong-ru, MENG Lei, XU Feng-xiang. A pre-warning system of abnormal energy consumption in lead smelting based on LSSVR-RP-CI [J]. Journal of Central South University, 2019, 26(8): 2175-2184.
DOI:https://dx.doi.org/https://doi.org/10.1007/s11771-019-4164-x1 Introduction
The rapid progress of industrialization is supported by the huge consumption of energy resource [1-3]. International energy agency (IEA) estimated that global energy demand would grow by more than 25% to 2040 under current and planned policies based on New Policies Scenario [4]. Energy conservation is a practical choice to handle the conflict between energy supply and energy consumption. Energy conservation has become a worldwide concern [5].
Lead smelting is one of important modern manufacturing industries. The common technologies of lead smelting mainly include Queneau Schuhmann Lurgi (QSL) [6], Kivcet [7], Isasmelt [8], Kaldo [9] and Shuikoushan (SKS) [10]. Although the technologies of lead smelting have been improved considerably, the energy consumption of unit product is still high because the industrial process of lead smelting is complex and there are different levels of energy waste each process [11], which is an important factor to restrict the development of lead smelting industry. Therefore, it needs to establish a pre-warning system of abnormal energy consumption including the prediction of energy consumption and the identification of abnormal energy consumption in the process of production, which is significant to ensure safe and efficient production and promote energy conservation of lead smelting industry.
The common prediction methods of energy consumption mainly include probability [12], statistics [13], regression [14] and artificial intelligence [15]. It has been studied extensively. For instance, MA et al [16] performed a statistical analysis of energy consumption patterns on the heat demand of buildings. A Gaussian mixture model was developed to examine the impacts of defined building types including commercial, apartment, and office on the heat consumption of district heating systems. KALOGIROU et al [17] predicted the energy consumption of a passive solar building through the method of artificial neural network. Simulated data from a dynamic thermal building model were used to train network to generate a mapping between the measurable inputs and the desired output. XU et al [18] conducted a study of electricity energy consumption forecasting using an IRGM(1,1) model which is an optimized hybrid GM(1,1) model based on particle swarm algorithm. The forecasted energy consumption has been confirmed by the actual data. Results showed the proposed model significantly promoted forecasting accuracy. SPOLADORE et al [19] successfully forecasted the hourly residential heat demand based on a district heating network using natural gas consumption and energy performance indicators. TSO et al [20] compared three prediction techniques for electricity energy consumption including regression analysis, decision tree, and neural networks. It was found that the decision tree model and the neural network model had a higher accuracy than other models. In order to reduce the number of required sensors used to identify the operation state of manufacturing system, LE et al [21] proposed a novel approach with two-stage framework in which the first stage used a Savizky-Golay filter to reduce the received signal noise and the second stage used a neural network to classify the patterns of energy consumption.
Some industrial systems have a huge energy consumption due to the serious waste of energy. The detection of abnormal energy consumption is important to improve the utilization efficiency of energy and construct a low-carbon production system. SANTAMOURIS et al [22] developed a classification model for the energy performance of school buildings based on fuzzy clustering techniques. It can be applied in the identified environmental and energy problems to assess the potential of environmental and energy improvements. YANG et al [23] proposed a detection model of abnormal energy consumption for tire curing. Artificial neural network and support vector machine algorithms were used to forecast the normal interval of energy efficiency ratio. The instances dropping out of this interval indicated potential abnormal energy consumption. ANGELOS et al [24] used a C-means-based fuzzy clustering model to classify electricity consumption profiles. In the model, Euclidean distance yielded a unitary index score, and those potential fraudsters or users with abnormal electricity consumption have the highest scores. FONTUGNE et al [25] presented a method called the Strip, Bind and Search (SBS) to identify abnormal equipment behavior. The SBS model successfully uncovered the inefficient device leading to energy waste.
As mentioned above, the pre-warning system of abnormal energy consumption has been investigated in many industrial systems. However, related studies on the process of lead smelting are rarely reported. Therefore, it is investigated in this study and the corresponding model is established based on the algorithms of least square support vector regression (LSSVR), recurrence plots (RP), and confidence interval (CI), which includes the prediction of energy consumption and the identification of abnormal energy consumption.
2 Prediction of energy consumption in lead smelting
2.1 Prediction model
Traditional regression method is simple to operate and is suitable to describe correlation characteristics between parameters. However, it has obvious defects in processing the relationship between complicated parameters and dynamic information. The method of artificial neural network is able to handle complicated nonlinear problems, but the training of network is time-consuming and local optimal value always occurs due to the phenomenon of ��over learning�� or ��under learning��, which can result in poor generalization ability.
In order to solve these problems, least squares support vector machine (LSSVM) is proposed by SUYKENS et al [26] based on the principle of structure risk minimize, which is generally categorized into least squares support vector regression (LSSVR) and least squares support vector classification (LSSVC) for the tasks of regression and classification, respectively [27].
The problem of regression is transformed into an optimization problem in the LSSVR:

 (1)
(1)
where w denotes a weight vector; ei is the error between calculated and actual values; g is the penalty factor and used to control the minimization of estimation error and the function smoothness; b is the bias term which is an unknown and needs to be estimated; ��(xi)is a predefined nonlinear kernel function transforming the input space to a new feature space with high (or even infinite) dimensionality. A Lagrange function is defined as Eq.(2) to solve the optimization problems.

 (2)
(2)
where ai is the Lagrangian multiplier. The KKT conditions are used for optimization through differentiating L in Eq. (2). The KKT conditions are used for optimality by differentiating L in Eq. (3) with the variable w, b, e and ��.
 (3)
(3)
After eliminating w and ei, the final solution can be expressed as:
 (4)
(4)
where K(��,��) is the kernel function. The most used kernel functions include fisher kernel, polynomial kernel, radial basis function (RBF) kernel, etc. In this study, RBF kernel K(xi, x)=exp(-||x-xi||2/s2) is selected, where xi and s2 are the center and width of kernel function, respectively.
The penalty factor g and kernel function width s2 are the key parameters affecting the prediction accuracy of LSSVR. The traditional definition of g and s2 depends on the repeated operation or expert experience, which often results in the increase of calculation burden and the reduction of prediction accuracy. Therefore, adaptive genetic algorithm (AGA) is used to optimize the selection of g and s2 [28-30] in this study. In the AGA, the fitness function is set as:
 (5)
(5)
where yi and f(xi) are the expected and actual outputs, respectively; e is a very small real number and is set as 10-3 to prevent the denominator of zero.
The crossover probability pc and mutation probability pm are the key parameters affecting the performance of genetic algorithm. The pc and pm in AGA can automatically change with fitness function.
 (6)
(6)
 (7)
(7)
where pc1 and pc2 are the maximum and minimum of crossover probability; pm1 and pm2 are the maximum and minimum of the mutation probability; fmax and favg are the maximum and average fitness of the set of solutions, respectively; f�� is the larger fitness value of the two individuals selected for crossover and f is the larger fitness of the solutions to be mutated. Therefore, the implementation process of the prediction model of LSSVR optimized by AGA (LSSVR-AGA) is shown in Figure 1.
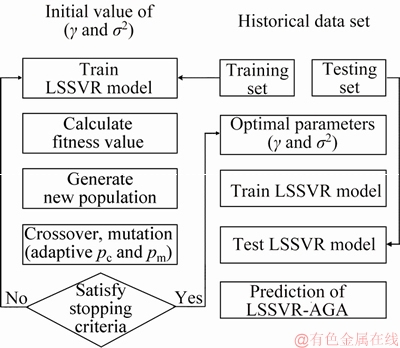
Figure 1 Flowchart of implementation process of LSSVR-AGA model
2.2 Prediction of energy consumption in lead smelting
The daily operation data of a lead smelting enterprise are taken as samples, in which the energy consumption data in the production of crude lead in 300 d are selected as the learning samples of LSSVR and the other data in 20 d are selected as the test samples of LSSVR. When using AGA to optimize the penalty factor g and kernel function width s2 of LSSVR model, the population size is set as 50 and the chromosome length is set as 20 in which both of encoding length of g and s2 are 10, the range of g is set as (0.1, 100), the range of s2 is set as (0.01, 20), and the maximum iteration step is set as 100.
The evolution curve of fitness shown in Figure 2 can be obtained at searching for the optimal penalty factor g and kernel function width s2. After training LSSVR through the learning samples, the energy consumptions in bottom- blowing furnace and blast furnace are predicted based on SVR, LSSVR and LSSVR-AGA, respectively, as shown in Figures 3 and 4. It can be seen that the actual energy consumption of unit crude lead in bottom-blowing furnace is 2.06��103- 2.58��103 kJ/kg. The corresponding energy consumptions predicted by SVR, LSSVR and LSSVR-AGA are 2.02��103-2.60��103, 2.05��103- 2.63��103 and 2.05��103-2.62��103 kJ/kg, respectively. The actual energy consumption of unit crude lead in blast furnace is 11.52��103-12.03��103 kJ/kg. The corresponding energy consumptions predicted by SVR, LSSVR and LSSVR-AGA are 11.43��103-12.30��103, 11.42��103-12.18��103 and 11.48��103-12.16��103 kJ/kg, respectively. The average prediction deviation of SVR, LSSVR and LSSVR-AGA are 1.81%, 2.03% and 1.32%, respectively.
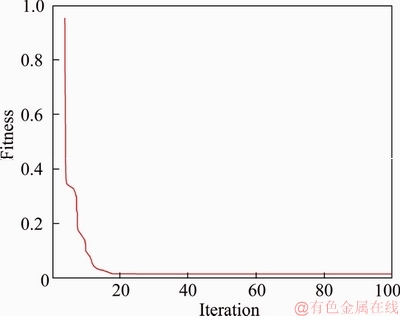
Figure 2 Fitness evolution curve in optimization process of LSSVR model by AGA

Figure 3 Actual and predicted energy consumptions in bottom-blowing furnace

Figure 4 Actual and predicted energy consumptions in blast furnace
3 Identification of abnormal energy consumption in lead smelting
3.1 Identification of non-stationary energy consumption by recurrence plots
When some states of a chaos dynamic system have a certain similarity in a specific time period, such similarity is called the recursion of the system [31]. ECKMANN et al [32] initially used recurrence plots (RP) to qualitatively analyze the Lorenz system, and pointed out that the RP is a simple, intuitive and effective method for nonlinear dynamic system analysis. The RP has been widely applied in many fields such as fault diagnosis, anomaly detection and vibration evaluation [33-35].
The RP is briefly defined as
 or
or
 (8)
(8)
where ��(x) is the Heaviside function (i.e., ��(x) = 0, if x<0, and ��(x)=1, otherwise); �� is a predefined threshold;  and
and  are phase space trajectories in a m-dimension phase space. These trajectories can be reconstructed from single time series ui by using a time delay t
  . The base of RP is the distance matrix.
 (9)
(9)
Several quantification parameters in the RP can be applied, and the most common are recurrence rate (RR), determinism (DET), entropy (ENTR), laminarity (LAM), trapping time (TT) and the maximum length of diagonal structures (Lmax), as shown in Eqs. (10)-(15).
 (10)
(10)
 (11)
(11)
 with
with
 (12)
(12)
 (13)
(13)
 (14)
(14)
 (15)
(15)
where P��(l)={li; i=1, ��, Nl} is the frequency distribution of the length l of diagonal structures and Nl is the absolute number of diagonal lines;  denotes the frequency distribution of the length l of vertical structures.
The method of principal component analysis is used to analyze a characteristic matrix composed of three quantificational indicators (LAM, TT and Lmax) able to reflect the stationary degree of data in the RP. The large correlation coefficient between the time series of energy consumption in lead smelting and the principal components of index matrix indicates that their stationary degree is close. The non-stationarity identification of energy consumption in lead smelting can be achieved by the following steps:
Step 1: Dividing data into m sections, i.e. [X(1), ��, X(m)];
Step 2: Calculating LAM, TT and Lmax;
Step 3: Constructing the characteristic index matrix Z:
 (16)
(16)
Step 4: Performing singular value decomposition for the covariance of Z:
 (17)
(17)
 (18)
(18)
 (19)
(19)
where U is the orthogonal matrix and  is the singular value matrix. The first principal component (PC) is selected as the evaluation object.
 (20)
(20)
Step 5: Calculating the correlation coefficient between the principal components.
 (21)
(21)
where Cov is the covariance of X and Y, and Var[X] and Var[Y] are the variances.
The correlation coefficient r with the range from 0 to 1 reflects the correlation degree between the principal components. If r=0, it means that the time series are dissimilar and have a completely different stationary degree. If r=1, it means the time series are similar and have that the same stationary degree.
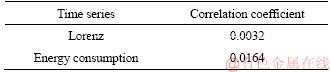
In order to use the above algorithm to evaluate the stationarity degree of time series, the correlation coefficient r between Lorenz time series (non-stationary time series) and periodicity time series (stationary time series) was taken as the threshold of non-stationary energy consumption in lead smelting. The time series of periodicity, Lorenz and energy consumption are respectively divided into 8 sections. Figure 5 shows the recurrence diagram of the time series of periodicity, Lorenz and energy consumption, and then RP characteristic parameters of each time series are calculated based on Eqs. (10)-(15) as shown in Table 1. Finally, the correlation coefficients between the time series can be obtained according to Eq.(21), as shown in Table 2.
It can be seen from Table 2 that the correlation coefficient between the time series of periodicity and Lorenz is 0.0032, which is very small value and is consistent with the fact that Lorenz time series are non-stationary. The correlation coefficient of the time series between periodicity and energy consumption is 0.0164, which means incomplete stationary. Therefore, if the correlation coefficient between the time series of periodicity and energy consumption is larger than 0.0032, the energy consumption in lead smelting is considered to be non-stationary.
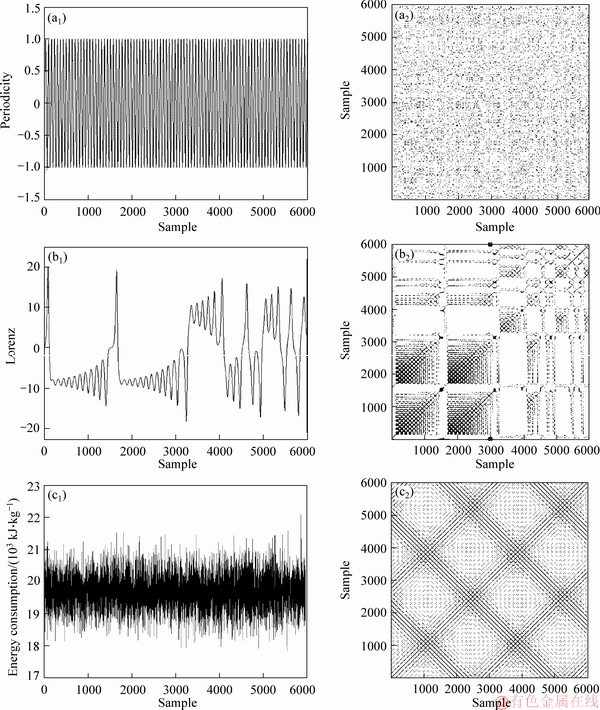
Figure 5 RP of time series of periodicity (a), Lorenz (b) and energy consumption (c)
Table 1 RP characteristic parameters of time series of periodicity, Lorenz and energy consumption
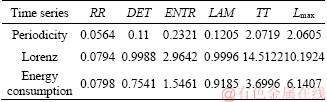
Table 2 Evaluation of stationarity degree
3.2 Identification of normal energy consumption range by confidence interval
The confidence interval(CI) is a type of interval estimate and is computed from the statistics of the observed data, which might contain the true value of an unknown population parameter [36, 37]. The confidence level represents the frequency (i.e. the proportion) of possible confidence intervals that contain the true value of the unknown population parameter. In other words, if confidence intervals are constructed using a given confidence level from an infinite number of independent sample statistics, the proportion of those intervals contains the true value of the parameter that will be equal to the confidence level.
Suppose that the research subject (X1, ��, Xn) is an independent sample from a normally distributed population with known mean �� and variance ��2. Let
 (22)
(22)
 (23)
(23)
where  is the sample mean and S2 is the sample variance. For a given confidence level 1-��,
 (24)
(24)
The confidence interval for sample mean is going to be
 (25)
(25)
The energy consumption in the production process of unit crude lead in 40 months was taken as the sample, as shown in Table 3. Supposing  and
and the sample mean of 9.36 and the sample variance of 0.706 can be obtained based on Eqs. (22) and (23), repectively. The hypothesis testing is
 (9.36, 0.706). From Table 3, it is found the range of energy consumption in the production process of crude lead is (7.82, 11.21), which is divided into 8 short sections with 0.45��103 kJ/kg intervals, as shown in Table 4. The histogram of frequency distribution and cumulative frequency curve of energy consumption can be obtained as shown in Figure 6.
Then,
 (26)
(26)
The confidence level is designated prior to the examining of data. Most commonly, the 0.95 confidence level and 0.05 significance level is used. Due to the freedom degree of 3, the critical value is 9.348 according to the  distribution table. H0 is accepted since
  , that is the energy consumption in the production process of crude lead following the normal distribution of xi~N (9.36, 0.706).
Table 3 Energy consumption in production process of crude lead
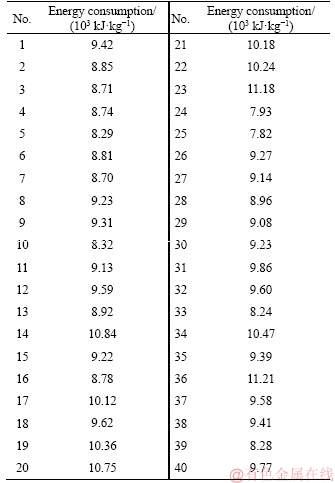
Table 4 Range and frequency of energy consumption in production process of crude lead

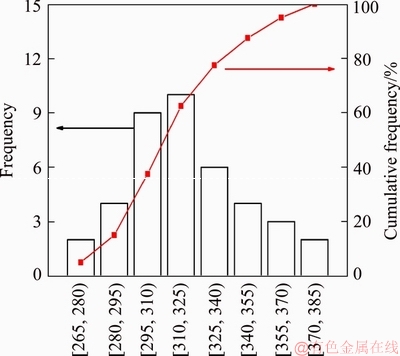
Figure 6 Frequency histogram and cumulative frequency distributing graph of energy consumption in production process of crude lead
Based on the statistical theory, it can be concluded the general change of energy consumption follows a normal distribution over a period of time under the condition of stable production environment, and its mean value changes within a certain confidence interval. At the condition of significance level, mean energy consumption in the production process of crude lead at 95% confidence level is 
As mentioned above, according to the data in Table 3, the critical value of energy consumption in the production process of crude lead is calculated.
Substituting the t1-��/2(n-1)=t1-0.025(39)=2.03 obtained from t-distribution into confidence interval, the confidence interval of mean energy consumption in the production process of crude lead with 95% confidence level equals (9.09, 9.63), which indicates that the lower and upper limit values of normal energy consumption in the production process of crude lead are 9.09��103 kJ/kg and 9.63��103 kJ/kg, respectively.
4 Conclusions
1) A prediction model of energy consumption in lead smelting is established based on LSSVR-AGA, which has a prediction accuracy exceeding 90%.
2) The identification of abnormal energy consumption in lead smelting is investigated in this study through the identification of non-stationary energy consumption and the identification of normal energy consumption range.
3) The identification of non-stationary energy consumption is carried out based on RP theory. If the correlation coefficient between the time series of periodicity and energy consumption is larger than that between the time series of periodicity and Lorenz, the energy consumption in lead smelting is considered to be non-stationary.
4) The lower limit and upper limit of normal energy consumption of lead smelting are obtained based on CI theory between 9.09��103 kJ/kg and 9.63��103 kJ/kg.
Conflict of interests
The authors declare that they have no conflict of interests regarding the publication of this paper.
References
[1] LIU Gang, LI Meng-si, ZHOU Bing-jie, CHEN Ying-ying, LIAO Sheng-ming. General indicator for techno-economic assessment of renewable energy resources [J]. Energy Conversion and Management, 2018, 156: 416-426. DOI: 10.1016/j.enconman.2017.11.054.
[2] LI Yu-qiang, TANG Wei, CHEN Yong, LIU Jiang-wei, LEE Chia-fon F. Potential of acetone-butanol-ethanol (ABE) as a biofuel [J]. Fuel, 2019, 242: 673-686. DOI: 10.1016/ j.fuel.2019.01.063.
[3] CHEN Jing-wei, XU Wen-wen, ZUO Hong-yan, WU Xiao-min, E Jia-qiang, WANG Tao-sheng, ZHANG Feng, LU Na. System development and environmental performance analysis of a solar-driven supercritical water gasification pilot plant for hydrogen production using life cycle assessment approach [J]. Energy Conversion and Management, 2019, 184: 60-73. DOI: 10.1016/j.enconman. 2019.01.041.
[4] International Energy Agency. World Energy Outlook 2018 [EB/OL]. https://www.iea.org/weo2018/.
[5] MA Wei-wu, XUE Xin-pei, LIU Gang. Techno-economic evaluation for hybrid renewable energy system: Application and merits [J]. Energy, 2018, 159: 385-409. DOI: 10.1016/j.energy.2018.06.101.
[6] COURSOL P, MACKEY P J, KAPUSTA J P T, VALENCIA N C. Energy consumption in copper smelting: A new asian horse in the race [J]. JOM, 2015, 67: 1066-1074. DOI: 10.1007/s11837-015-1380-1.
[7] SLOVIKOVSKII V V, GULYAEVA A V. Effective linings for kivcet furnaces [J]. Refractories and Industrial Ceramics, 2014, 54: 350-352. DOI: 10.1007/s11148-014-9609-z.
[8] NIKOLIC S, HOGG B, VOIGT P. ISASMELTTM-flexibility in furnace design [M]. Cham: Springer International Publishing, 2018. DOI: 10.1007/978-3-319-95022-8_35.
[9] PEREZ-TELLO M, SANCHEZ-CORRALES V M, PRIETO-SANCHEZ M R, RODR GUEZ-HOYOS O. A kinetic model for the oxidation of selenium and tellurium in an industrial kaldo furnace [J]. JOM, 2004, 56: 52-54. DOI: 10.1007/s11837-004-0236-x.
[10] BAI Lu, QIAO Qi, LI Yan-ping, XIE Ming-hui, WAN Si, ZHONG Qing-dao. Substance flow analysis of production process: A case study of a lead smelting process [J]. Journal of Cleaner Production, 2015, 104: 502-512. DOI: 10.1016/j.jclepro.2015.05.020.
[11] RABAH M A, BARAKAT M A. Energy saving and pollution control for short rotary furnace in secondary lead smelters [J]. Renewable Energy, 2001, 23: 561-577. DOI: 10.1016/ S0960-1481(00)00134-8.
[12] JIANG Bo, RAVINDRAN B, CHO H. Probability-based prediction and sleep scheduling for energy-efficient target tracking in sensor networks [J]. IEEE Transactions on Mobile Computing, 2013, 12: 735-747. DOI: 10.1109/TMC. 2012.44.
[13] SEEM J E. Pattern recognition algorithm for determining days of the week with similar energy consumption profiles [J]. Energy and Buildings, 2005, 37: 127-139. DOI: 10.1016/j.enbuild.2004.04.004.
[14] FUMO N, RAFE BISWAS M A. Regression analysis for prediction of residential energy consumption [J]. Renewable and Sustainable Energy Reviews, 2015, 47: 332-343. DOI: 10.1016/j.rser.2015.03.035.
[15] EKONOMOU L. Greek long-term energy consumption prediction using artificial neural networks [J]. Energy, 2010, 35: 512-517. DOI: 10.1016/j.energy.2009.10.018.
[16] MA Zhan-yu, LI Hai-long, SUN Qie, WANG Chao, YAN Ai-bing, STARFELT F. Statistical analysis of energy consumption patterns on the heat demand of buildings in district heating systems [J]. Energy and Buildings, 2014, 85: 464-472. DOI: 10.1016/j.enbuild.2014.09.048.
[17] KALOGIROU S A, BOJIC M. Artificial neural networks for the prediction of the energy consumption of a passive solar building [J]. Energy, 2000, 25: 479-491. DOI: 10.1016/S0360-5442(99)00086-9.
[18] XU Ning, DANG Yao-guo, GONG Yan-de. Novel grey prediction model with nonlinear optimized time response method for forecasting of electricity consumption in China [J]. Energy, 2017, 118: 473-480. DOI: 10.1016/j.energy. 2016.10.003.
[19] SPOLADORE A, BORELLI D, DEVIA F, MORA F, SCHENONE C. Model for forecasting residential heat demand based on natural gas consumption and energy performance indicators [J]. Applied Energy, 2016, 182: 488-499. DOI: 10.1016/j.apenergy.2016.08.122.
[20] TSO G K F, YAU K K W. Predicting electricity energy consumption: A comparison of regression analysis, decision tree and neural networks [J]. Energy, 2007, 32: 1761-1768. DOI: 10.1016/j.energy.2006.11.010.
[21] LE C V, PANG C K, GAN O P, CHEE X M, ZHANG D H, LUO M, CHAN H L, LEWIS F L. Classification of energy consumption patterns for energy audit and machine scheduling in industrial manufacturing systems [J]. Transactions of the Institute of Measurement and Control, 2013, 35: 583-592. DOI: 10.1177/0142331212460883.
[22] SANTAMOURIS M, MIHALAKAKOU G, PATARGIAS P, GAITANI N, SFAKIANAKI K, PAPAGLASTRA M, PAVLOU C, DOUKAS P, PRIMIKIRI E, GEROS V, ASSIMAKOPOULOS M N, MITOULA R, ZEREFOS S. Using intelligent clustering techniques to classify the energy performance of school buildings [J]. Energy and Buildings, 2007, 39: 45-51. DOI: 10.1016/j.enbuild.2006.04.018.
[23] YANG Hai-dong, GUO Jian-hua, LIU Guo-sheng. Energy anomaly detection in tire curing by using data integration and forecasting techniques [EB/OL]. [2019-05-14]. http://nopr.niscair.res.in/handle/123456789/14155.
[24] ANGELOS E W S, SAAVEDRA O R, CORTES O A C, SOUZA A N d. Detection and identification of abnormalities in customer consumptions in power distribution systems [J]. IEEE Transactions on Power Delivery, 2011, 26: 2436-2442. DOI: 10.1109/TPWRD.2011.2161621.
[25] FONTUGNE R, ORTIZ J, TREMBLAY N, BORGNAT P, FLANDRIN P, FUKUDA K, CULLER D, ESAKI H. Strip, bind, and search: A method for identifying abnormal energy consumption in buildings [C]// 2013 ACM/IEEE International Conference on Information Processing in Sensor Networks (IPSN). 2013: 129-140. DOI: 10.1145/ 2461381.2461399.
[26] SUYKENS J A K, VANDEWALLE J. Least squares support vector machine classifiers [J]. Neural Processing Letters, 1999, 9: 293-300. DOI: 10.1023/A:1018628609742.
[27] YANG Xiao-wei, TAN Liang-jun, HE Li-fan. A robust least squares support vector machine for regression and classification with noise [J]. Neurocomputing, 2014, 140: 41-52. DOI: 10.1016/j.neucom.2014.03.037.
[28] CHEN Rong, LIANG Chang-yong, HONG Wei-chiang, GU Dong-xiao. Forecasting holiday daily tourist flow based on seasonal support vector regression with adaptive genetic algorithm [J]. Applied Soft Computing, 2015, 26: 435-443. DOI: 10.1016/j.asoc.2014.10.022.
[29] YANG Z, GU X S, LIANG X Y, LING L C. Genetic algorithm-least squares support vector regression based predicting and optimizing model on carbon fiber composite integrated conductivity [J]. Materials & Design, 2010, 31: 1042-1049. DOI: 10.1016/j.matdes.2009.09.057.
[30] YU Le-an, DAI Wei, TANG Ling, WU Jia-qian. A hybrid grid-GA-based LSSVR learning paradigm for crude oil price forecasting [J]. Neural Computing and Applications, 2016, 27: 2193-2215. DOI: 10.1007/s00521-015-1999-4.
[31] VALAVANIS D, SPANOUDAKI D, GKILI C, SAZOU D. Using recurrence plots for the analysis of the nonlinear dynamical response of iron passivation-corrosion processes [J]. Chaos: An Interdisciplinary Journal of Nonlinear Science, 2018, 28: 085708. DOI: 10.1063/1.5025801.
[32] ECKMANN J, KAMPHORST S O, RUELLE D. Recurrence plots of dynamical systems [J]. World Scientific Series on Nonlinear Science Series A, 1995, 16: 441-446.
[33] MARWAN N, CARMEN ROMANO M, THIEL M, KURTHS J. Recurrence plots for the analysis of complex systems [J]. Physics Reports, 2007, 438: 237-329. DOI: 10.1016/j.physrep.2006.11.001.
[34] MARWAN N, WESSEL N, MEYERFELDT U, SCHIRDEWAN A, KURTHS J. Recurrence-plot-based measures of complexity and their application to heart-rate-variability data [J]. Physical Review E, 2002, 66: 026702. DOI: 10.1103/PhysRevE.66.026702.
[35] ADDO P M, BILLIO M, GUEGAN D. Nonlinear dynamics and recurrence plots for detecting financial crisis [J]. The North American Journal of Economics and Finance, 2013, 26: 416-435. DOI: 10.1016/j.najef.2013.02.014.
[36] LAN H, NELSON B L, STAUM J. A confidence interval procedure for expected shortfall risk measurement via two-level simulation [J]. Operations Research, 2010, 58: 1481-1490. DOI: 10.1287/opre.1090.0792.
[37] LEE S, BOLIC M, GROZA V Z, DAJANI H R, RAJAN S. Confidence interval estimation for oscillometric blood pressure measurements using bootstrap approaches [J]. IEEE Transactions on Instrumentation and Measurement, 2011, 60: 3405-1415. DOI: 10.1109/TIM.2011.2161926.
(Edited by YANG Hua)
���ĵ���
����LSSVR-RP-CI��Ǧұ���쳣�ܺ�Ԥ��ϵͳ
ժҪ���쳣�ܺ�Ԥ���ǹ�ҵ���̽��ܵ���Ҫ���ݡ�Ȼ��������ͨ���ܺľ��Ǧұ����ҵ������о�ȴ���б�������ˣ����о������˻��������ܺ�Ԥ����쳣�ܺ�ʶ���Ԥ��ϵͳ����������Ӧ�Ŵ��㷨�Ż���С����֧�������ع�(LSSVR)ģ�ͣ���Ǧұ�����̵��ܺĽ���Ԥ�⡣�ֱ�ͨ���ݹ�ͼ(RP)��������������(CI)����������ȷ���ܺĵ�ƽ�ȳ̶Ⱥ�������Χ��ʵ���쳣�ܺĵ�ʶ��ͨ���Ƚ�ʵ��������Ԥ�����ݣ�����LSSVRģ�͵�Ԥ�⾫�ȿɴ�90%���ϡ��������ʱ���������ܺĵ����ϵ����������ʱ��������������ʱ�����е����ϵ��������Ϊ�ܺ��Ƿ�ƽ�ȵġ����⣬�õ��������ܺĵ��������ޡ�
�ؼ��ʣ�Ǧұ�����ܺģ���С����֧�������ع飻�ݹ�ͼ����������
Foundation item: Project(2015SK1002) supported by Key Projects of Hunan Province Science and Technology Plan, China
Received date: 2019-05-27; Accepted date: 2019-07-06
Corresponding author: MENG Lei, PhD; E-mail: menglei1986@gmail.com; ORCID: 0000-0002-2356-8905; XU Feng-xiang, PhD, Associate Professor; E-mail: xufx@whut.edu.cn
Abstract: The pre-warning of abnormal energy consumption is important for energy conservation of industrial engineering. However, related studies on the lead smelting industries which usually have a huge energy consumption are rarely reported. Therefore, a pre-warning system was established in this study based on the intelligent prediction of energy consumption and the identification of abnormal energy consumption. A least square support vector regression (LSSVR) model optimized by the adaptive genetic algorithm was developed to predict the energy consumption in the process of lead smelting. A recurrence plots (RP) analysis and a confidence intervals (CI) analysis were conducted to quantitatively confirm the stationary degree of energy consumption and the normal range of energy consumption, respectively, to realize the identification of abnormal energy consumption. It is found the prediction accuracy of LSSVR model can exceed 90% based on the comparison between the actual and predicted data. The energy consumption is considered to be non-stationary if the correlation coefficient between the time series of periodicity and energy consumption is larger than that between the time series of periodicity and Lorenz. Additionally, the lower limit and upper limit of normal energy consumption are obtained.
