

J. Cent. South Univ. (2019) 26: 3017-3033
DOI: https://doi.org/10.1007/s11771-019-4233-1

FLBS: Fuzzy lion Bayes system for intrusion detection in wireless communication network
NARENDRASINH B Gohil1, VDEVYAS Dwivedi2
1. Shantilal Shah Engineering College, Bhavnagar, Gujarat, India;
2. C.U.Shah University, Wadhwan City, Gujarat, India
 Central South University Press and Springer-Verlag GmbH Germany, part of Springer Nature 2019
Abstract:
An important problem in wireless communication networks (WCNs) is that they have a minimum number of resources, which leads to high-security threats. An approach to find and detect the attacks is the intrusion detection system (IDS). In this paper, the fuzzy lion Bayes system (FLBS) is proposed for intrusion detection mechanism. Initially, the data set is grouped into a number of clusters by the fuzzy clustering algorithm. Here, the Naive Bayes classifier is integrated with the lion optimization algorithm and the new lion naive Bayes (LNB) is created for optimally generating the probability measures. Then, the LNB model is applied to each data group, and the aggregated data is generated. After generating the aggregated data, the LNB model is applied to the aggregated data, and the abnormal nodes are identified based on the posterior probability function. The performance of the proposed FLBS system is evaluated using the KDD Cup 99 data and the comparative analysis is performed by the existing methods for the evaluation metrics accuracy and false acceptance rate (FAR). From the experimental results, it can be shown that the proposed system has the maximum performance, which shows the effectiveness of the proposed system in the intrusion detection.
Key words:
Cite this article as:
NARENDRASINH B Gohil, VDEVYAS Dwivedi. FLBS: Fuzzy lion Bayes system for intrusion detection in wireless communication network [J]. Journal of Central South University, 2019, 26(11): 3017-3033.
DOI:https://dx.doi.org/https://doi.org/10.1007/s11771-019-4233-11 Introduction
Due to the technological development, a number of sensors are developed and they are grouped to make a WCN, and the cost of these sensors is very low. The sensors are used to collect the information from the various fields, and they are in contact with the destination nodes from which the users can access their needs [1]. Now a day, WCNs are the popular networks, and they are easily adaptable and reconfigurable. While designing the sensor networks, it should be notable that the networks consume less power for maximizing the lifetime of the networks. Meanwhile they provide the better sensing ability [2]. WCNs [3] are used in several applications, such as smart city, smart homes. The WCNs are dynamic in nature, and they have uncertain environments, so there is a chance of high risks [4]. The security mechanisms including user authentication, cryptographic techniques [5], and firewalls are inadequate to prevent the networks from the intrusion techniques [6].
One of the major limitations of the WCNs is that they have a minimum amount of resources, such as processor and power unit, which leads to high-security threats. The challenges in WCNs may have the abilities to obtain the secret information like the secret keys by performing eavesdropping and the denial-of-services (DoS) attacks [7]. Node capture is also the major issue in WCNs. In contrast to conventional networks, the WCNs have abandoned operations and revealed nature. Hence the attackers can easily capture the sensor nodes in WCNs. The node capture attack interrupts most of the security services, such as key management, access control, secure routing. Therefore, the actions must be taken for providing the secure communication in the WCNs [8]. DoS attacks are the attacks that decrease the ability of the networks to do its normal operations, and they are very difficult to manage. There are several reasons to DoS attacks, namely, hardware failures, exhaustion of resources, errors in software. The DoS attacks on Internet are totally different from those of the DoS attacks in WCNs. Every layer of WCNs is affected by the various DoS attacks, and the characteristics and nature of each attack are distinct from the other. There is no mechanism to find and eliminate all types of DoS attacks [9].
Therefore, the alternative approach for detecting and preventing the attacks is the IDS [10, 11]. The IDS [12, 13] is defined as the mechanism for securing the network from the unauthorized access, and it plays the significant role for providing the secure networks [6]. There are two types of IDSs. The first one is the anomaly-based intrusion detection. The other name of anomaly- based detection is the outlier detection, and it depends on the modeling of the statistical behaviors [14]. This method detects intruders immediately when they are entering into the boundary region of the surveillance areas while maintaining the entire sensing power. The limitation of this method is that it requires a high cost. The second type of intrusion detection mechanism allows the intruders into the certain range of the surveillance areas and then detects the intruders. This method requires a low cost. If the intruder can be identified immediately, then the detection capacity of the WCNs is high [15]. The capacity of the IDS is determined by how quickly it detects an intruder in the WCNs. The IDSs are situated within the sensors, and they detect the intruders quickly when they are entering into the field of Interest (FoI) [16]. Optimization algorithms [17, 18] are used in IDS.
This paper proposes the fuzzy lion Bayes system (FLBS) for intrusion detection in WCNs. Here, the naive Bayes classifier is integrated with the lion optimization algorithm for generating the optimal probabilistic measures. Initially, the data samples are grouped into clusters by the fuzzy clustering algorithm. Then, the model for each data group is created by calculating the mean and variance of the attributes of data. Then, the lion naive Bayes (LNB) model is applied to each cluster, and the aggregated data are generated. After generating the aggregated data, the LNB model is applied to the aggregated data, and the abnormal nodes are identified based on the posterior probability function.
The major contributions of this paper are:
FLBS: The FLBS is proposed for intrusion detection in WCN, which uses the fuzzy clustering and LNB classifier.
LNB classifier: The LNB classifier is proposed by integrating the lion optimization algorithm with the naive Bayes classifier for optimally generating the probability measures.
Fitness function: In LNB classifier, the new fitness function is generated by calculating the posterior probability of the data attributes of both positive training data and the negative training data on the normal class and the abnormal class.
The rest of this paper is organized as follows: Section 2 presents the motivation of the proposed IDS; Section 3 presents the system model of the WCN. Section 4 describes the proposed FLBS for intrusion detection in WCNs. Results and discussions are presented in Section 5, and Section 6 concludes the paper.
2 Motivation
A number of mechanisms have been developed for intrusion detection in WCN over the past decades. They detect only specific kinds of attacks, and they have several limitations. In this section, the various existing research works in intrusion detection is discussed, and the advantages and disadvantages of those methods are described. The challenges of the IDSs are also described here.
2.1 Review of related works
Here, we present the existing research works of IDS. MA et al [6] have proposed an IDS based on the spectral clustering and deep neural network (SCDNN). This method was used to detect an intruder in networks with large size and parallel computing.The limitation of this method is that it detects the parameters by using the observations and did not use the mathematical theory. DEVI et al [19] have presented the IDS which uses the adaptive neuro-fuzzy inference system for detecting the intruders in the wireless networks. The advantage of this method is that it ensures the device to device communication. This method was designed for detecting only the denial-of-service attacks. In Ref. [10], AMBUSAIDI et al have proposed the IDS based on least square support vector machine (LSSVM-IDS). This method was used to remove the unrelated and redundant characteristics of the original data, so the range of search area was decreased. This method did not provide the optimal results. CHEN et al [20] have suggested the IDS called as multi-step attack pattern recognition method (WMAPRM). This method had the ability to find the multi-step attacks. Here, the threshold setting and the weight calculations were performed through manually.
CHITRAKAR et al [21] have proposed the IDS based on candidate support vector based incremental SVM (CSV-ISVM) algorithm. This method uses the learning process to find the samples of original data and current data. CSV-ISVM algorithm was suitable only for the binary classification. In Ref. [22], RAMAKRISHNAN et al have proposed the IDS based on the layered fuzzy control language (LFCL). This method had a number of advantages, such as the minimum false positive rate, better recall value, and the minimum computational time. The disadvantage of this method is that it needs a large amount of training. VASUDEVAN et al [23] have suggested the local outlier factor and stronger class classifier based hierarchical model for detecting the intruders in the networks. This method had the maximum rate of detection and minimum false alarms. The limitation of this method is that it was more complex for detecting intruders. CHENG [14] proposed the differential game model for detecting intruders in the WCNs. This method was used to detect the optimal strategies and minimize the number of intruders. This method was complex. GUO et al [4] have proposed the multi-protocol oriented middleware-level intrusion detection (MP-MID) system for detecting the threats occurring in the WCNs. This method had the ability to detect all types of malicious attacks, and it was adaptable. In this method, the correctness of the detection process was decreased when the number of attackers was increased.
2.2 Challenges
The process of detecting the intruders in the WCNs is the challenging task because the networks have the dynamic nature. The IDS is needed to process a large amount of data from the networks, and it needs high power. Therefore, it was very arduous to attain the correct detection rate at high speed [6].
Although, the WCNs have the advantage of greater coverage region, security, and higher data rate, they provide a great dare to IDSs because of the traffic of network data. Due to the large amount of data presented in the network, it was very difficult to the IDSs to provide the correct detection rate, and they have high computational complexity [10].
The processing of large data set requires very large memory and the time needed for training such data set is also very long. To get the entire information about the network, deep learning is needed [21].
The attacks in both network data sets and normal datasets are same, which gives confusion to the classifiers to classify these attacks [6].
The number of features of the networks will increase the time needed for performing computation and decrease the performance of the networks. Thus, there is a need for subset features [22].
In Ref. [6], the clustering was performed by the spectral clustering based on the affinity matrix. When the data set was very large, the affinity matrix computation requires more time.Here, the data samples were categorized by the deep neural networks which require a great knowledge for describing the architecture.
3 System model
Figure 1 shows the system model of the WCN. The WCN consists of a number of sensor nodes, and each sensor node communicates with other nodes by transmitting the data. A router connects the nodes in the WCN. The WCN has a base station which acts as the destination node and each node in the WCN sends the data to the base station. In this paper, the proposed FLBS is connected with the base station, and it monitors the WCN. The data attributes, such as length (number of seconds) of the connection, type of the protocol (TCP, UDP), network service on the destination (http, telnet), and number of data Bytes from source to destination, number of data Bytes from destination to source, normal or error status of the connection (1 if connection is from/to the same host/port; 0 otherwise), the number of wrong fragments, number of urgent packets, number of root accesses, number of file creation operations, number of operations on access control files are collected from every sensor node by the data collector which is connected with base station. Then, proposed FLBS system connected with the base station will classify the nodes into the normal or attack.
4 Proposed FLBS for detecting intruders in WCN
This section presents the proposed FLBS for intrusion detection in WCNs. Figure 2 illustrates the block diagram of the proposed FLBS for intrusion detection in WCNs. At first, the data are grouped into a number of clusters by using the fuzzy clustering [24] method. In fuzzy clustering, the clusters are randomly selected, and the data are assigned to the clusters randomly. Then, the centroid of each cluster is calculated. After finding the centroid, the distance between the centroid and each data is calculated. If the data are closer to the centroid, then it remains in the same cluster; otherwise, it is removed from that cluster and assigned to the other cluster. In this way, the data are assigned to the clusters. The proposed method modifies the naive Bayes classifier by integrating the lion optimization algorithm [25] and creates the new model called LNB model. Here, the mean and variance of every attribute of the data are calculated, and the model is created. Then, the LNB model is applied to each cluster and the aggregated data are generated.After generating the aggregated data, the LNB model is applied to the aggregated data. At last, the proposed FLBS identifies the normal and abnormal nodes of the WCN.
Let assume that the data set D consists of n number of data, and each data has m number of attributes. The data set D can be represented as follows,
 (1)
(1)
where di represents the ith data in the data set D. Each datum in the data set has the number of attributes, m. The attribute represents the property of the data. The attribute of the data di can be represented as follows:

Figure 1 System model of wireless communication network

Figure 2 Block diagram of proposed FLBS
 (2)
(2)
where represents the jth attribute of ith data.
4.1 Fuzzy clustering
Fuzzy clustering [24, 26] is defined as the process of making groups by assigning the data points to the clusters. Each data point belongs to more than one cluster. The advantage of using fuzzy clustering is that it specifies the uncertainty of the node assignment to the cluster and it is flexible. It provides the best results for overlapped data sets. At first, select the number of clusters and assign the data points to the clusters randomly. Then, the centroid of each cluster is determined, and the distance between the centroid and the data points is calculated. In any cluster, the distance between the data point and the centroid is very large, then the particular data point is removed from that cluster and assigned to another cluster in which the distance between the data point and the centroid is the minimum. Let assume that a random centroid,  and calculate the distance between the data and the centroid by Eq.(3).
 (3)
(3)
where Dif is the distance between the ith datum and centroid of the fth cluster; L is the distance function; di is the ith datum; Cf is the centroid of the fth cluster. The distance between the data and the cluster centroid represents the degree of belongingness of the data to the cluster. If the di is closer to the cluster centroid Cf; then the di is assigned to the fth cluster. The degree of belongingness can be calculated by Eq.(4).
 (4)
(4)
where vif is the degree of belongingness of the ith datum and the fth cluster. The following equation can calculate the centroid of the clusters,
 (5)
(5)
where Cf is the centroid of the fth cluster; vif is the degree of belongingness of the ith datum and the fth cluster, and di is the ith datum.
4.2 LNB: A new naive Bayes classifier
Here, the modified naive Bayes classifier is presented. Naive Bayes classifier [27] is defined as the probabilistic classifier based on Bayes theorem and the naive independent assumptions among the features. Here, the lion optimization algorithm is integrated with the naive Bayes classifier for generating the optimal probabilistic measures as shown in Figure 3. The naive Bayes classifier finds the mean and variance of each sample and finds posterior function. Finally, it returns the sample that has higher probability value as the output.Here, it is used to find whether the nodes in WCNs are normal nodes or abnormal nodes.
a) Solution encoding: The range of the solution encoding is represented as 1��[2��m��C] in which the upper bound value is set to (mean��variance) and the lower bound value is set to (10% of variance�� variance), where, m represents the number of attributes and C represents the number of classes, and 2 represents mean and variance. For example, the number of attributes is four and number of classes is two, then the range of solution encoding is represented as 1��[2��4��2], that is [1��16], as shown in Figure 4.
Here, we consider the number of attributes is 10 and the number of classes is two. Therefore, the range of the solution encoding is 1��[2��10��2].
b) Fitness calculation: The proposed method generates the new fitness function by combining the naive Bayes classifier and the lion optimization algorithm. At first, the data sets are grouped into f clusters using the fuzzy clustering algorithm. Then, every datum in the clusters is evaluated, and the mean and variance of the attributes of data in every cluster are calculated. These values are represented as a vector and assigned to the XM and XF. The posterior probability of the data attributes is calculated for both the normal class C1 and the abnormal class C2. For the positive training data, the posterior probability of the data attributes on the normal class should be the maximum. Similarly, for the negative training data, the posterior probability of the data attributes on the abnormal class should be the maximum. Finally, the overall fitness value should be the maximum. The following equation calculates the fitness,
 (6)
(6)
where |tp| represents the number of positive training data; |tn| represents the number of negative training data; represents the jth attribute of the ith datum; C1 represents the positive class; C2 represents the negative class; POS represents the posterior function. The normal class represents the class that was not affected by the intruders; and the abnormal class represents the intruded class.

Figure 3 Block diagram of LNB model

Figure 4 Solution encoding
c) Lion optimization algorithm: Here, the lion optimization algorithm [28] is presented for optimally generating the probabilistic measures. When compared to the other optimization algorithms, the lion optimization algorithm preserves the substantial and genuine performance; at the same time, it produces the optimal solutions. The lion optimization algorithm is based on the social behaviours of the lion. It determines that the best solution depends on two behaviours of the lion named as territorial defense and territorial takeover and dissipates the old solutions. Territorial defense assess the worth of old solution and the new solution. If the new solution is the best, then the old solution is replaced by the new solution. Here, old solution means the territorial lion and the new solution means the nomadic lion. Territorial takeover maintains only the best male and female solutions and dissipates the old solutions.
Step 1: Pride generation. In this step, ZM, ZF and  are generated from the solutions which represent the pride generation of male, female, and nomadic lions respectively. The mean and variance of every data are calculated. The mean and variance are represented as a solution vector and assigned to ZM, ZF and . The elements of ZM, ZF and are represented as ZM(k), ZF(k) and
  in which k=1, 2, ��, K. The elements are the arbitrary integers which are produced within the bounds of maximum and minimum limits. Here, K represents the number of kernel models to be optimized.
Step 2: Fitness calculation. In this step, the fitness is calculated by Eq. (6) to evaluate the pride generation.
Step 3: Fertility evaluation. In this step, the fertility of the territorial male lion and female lion is evaluated.
Fertility evaluation of male lion: At first, laggardness rate (Hr) is set to zero. If the reference fitness (f e) is greater than or equal to the fitness of the male lion, then Hr is increased. If the reference fitness is lower than the fitness of the male lion, then Hr is reset and the fitness of the mail lion is set as the reference fitness.
Fertility evaluation of female lion: Initially, the sterility rate Ir is set to zero and check the tolerance to find out whether it exceeds the maximum limit  . The maximum limit of Ir is set as four for the oestrus period of the female lion. The female update count bc and the female generation count hc are set to zero. Then, the female lion is updated and the female generation count hc is increased by one. If the fitness of the updated female lion is smaller than the fitness of the female lion, then the female update count bc is set to one and the updated female lion is the best female lion. After that, sterility rate Ir has been increased. This process is continued until the female generation count hc reaches the
  . The maximum value of hc is 10.
The female lion can be updated as follows,
 (7)
(7)
 (8)
(8)
 (9)
(9)
where  is the kth vector element of updated female lion ZF+;
 is the sth vector element of ZF+; s is the random integer generated within the interval [1, K];
  represents the female update function; l1 and l2 are the random integers generated within the interval [0, 1].
Step 4: Mating. Mating consists of two steps namely, crossover and mutation. In crossover, four cubs are considered with random crossover probability Jr based on the natural littering rate [29]. The crossover operation can be represented as follows,
 (10)
(10)
where E represents the crossover mask of length K in which 0 s and 1s are randomly filled based on Jr;  is the one's complement of E;
  represents the Hadamard product or Schur product; Zc(q) is the qth cub acquired from the crossover function.Then, the acquired cubs Z c are forced to undergo mutation with the mutation probability Or. Therefore, equal number of new cubs ZN-c are generated by the mutation. Then, the cubs Zc acquired by the crossover and the cubs ZN-c acquired by the mutation are placed in a cub pool. One male cub and one female cub are taken from the cub pool by the gender clustering [28] method according to the physical nature of lions [30]. The cub which has the first best fitness is chosen as the male cub and the cub which has the second best fitness is chosen as the female cub. Once the male and female cubs are selected, the age of the cubs Yc is set as zero.
Step 5: Cub growth generation. In this step, the male cubs (ZB-c) and the female cubs (ZG-c) are forced to undergo uniform random mutation at a rate of Qr. The old male cubs and female cubs are replaced by the mutated male cubs and the mutated female cubs respectively, if the mutated male cubs and the mutated female cubs are better than the old male cubs and the female cubs. At every iteration of cub growth function, Yc is incremented by one and Qr is different from the mutation probability Or.
Step 6: Territorial defense. The major operator in the lion algorithm is the territorial defense [28] used to lead the algorithm to perform searching in a wide manner. The territorial defense is performed by making nomad lions coalition, survival fight, updating of pride and nomad coalition. In this step, the nomadic lion is initialized based on the laggardness rate (Hr) when Hr is less than or equal to the
 oris initialized by the mutation with a mutation rate 1-Qr. Then, the survival fight is performed between the one lion in the nomadic coalition and the lion in the pride. Based on the winner take all approach [31], the winning nomadic lion Zt-N occupies the territorial defense. The results of the survival fight are favor to the Zt-N when the following criteria are met. Then, the pride is updated by replacing the male lion by the winning nomadic lion. Similarly, the nomadic coalition can be updated if the nomadic lion is defeated.
 (11)
(11)
 (12)
(12)
 (13)
(13)
The next process is the nomadic lion coalition updating, in which the nomadic lion ZN is selected if HN is greater than or equal to the unity exponential value. can be calculated as follows,
 (14)
(14)
where u1 represents the Euclidean distance between  and ZM and u2 represents the Euclidean distance between
  and ZM. If the result of defense is zero, then the male lion ZM and the frequency of the male lion f(ZM) are stored and the process is continued from the fertility evaluation step.
Step 7: Territorial takeover. If the age of the cub is greater than or equal to the maximum age, the territorial takeover step is processed; otherwise, the cub growth function and the territorial defense are repeated. The maximum age is set as three. Territorial takeover is the process of providing the area to the male cub and female cub after they became matured. If the female cub is better than the female lion, then the female cub occupies the position of the female lion and the sterility rate Ir is set to zero in the territorial takeover process.
Step 8: Termination criteria. There are two termination criteria represented in Eqs.(15) and (16).
 (15)
(15)
 (16)
(16)
where RF represents the number of function evaluations; represents the maximum number of function evaluations; ET represents the target error. The algorithm will stop if any one of the above criteria is met; otherwise, the process is continued from Step 3.
4.3 FLBS: Fuzzy lion Bayes system
Here, the proposed FLBS for intrusion detection in WCNs is described. At first, the proposed IDS groups the data into f clusters by the fuzzy clustering method and creates the model for each data group by finding the mean and variance of each attribute of data in the data group. Then, the LNB model is created by integrating the lion optimization algorithm with the naive Bayes classifier, and it is applied to every data group. After applying the LNB model to every data group, the aggregated datum is generated and the posterior of data with respect to the class C1 and the class C2 is computed for all the models. Then, the model is created for the aggregated data group by finding the mean and variance of the attributes of datum in the aggregated data group. In the testing phase, the test data is considered, and the LNB model is applied to the test data. At last, the normal and abnormal nodes in the WCNs are determined from the testing phase.
Figure 5 describes the pseudo code of the proposed FLBS IDS. The input of the proposed method is the data set which consists of both normal and abnormal data. The aim of this method is to identify the normal nodes and the abnormal nodes separately. At first, the number of clusters is initialized randomly, and the centroid of each cluster is calculated. Then, the distance between the centroid and the data is calculated. If the cluster centroid and the data are closer to each other then, the datum remains in the same cluster; otherwise, the datum is removed from the particular cluster and assigned to another cluster in which the distance between the cluster centroid and the data is the minimum. After grouping the data into clusters, the model for each data group is created by calculating the mean and variance of the attributes of data. Then, the LNB model is applied to each model, and the aggregated datum is created. Then, the optimal model is created by finding the mean and variance of data attributes in the aggregated data, and the LNB model is applied to the aggregated data. Finally, the abnormal nodes in the data set are identified based on the posterior probability function. The posterior probability of the data with respect to the normal class and the abnormal class is finding out, and the datum having the higher posterior probability is represented as the abnormal datum.
FLBS algorithm
1
Input: Data set D
2
Output: Class of data instance
3
Parameters: A��aggregated data, C1�� normal class, C2��abnormal data, t��test data
4
Begin
5
Read the training data di
6
Perform fuzzy clustering
7
For (Every data group )
8
Generate the initial model
9
Apply LNB
10
End for
11
Generate aggregated data A
12
Apply LNB on aggregated data
13
Read the testing data t
14
Generate aggregated data for test input t using optimal model M
15
For (k=1 to 2 in Ck)
16
Find posterior probability of test data
17
If (the data has higher posterior probability)
18
Abnormal data
19
Else
20
Normal data
21
End if
22
End for
23
End
4.3.1 Training phase
In the training phase, the data set is grouped into f groups, namely, D1, D2, ��, Df by using the fuzzy clustering method. Then, the model for each data group is created by finding the mean and variance of each attribute of data presented in every data group. The final model of data group is represented as follows,
 (17)
(17)
where �� represents the mean; �� represents the variance; represents the jth attribute of data. After creating the model for each data group, the LNB model is applied to all the data groups, and the aggregated datum A is generated by combining the LNB results of the data groups. The aggregated data can be represented as follows,
 (18)
(18)
where A represents the aggregated datum and yi represents the ith datum in A. The representation of yi is described as follows,
 (19)
(19)
where represents the attribute of the ith data. Then, the posterior of each data in the aggregated data with respect to the class C1 and class C2 is calculated for all the models M1, M2, ��, Mf. The attribute of the data is assigned to the class and the datum belonging to the class is calculated by finding the posterior probability function. This can be represented as follows,


 (20)
(20)
where M1, M2 and Mf are the model 1, model 2 and model f respectively; POS represents the posterior probability; C1 and C2 represent the class 1 and class 2 respectively; di represents the ith datum. The posterior probability of the data belonging to the class is computed by the Bayes rule, and the datum is assigned to the class that has the higher posterior probability. The following equation calculates the posterior probability,
 (21)
(21)
where di represents the ith datum; Ck represents the class k; aj is the jth attribute of data di.  is the posterior probability of data di belonging to the class Ck.The probability distribution of the data belonging to the class Ck is calculated using Eq. (22).
 (22)
(22)
where  is the probability of the data; di belongs to the class Ck; �� represents the variance; �� represents the mean. Then, the LNB model is applied to the aggregated data A which is represented as, M=LNB(A).
 (23)
(23)
where M is the optimal model; represents the wth attribute of the ith data.
4.3.2 Testing phase
In the testing phase, the test data are considered, and the LNB model is applied to the test data. Consider the test data t from the data group and determine whether it is the attacked data or the normal data. For that, the attribute of the test data is considered and represented as  At first, the posterior probability of the test data belongs to the normal class C1 and the abnormal class C2 is calculated for the models M1, M2, ��, Mf. This is represented as follows,

 (24)
(24)
where represents the jth attribute of the test data t; C1 and C2 represent the normal class and the abnormal class respectively; M1, M2 and Mfrepresent the model 1, model 2, and model f respectively; POS represents the posterior probability function. The posterior probability of the test data is calculated by the Bayes classifier that assigns the label
  for some k.
 (25)
(25)
where represents the jth attribute of the test data;  is calculated by the following equation.
 (26)
(26)
where represents the jth attribute of the test data; �� represents the mean and �� represents the variance. If the posterior probability of the data is higher, then it is returned as the abnormal data.
5 Results and discussion
This section represents the experimental results of the proposed FLBS for detecting the intrusion in WCN and the comparative discussion of the proposed system with the existing methods, such as NB+FCM, NB+KM [32], and NN+FCM [26] for the evaluation metrics accuracy and false acceptance rate (FAR) by experimenting the KDD Cup 99 data and NSL-KDD dataset.
5.1 Experimental set up
The proposed FLBS is experimented in a personal computer with Intel Core i3 processor and 2GB memory using Windows 8 operating system. The implementation of the proposed method is performed using MATLAB.
5.2 Evaluation metrics
The evaluation metrics considered for analyzing the performance of the proposed FLBS are accuracy and FAR.
a) Accuracy: The following equation calculates the accuracy [6].
 (27)
(27)
where TP is the true positive which represents the number of actual attacks specified as attacks; TN is the true negative which represents the number of actual normal records specified as the normal records; FP is the false positive which represents the number of actual normal records specified as attack records; FN is the false negative which represents the number of actual attacks specified as normal ones.
b) FAR: FAR is the measure that the intrusion detection system accepts the access of the unauthorized users by mistake.
 (28)
(28)
5.3 Dataset description
KDD Cup-99 data set: The proposed system is evaluated in KDD Cup-99 data set. The KDD Cup-99 data set is developed by STOLFO et al [33]. This data set is built depending on the data presented in the DARPA��98 IDS evaluation program [34], and it contains around 4.9��106 single connection vectors. Each connection vector has 41 features, and it is indexed as either normal or attack. The features of KDD Cup-99 data set are classified into three groups, namely basic features, traffic features, and content features. The basic features include the attributes of the TCP/IP connection. Traffic features are calculated regarding of the window interval, and the content features are used to detect the remote to local attack (R2L) and user to root attack (U2R) attacks. The data set consists of 24 training attack types. Normally, attacks are grouped into four categories: 1) Denial-of-service attack (DoS), 2) R2L, 3) U2R, and 4) probing attack.
1) DoS attack: This type of attack denies the authorized user to access the system.
2) R2L: In this attack, the attackers access the system from the remote machine. Example for this type of attack is the password guessing.
3) U2R: Here, the attackers access the user��s system, and the root access is gained by exploiting the vulnerabilities to the system, i.e., buffer-flow attack.
4) Probing attack: This type of attack tries to gather the network��s information and finds the way to access the security controls of the system [32].
NSL-KDD dataset: The NSL-KDD dataset [35] is a data set utilized to solve some of the intrinsic issues of the KDD data set. The dataset is inexpensive and can be used to implement the experiments on the complete set without selecting a small portion. Subsequently, the evaluation results of the research work are consistent and comparable. The classification rate of distinctive machine learning methods varies in a wider range that makes it more competent to produce accurate assessment for various learning techniques.
5.4 Comparative algorithms
The proposed FLBS is compared with the existing intrusion detection systems, such as NB+FCM, NB+KM [36], and NN+FCM [26] for analyzing the performance.
a) NB+FCM.
b) NB+KM: Here, the naive Bayes classifier and the K-means clustering are used to perform intrusion detection. Initially, K-means clustering detects the samples that have both normal and abnormal activities; then the naive Bayes classifier classifies the samples into exact classes. The drawback of this method is that it did not have the ability to detect the intrusions that have similar characteristics.
c) NN+FCM: Here, the fuzzy clustering generates the various training data sets. Depending on the training data sets, neural network models are trained and applied to each data set, and the base model is generated then, the aggregation module is used to group the results. The limitation of this method is that generation of the proper number of clusters is the difficult process.
5.5 Algorithmic analysis
Here, the experimental results of the proposed FLBS for intrusion detection are described. The proposed system evaluated for the performance measures FAR and accuracy. Figure 4 represents the FAR of the proposed FLBS on iteration 10 and iteration 20. Figure 5(a) represents the FAR of the proposed system on iteration 10 with cluster size 2, 3, 4 and 5. When the cluster size is two, the FAR of the proposed method is 11.0944%, 1.7972%, 3.6185%, 0.8750% and 12.9778% for the data 20%, 40%, 60%, 80% and 100%, respectively. For 20% of the data, the FAR of the proposed system is 51.0111%, 9.1611% and 11.6056% for the cluster size three, four, and five respectively. When the percentage of the data is 40%, the FAR is 1.1250%, 1.7083% and 1.5778% for the cluster size of three, four, and five respectively. When the percentage of the data is 60%, the FAR is 5.2556%, 27.8222% and 21.5019% for the cluster size three, four, and five respectively. For 80% percentages of the data, the FAR is 1.3444%, 24.4167% and 5.7722% when the cluster size is three, four, and five respectively. For 100% percentage of data, the FAR of the proposed system is 31.4611%, 1.2878% and 0.8750% when the cluster size is three, four, and five respectively. Figure 5(b) represents the FAR of the proposed system on iteration 20 with cluster size 2, 3, 4 and 5. When the cluster size is two, the FAR of the proposed method is 11.6389%, 43.6667%, 3.6278%, 1.3514%, and12.9778% for the percentage of data 20%, 40%, 60%, 80% and 100%, respectively. For 20% percentage of the data, the FAR of the proposed system is 12.7556%,12.0389% and 12.2111% for the cluster size three, four, and five respectively. When the percentage of the data is 40%, the FAR is 1.3806%, 3.4000% and 2.6194% for the cluster size of three, four, and five respectively. When the percentage of the data is 60%, the FAR is 8.5204%, 25.7648%, and 21.3630% for the cluster size three, four, and five respectively. For 80% percentage of the data, the FAR is 1.4139%, 24.2528% and 4.0194% when the cluster size is three, four, and five respectively. For 100% percentage of data, the FAR of the proposed system is 31.4611%, 19.5426% and 0.8750% when the cluster size is three, four, and five respectively.

Figure 5 FAR of proposed FLBS on iteration 10 (a) and iteration 20 (b)
Figure 6 represents the accuracy of the proposed FLBS for intrusion detection on iteration 10 and iteration 20. Figure 5(a) represents the accuracy of the proposed system on iteration 10 for the cluster size two, three, four, and five. When the cluster size is two, the accuracy of the proposed system is 88.9056%, 98.2028%, 96.3815%, 99.1250% and 87.0222% for 20%, 40%, 60%, 80% and 100%, of data respectively. The accuracy of the proposed system is 48.9889%, 90.8389%, and 88.3944% when the percentage of data is 20%, and the cluster size is three, four, and five respectively. When the percentage of data is 40%, the accuracy is 98.8750%, 98.2917% and 98.4222% for the cluster size of three, four, and five respectively. For 60% percentage of data, the accuracy of the proposed method is 94.7444%, 72.1778% and 78.4981% when the cluster size is three, four, and five respectively. When the percentage of the data is 80%, the accuracy is 98.6556%, 75.5833% and 94.2278% for the cluster size three, four, and five respectively. When the percentage of the data is 100%, the accuracy is 68.5389%, 98.7122% and 99.1250% for the cluster size three, four, and five respectively. Figure 5(b) represents the accuracy of the proposed system on iteration 20% for the cluster size two, three, four, and five. When the cluster size is two, the accuracy of the proposed system is 88.3611%, 56.3333%, 96.3722%, 98.6486% and 87.0222% for 20%, 40%, 60%, 80% and 100% of data respectively. The accuracy of the proposed system is 87.2444%, 87.9611% and 87.7889% when the percentage of data is 20% and the cluster size is three, four, and five respectively. When the percentage of data is 40%, the accuracy is 98.6194%, 96.6000% and 97.3806% for the cluster size of three, four, and five respectively. For 60% percentage of data, the accuracy of the proposed method is 91.4796%, 74.2352% and 78.6370% when the cluster size is three, four, and five respectively. When the percentage of the data is 80, the accuracy is 98.5861%, 75.7472% and 95.9806% for the cluster size three, four, and five respectively. When the percentage of the data is 100%, the accuracy is 68.5389%, 80.4574% and 99.1250% for the cluster size three, four, and five respectively.

Figure 6 Accuracy of proposed FLBS on iteration 10 (a) and iteration 20 (b)
5.6 Comparative analysis
The proposed FLBS is compared with the existing methods, such as NB+FCM, NB+KM, and NN+FCM for the evaluation metrics FAR and accuracy. Figure 7 shows the comparative analysis of the proposed FLBS with the existing methods, such as NB+FCM, NB+KM, and NN+FCM for FAR on cluster size three and five. Figure 7(a) shows the comparative analysis of the proposed method with the existing methods when the cluster size is three. When the percentage of the data is 20, the FAR of the proposed system is 1.7972% while the FAR of the existing methods, such as NB+FCM, NB+KM, and NN+FCM, is 12.7556%, 60.0722%, and 33.4222% respectively. For 40% of data, the FAR of the proposed system is 1.1250%; on the other hand, the FAR of the existing methods, such as NB+FCM, NB+KM, and NN+FCM, is 1.3806%, 1.7583%, and 25.4222% respectively. For 60% of data, the FAR of the existing methods, such as NB+FCM, NB+KM, and NN+FCM, is 8.5204%, 10.1167%, and 31.5148% respectively, while the FAR of the proposed system is 1.7083%. For 80% of data, the FAR of the proposed FLBS system is 1.5778%; on the other hand, the FAR of the existing methods, such as NB+FCM, NB+KM, and NN+FCM, is 1.4139%, 4.4403%, and 18.8639% respectively.For 100% of data, the proposed system has the FAR of 1.2878% while the existing methods, such as NB+FCM, NB+KM, and NN+FCM, have the FAR of 3.2600%, 12.3711%, and 8.5844% respectively. Figure 7(b) shows the comparative analysis of the proposed method with the existing methods when the cluster size is five. When the percentage of the data is 20, the FAR of the proposed system is 0.8750% while the FAR of the existing methods, such as NB+FCM, NB+KM, and NN+FCM, is 12.2111%, 12.2111% and 12.7278%, respectively. For 40% of data, the FAR of the proposed system is 1.3444%; on the other hand, the FAR of the existing methods, such as NB+FCM, NB+KM, and NN+FCM, is 2.6194%, 2.5194% and 32.7917%, respectively. For 60% of data, the FAR of the existing methods, such as NB+FCM, NB+KM, and NN+FCM, is 21.3630%, 26.3667% and 19.4537% respectively; while the FAR of the proposed system is 24.4167%. For 80% of data, the FAR of the proposed FLBS system is 5.7722%; on the other hand, the FAR of the existing methods, such as NB+FCM, NB+KM, and NN+FCM, is 4.0194%, 48.9463%, and 2.0264% respectively. For 100% of data, the proposed system has the FAR of 0.8750% while the existing methods, such as NB+FCM, NB+KM, and NN+FCM, have the FAR of 3.2600%, 7.5889% and 12.2789% respectively.
Figure 8 shows the comparative analysis of the proposed FLBS with the existing methods, such as NB+FCM, NB+KM, and NN+FCM for accuracy on cluster size three and five. Figure 8(a) shows the comparative analysis of the proposed method with the existing methods when the cluster size is three. For 20% of the data, the accuracy of the proposed system is 98.2028% while the accuracy of the existing methods, such as NB+FCM, NB+KM, and NN+FCM, is 87.2444%, 39.9278% and 66.5778% respectively. When the amount of the data is 40%, the accuracy of the proposed system is 98.8750%; on the other hand, the accuracy of the existing methods, such as NB+FCM, NB+KM, and NN+FCM, is 98.6194%, 98.2417% and 74.5778%, respectively; For 60% of data, the accuracy of the existing methods, such as NB+FCM, NB+KM, and NN+FCM is 91.4796%, 89.8833% and 68.4852%, respectively, while the accuracy of the proposed system is 98.2917%. For 80% of data, the accuracy of the proposed FLBS system is 98.4222%; on the other hand, the accuracy of the existing methods,such as NB+FCM, NB+KM and NN+FCM, is 98.5861%, 95.5597% and 81.1361% respectively.For 100% of data, the proposed system has the accuracy of 98.7122% while the existing methods, such as NB+FCM, NB+KM, and NN+FCM have the accuracy of 96.7400%, 87.6289% and 91.4156%, respectively. Figure 8(b) shows the comparative analysis of the proposed method with the existing methods when the cluster size is five. For 20% of the data, the accuracy of the proposed system is 99.1250%; while the accuracy of the existing methods, such as NB+FCM, NB+KM, and NN+FCM, is 87.7889%, 87.7889% and 87.2722% respectively. When the amount of the data is 40%, the accuracy of the proposed system is 98.6556%; on the other hand, the accuracy of the existing methods, such as NB+FCM, NB+KM and NN+FCM, is 97.3806%, 97.4806% and 67.2083%, respectively. For 60% of data, the accuracy of the existing methods, such as NB+FCM, NB+KM, and NN+FCM, is 78.6370%, 73.6333% and 80.5463% respectively; while the accuracy of the proposed system is 75.5833%. For 80% of data, the accuracy of the proposed FLBS system is 94.2278%; on the other hand, the accuracy of the existing methods, such as NB+FCM, NB+KM and NN+FCM, is 95.9806%, 51.0537% and 97.9736% respectively.For 100% of data, the proposed system has the accuracy of 99.1250% while the existing methods, such as NB+FCM, NB+KM, and NN+FCM, have the accuracy of 96.7400%, 92.4111% and 87.7211%, respectively.

Figure 7 Comparative analysis of FAR of proposed FLBS with existing methods NB+FCM, NB+KM, and NN+FCM on cluster size three and five:
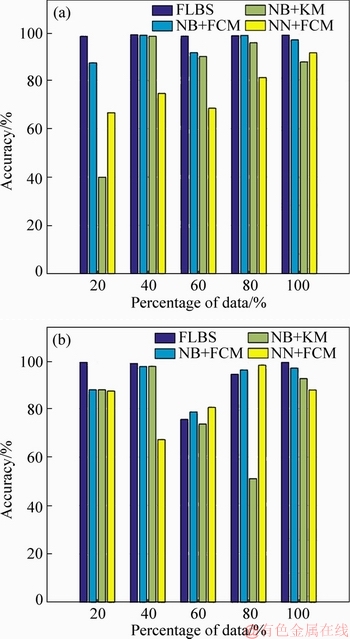
Figure 8 Comparative analysis of accuracy of proposed FLBS with existing methods, such as NB+FCM, NB+KM, and NN+FCM on cluster size three (a) and five (b)
5.7 Discussion
Table 1 shows the comparative discussion of the proposed FLBS with the existing methods, such as NB+FCM, NB+KM, NN+FCM, SVM [37], BP [6], decision tree [26], naive Bayes [26], the pruning VELM [38], and improved ensemble [39] for the evaluation metrics accuracy and FAR. From the table, the accuracy of the proposed system is 99.1250% while the accuracy of the existing methods, such as NB+FCM, NB+KM and NN+FCM, is 98.6194%, 98.2417% and 97.9736% respectively. The accuracy of the SVM model is 98.21% and the accuracy of the BP model is 97.42%. The accuracy of the decision tree model and Naive Bayes model is 96.75% and 96.11% respectively. The proposed system has the FAR of 0.8750%; on the other hand, the FAR of the existing methods, such as NB+FCM, NB+KM and NN+FCM, is 1.3806%, 1.7583% and 2.0264%.
Table 1 Comparative discussion of proposed FLBS with existing methods, such as NB+FCM, NB+KM and NN+FCM for accuracy and FAR
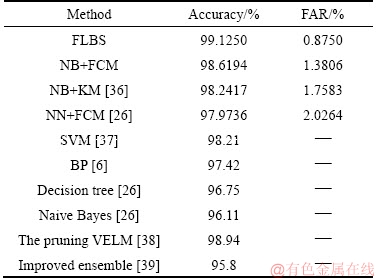
respectively. From the table, it can be concluded that the proposed FLBS has higher accuracy and the minimum FAR when compared to the existing methods.
Table 2 portrays the comparative discussion of the proposed FLBS with the existing methods, such as NB+FCM, NB+KM, NN+FCM, SVM, BP, decision tree, Naive Bayes, pruning VELM, and Improved ensemble in terms of accuracy and FAR using NSL-KDD dataset. From the table, it is noted that the accuracy of the proposed FLBS is 99.1550%, whereas the accuracy of the existing methods, such as NB+FCM, NB+KM, NN+FCM, SVM, BP, decision tree, Naive Bayes, pruning VELM and improved ensemble is 99.41%, 97.32%, 96.39%, 98.21%, 96.42%, 95.65%, 95.11%, 96.94% and 95.8%, respectively. The proposed system has the FAR of 0.86%; on the other hand, the FAR of the existing methods, such as NB+FCM, NB+KM and NN+FCM, is 1.27%, 1.62%, 2.01%, respectively. From the table, it can be concluded that the proposed FLBS has higher accuracy and the minimum FAR when compared to the existing methods.
Table 2 Comparative discussion of proposed FLBS with existing methods, such as NB+FCM, NB+KM, and NN+FCM for accuracy and FAR using NSL-KDD dataset

When the accuracy of the proposed FLBS is 98%, then the corresponding values of TP, TN, FP, and FN are 24111, 11242, 563 and 84, respectively. The matrix form of the accuracy is given as follows,
 (29)
(29)
6 Conclusions
This paper presents the FLBS for detecting intrusion in the wireless communication network. Initially, the data set is grouped into a number of clusters by the fuzzy clustering algorithm. Then, the model for each data group is created by finding the mean and variance of the data attributes in the data group. Here, the Naive Bayes classifier is integrated with the lion optimization algorithm and the new LNB model is created for optimally generating the probability measures. Then, the LNB model is applied to each data group, and the aggregated datum is generated. After generating the aggregated data, the LNB model is applied to the aggregated data, and the abnormal nodes are identified based on the posterior probability function. The proposed FLBS is evaluated with the existing methods, such as NB+FCM, NB+KM, and NN+FCM for the evaluation metrics accuracy and FAR. The experimental results show that the proposed system finds the normal nodes and attacked nodes in the WCN with a maximum accuracy of 99.1550% and the minimum FAR of 0.86%.
References
[1] ASSAD N, ELBHIRI B, FAQIHI M A, OUADOU M, ABOUTAJDINE D. Efficient deployment quality analysis for intrusion detection in wireless sensor networks [J]. Wireless Networks, 2016, 22(3): 991-1006. DOI: 10.1007/ s11276-015-1015-z.
[2] TIAN J, ZHANG W, WANG G, GAO X. 2D k-barrier duty-cycle scheduling for intruder detection in wireless sensor networks [J]. Computer Communications, 2014, 43: 31-42. DOI: 10.2316/P.2012.789-022.
[3] BASTE V S, SHENDE D K. Efficient utilization of channel coding for wireless communication [J]. International Journal of Electronics, Electrical and Computational System, 2017, 6(9): 579-583.
[4] GUO Q, LI X, XU G, FENG Z. MP-MID: Multi-protocol oriented middleware-level intrusion detection method for wireless sensor networks [J]. Future Generation Computer Systems, 2017, 70: 42-47. DOI: 10.1016/j.future.2016. 06.010.
[5] MUKHEDKAR M, POWAR P, GAIKWAD P. Secure non real time image encryption algorithm development using cryptography & steganography [C]// Proceedings of the Annual IEEE India Conference (INDICON). 2015: 1-6. DOI: 10.1109/INDICON.2015.7443808.
[6] MA T, WANG F, CHENG J, YU Y, CHEN X. A hybrid spectral clustering and deep neural network ensemble algorithm for intrusion detection in sensor networks [J].Sensors, 2016, 16(10). DOI:10.3390/s16101701.
[7] SHAMSHIRBAND S, AMINI A, ANUARB N B, KIAHB L M, TEH Y W, FURNELL S. D-FICCA: A density-based fuzzy imperialist competitive clustering algorithm for intrusion detection in wireless sensor networks [J]. Measurement, 2014, 55: 212-226. DOI: 10.1016/ j.measurement.2014.04.034.
[8] MOOSAVI H, BUI F M. A game-theoretic framework for robust optimal intrusion detection in wireless sensor networks [J]. IEEE Transactions on Information Forensics and Security, 2014, 9(9): 1367-1379. DOI: 10.1109/TIFS. 2014.2332816.
[9] HAN G, JIANG J, SHEN W, SHU, RODRIGUES J. IDSEP: A novel intrusion detection scheme based on energy prediction in cluster-based wireless sensor networks [J]. IET Information Security, 2013, 7(2): 97-105. DOI: 10.1049/iet-ifs.2012.0052.
[10] AMBUSAIDI M A, HE X, NANDA P. Building an intrusion detection system using a filter-based feature selection algorithm [J]. IEEE Transactions on Computers, 2016, 65(10): 2986-2998.DOI:10.1109/TC.2016.2519914.
[11] YANG Y, GAO L, YUAN Y, LAUGHLIN K M, SEZER S, GONG Y. Multidimensional intrusion detection system for IEC 61850-based SCADA networks [J]. IEEE Transactions on Power Delivery, 2017, 32(2): 1068-1078. DOI: 10.1109/ TPWRD.2016.2603339.
[12] YANG H, WANG F. Wireless network intrusion detection based on improved convolutional neural network [J]. IEEE Access, 2019, 7: 64366-64374. DOI: 10.1109/ACCESS. 2019.2917299.
[13] OTOUM S, KANTARCI B, MOUFTAH H T. On the feasibility of deep learning in sensor network intrusion detection [J]. IEEE Networking Letters, 2019, 1(2): 68-71. DOI: 10.1109/LNET. 2019.2901792.
[14] CHENG Z. A differential game model between intrusion detection system and attackers for wireless sensor networks [J]. Wireless Personal Communications, 2016, 90(3): 1211-1219. DOI: 10.1007/s11277-016-3386-6.
[15] SAGAR A K, LOBIYAL D K. Probabilistic intrusion detection in randomly deployed wireless sensor networks [J]. Wireless Personal Communications, 2015, 84(2): 1017- 1037. DOI: 10.1007/s11277-015-2673-y.
[16] WANG Y, FU W, AGRAWAL D P. Gaussian versus uniform distribution for intrusion detection in wireless sensor networks [J]. IEEE Transactions on Parallel and Distributed Systems, 2013, 24(2): 342-355. DOI: 10.1109/TPDS.2012. 105.
[17] POLEPALLY V, CHATRAPATI K S. Dragonfly optimization and constraint measure-based load balancing in cloud computing [J]. Cluster Computing, 2019, 22(1): 1099-1111. DOI: 10.1007/s10586-017-1056-4.
[18] CHINTALAPALLI R M, ANANTHULA V R. M-lion whale: multi-objective optimisation model for secure routing in mobile ad-hoc network [J]. IET Communications, 2017, 12(12): 1406-1415. DOI: 10.1049/iet-com.1279.
[19] DEVI R, JHA R K, GUPTA A, JAIN S, KUMAR P. Implementation of intrusion detection system using adaptive neuro-fuzzy inference system for 5G [J]. Wireless Communication Network, AEU-International Journal of Electronics and Communications, 2017, 74: 94-106. DOI: 10.1016/j.aeue.2017.01.025.
[20] CHEN G, ZHANG Y, WANG C. A wireless multi-step attack pattern recognition method for WLAN [J]. Expert Systems with Applications, 2014, 41(16): 7068-7076. DOI:10.1016/j.eswa.2014.05.029.
[21] CHITRAKAR R, HUANG C. Selection of candidate support vectors in incremental SVM for network intrusion detection [J]. Computers & Security, 2014, 45: 231-241. DOI: 10.1016/j.cose.2014.06.006.
[22] RAMAKRISHNAN S, DEVARAJU S. Attack��s feature selection-based network intrusion detection system using fuzzy control language [J]. International Journal of Fuzzy Systems, 2017, 19(2): 316-328. DOI: 10.1007/s40815-016- 0160-6.
[23] VASUDEVAN A R, SELVAKUMAR S. Local outlier factor and stronger one class classifier based hierarchical model for detection of attacks in network intrusion detection dataset [J]. Frontiers of Computer Science, 2016, 10(4): 755-766. DOI: 10.1007/s11704-015-5116-8.
[24] NI Q, PAN Q, DU H, CAO C, ZHAI Y. A novel cluster head selection algorithm based on fuzzy clustering and particle swarm optimization [J]. IEEE/ACM Transactions on Computational Biology and Bioinformatics, 2017, 14(1): 76- 84. DOI: 10.1109/TCBB.2015.2446475.
[25] RAJAKUMAR B R. Lion algorithm for standard and large scale bilinear system identification: A global optimization based on lion��s social behavior [C]// Proceedings of the IEEE Congress on Evolutionary Computation (CEC). Beijing, China, 2014: 6-11. DOI: 10.1109/CEC.2014. 6900561.
[26] WANG G, HAO J, MA J, HUANG L. A new approach to intrusion detection using artificial neural networks and fuzzy clustering [J]. Expert Systems with Applications, 2010, 37(9): 6225-6232. DOI:10.1016/j.eswa.2010.02.102.
[27] YANG B, LEI Y, YAN B. Distributed multi-human location algorithm using naive Bayes classifier for a binary pyroelectric infrared sensor tracking system [J]. IEEE Sensors Journal, 2016, 16(1): 216-223. DOI: 10.1109/ JSEN.2015.2477540.
[28] RAJAKUMAR B R. The Lion��s algorithm: A new nature-inspired search algorithm [C]// Proceedings of the Second International Conference on Communication, Computing and Security. 2012, 6: 126-135. DOI: 10.1016/ j.protcy.2012.10.016.
[29] PACKER C, PUSEY A E. Divided we fall: Cooperation among lions [J]. Scientific American, 1997, 276: 52-59. DOI: 10.1038/scientificamerican0597-52.
[30] O��BRIEN S J, JOSLIN P, SMITH G L, WOLFE R, SCHAFFER N, HEATH E, OTT-JOSLIN J, RAWAL P P, BHATTACHARJEE K K, MARTENSON J S. Evidence for african origins of founders of the asiatic lion species survival plan [J]. Zoo Biology, 1987, 6(2): 99-116. DOI: 10.1002/ zoo.1430060202.
[31] KOHONEN T. Self-organization and associative memory [M]// Information Sciences, 1984. DOI: 10.1007/978-3- 642-88163-3.
[32] TAVALLAEE M, BAGHERI E, LU W, GHORBANI A A. A detailed analysis of the KDD CUP 99 data set [C]// Proceedings of the IEEE Symposium on Computational Intelligence in Security and Defense Applications, 2009. DOI: 10.1109/CISDA.2009.5356528.
[33] STOLFO S J, FAN W, LEE W, PRODROMIDIS A, CHAN P K. Costbased modeling for fraud and intrusion detection: Results from the jam project, discex, 2, 1130 [R]. 2000. DOI: 10.1109/DISCEX.2000.821515.
[34] LIPPMANN R P, FRIED D J, GRAF I, HAINES J W, KENDALL K R, CLUNG D M, WEBER D, WEBSTER S E, WYSCHOGROD D, CUNNINGHAM R K, ZISSMAN M A. Evaluating intrusion detection systems: The 1998 darpa off-line intrusion detection evaluation [C]// Proceedings of the DARPA Information Survivability Conference and Exposition. 2000. DOI: 10.1109/DISCEX.2000.821506.
[35] NSL-KDD dataset [OL]. [2019-06]. https://www.unb.ca/cic/ datasets/nsl.html.
[36] MUDA Z, YASSIN W, SULAIMAN M N, UDZIR N I. A k-means and naive Bayes learning approach for better intrusion detection [J]. Journal of Information technology, 2011, 10(3): 648-655. DOI: 10.3923/itj.2011.648.655.
[37] CHEN W H, HSU S H, SHEN H P. Application of SVM and ANN for intrusion detection [J]. Computers & Operations Research, 2005, 32(10): 2617-2634. DOI: 10.1016/j.cor. 2004.03.019.
[38] SHEN Y, ZHENG K, WU C, ZHANG M, NIU X, YANG Y. An ensemble method based on selection using bat algorithm for intrusion detection [J]. The Computer Journal, 2018, 61(4): 526-538. DOI: 10.1093/comjnl/bxx101.
[39] VINUTHA H P, POORNIMA B. An ensemble classifier approach on different feature selection methods for intrusion detection [J]. Information Systems Design and Intelligent Applications, 2018, 672: 442-451. DOI: 10.1007/978-981- 10-7512-4_44.
(Edited by YANG Hua)
���ĵ���
����ͨ���������ּ���ģ��ʨ�ӱ�Ҷ˹ϵͳ
ժҪ������ͨ������(WCNs)��һ����Ҫ����������ӵ�����ٵ���Դ����͵����˸߰�ȫ�Ե���в�����ּ��ϵͳ(IDS)��һ�ַ��ֺͼ����ķ����������һ���������ּ���ģ��ʨ�ӱ�Ҷ˹ϵͳ(FLBS)�����ȣ�����ģ�������㷨�����ݼ����о��ࡣ�����ر�Ҷ˹��������ʨ���Ż��㷨���ϣ������µ�ʨ�����ر�Ҷ˹(LNB)��ʵ�ָ��ʲ�ȵ��������ɡ�Ȼ��LNBģ��Ӧ����ÿ�������飬���ɾۺ����ݡ������ɾۼ����ݺ�LNBģ��Ӧ���ھۺ����ݣ������ں�����ʺ������쳣�ڵ����ʶ������KDD CUP 99���ݶ��������FLBSϵͳ�����ܽ������ۣ��������е�����ָ�ꡢȷ�Ժʹ��������(FAR)���бȽϷ�����ʵ������������ϵͳ�����������ܣ�˵���˸�ϵͳ�����ּ���е���Ч�ԡ�
�ؼ��ʣ����ּ�⣻����ͨ�����磻ģ�����ࣻ���ر�Ҷ˹��������ʨ�����ر�Ҷ˹ϵͳ
Received date: 2018-06-22; Accepted date: 2019-09-11
Corresponding author: NARENDRASINH B Gohil, Assistant Professor; E-mail: nbgohil1@gmail.com; ORCID: 0000-0003-4885-5844
Abstract: An important problem in wireless communication networks (WCNs) is that they have a minimum number of resources, which leads to high-security threats. An approach to find and detect the attacks is the intrusion detection system (IDS). In this paper, the fuzzy lion Bayes system (FLBS) is proposed for intrusion detection mechanism. Initially, the data set is grouped into a number of clusters by the fuzzy clustering algorithm. Here, the Naive Bayes classifier is integrated with the lion optimization algorithm and the new lion naive Bayes (LNB) is created for optimally generating the probability measures. Then, the LNB model is applied to each data group, and the aggregated data is generated. After generating the aggregated data, the LNB model is applied to the aggregated data, and the abnormal nodes are identified based on the posterior probability function. The performance of the proposed FLBS system is evaluated using the KDD Cup 99 data and the comparative analysis is performed by the existing methods for the evaluation metrics accuracy and false acceptance rate (FAR). From the experimental results, it can be shown that the proposed system has the maximum performance, which shows the effectiveness of the proposed system in the intrusion detection.
