
Trans. Nonferrous Met. Soc. China 26(2016) 2019-2028
Variation in pore distribution along sample length in sintered 7xxx aluminum alloy
Xi-ni YUAN1,2,3, S. M. AMINOSSADATI3, M. QIAN3
1. Research Institute, Baoshan Iron & Steel Co., Ltd., Shanghai 201900, China;
2. State Key Laboratory of Development and Application Technology of Automotive Steels (BaoSteel), Shanghai 201900, China;
3. School of Mechanical and Mining Engineering, the University of Queensland, Queensland 4072, Australia
Received 10 September 2015; accepted 18 April 2016
Abstract:
An experimental and computational fluid dynamics (CFD) numerical study of the sintering of an Al-7Zn-2.5Mg-1Cu alloy in flowing nitrogen was presented. Three rectangular bars with dimensions of 56 mm �� 10 mm �� 4.5 mm each, equally spaced 2 or 10 mm apart, were sintered in one batch at 620 ��C for 40 min in a tube furnace. The pore distribution in the selected cross section of sintered samples was found to be dependent on the sample separation distance and the distance from the cross section examined to the sample end. A three-dimensional (3D) CFD model was developed to investigate the nitrogen gas behavior near each sintering surface of the three samples during isothermal sintering. The variation in porosity in the cross section of each sintered sample along sample length was found to be closely related to the nitrogen gas flow field near the sintering surfaces.
Key words:
aluminum alloy; sintering; pore distribution; nitrogen; computational fluid dynamics (CFD) modeling;
1 Introduction
The production of automotive powder metallurgy (PM) Al parts, most notably camshaft bearing caps, started in January, 1992. They were first used in the dual- overhead cams of the GM Northstar engines in 1993 and subsequently introduced in GM��s Ecotec V-6 engines and Chrysler��s 2.7 liter V6 and Saturn four cylinder engines [1]. Since then attempts to near-net shape manufacture Al alloys and their composites by various PM approaches have been made by researchers [2-4].
Production sintering of PM Al parts generally involves an array of green compacts heated in a sintering furnace under a flowing nitrogen or nitrogen-dominant atmosphere [1]. Nitrogen is the most efficacious sintering atmosphere for Al alloys and leads to enhanced sintering due to the formation of AlN [4-6]. Since the layout of green compacts is expected to affect the local gas flow behavior, the influence may lead to different sintering responses of the compacts and therefore different sintered microstructures. Hence, it is of practical importance to understand how the nitrogen gas flow behavior may affect the sintering of the Al compacts.
Gas flow over a surface is a basic phenomenon involved in a vast variety of engineering applications, particularly in the cooling of electronic devices, heat exchangers and baking processes in food industry [7-9]. These studies indicate that the layout of specimens or objects could significantly affect the characteristics of the flow and heat transfer. In the PM field, sintering atmosphere has also been reported to play significant roles in some sintering systems [10,11]. Several researchers [12,13] developed CFD models to investigate the temperature distribution and the composition profile of the sintering atmosphere over each zone of a continuous sintering furnace. However, few studies have linked the gas flow behavior with the sintering responses of the compacts.
YUAN et al [14-16] have recently applied CFD modeling to the sintering of three aluminum rectangular bars in flowing nitrogen. It was shown that the sintering response of each sample was closely related to the nitrogen flow field around the samples. For instance, a large number of pores tended to form on the sample surface, due to the oxygen content in local sintering atmosphere and the evaporation of magnesium and zinc from surface [15]. Further, because the sintering gas flow behaviors around different surfaces were different, the pore distribution in samples was also expected to be varied. As a supplement to our previous study, this work focuses on the variation in pore distributions in three sintered aluminum rectangular bars equally spaced 2 or 10 mm apart. In addition to the experimental investigation, the same array of rectangular bars will then be considered numerically in a 3D flow regime to examine the relation between flow behavior and pore distribution in each sample.
2 Experimental
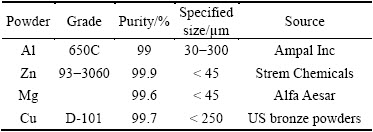
A 7xxx aluminum alloy, Al-7Zn-2.5Mg-1Cu (mass fraction, %), was prepared from elemental powder blends (Table 1) with an addition of 1% Acrawax C as a lubricant. After being mixed in a Turbula mixer for 30 min, the powder blend was compacted uniaxially at 200 MPa into rectangular samples. ~7 g of each sample measured with dimensions of ~56 mm��10 mm�� 4.5 mm was weighed.
Table 1 Powder characteristics
The samples were sintered in a stainless steel tube furnace of 160 mm inner diameter. Nitrogen with >99.5% purity and <100��10-6 of oxygen was used throughout each sintering cycle at a flow rate of 6 L/min. Three rectangular samples were placed parallel to each other in the furnace hot zone, separated 2 mm or 10 mm apart, with the long axis perpendicular to the incoming gas flow direction. They were first delubricated at 633 K for 40 min and then heated to 893 K for 40 min of isothermal sintering, followed by furnace cooling to 473 K. Metallographic samples were cut through selected cross sections of each sintered rectangular bar. They were ground, polished and examined in the unetched state using a Polyvar optical microscope.
3 Numerical analysis
3.1 Model description
The numerical model was developed using ANSYS CFX 13.0. Figure 1 shows schematically the 3D computational domain used. Three equally spaced identical bars are centered in a semi-tubular channel to simulate their sintering in the hot zone of a furnace. The dimensions of the domain (furnace hot zone) are D=160 mm, H=100 mm, W=154.9 mm, l=300 mm, li =l0. Each bar has the dimensions of w=56 mm, h=10 mm and s=4.5 mm, equally spaced by d=2 mm or 10 mm.
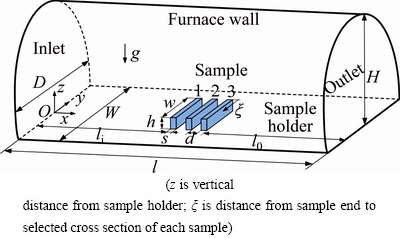
Fig. 1 Schematic diagram of computational domain (furnace hot zone) containing three equally spaced samples
The underlying assumptions are: 1) the nitrogen gas flow is steady, incompressible and laminar with a Reynolds number of 8 [14]; 2) the temperature in the computational domain is uniform, corresponding to the negligible variation in the temperature of real furnace hot zone; 3) the samples are treated being non-porous due to their high green density (~93% of theoretical density); 4) the density (��) and dynamic viscosity (��) of the nitrogen gas at 893 K are taken as 0.3743 kg/m3 and 3.753��10-5 Pa��s, respectively [17].
The nitrogen gas is assumed to enter the channel with a uniform velocity (ui) and has the same temperature (Ti) as the channel wall. The no-slip condition is taken into account on both channel walls and sample surfaces. The non-dimensional governing equations for this 3D steady flow can be expressed as follows:
Continuity equation:
 (1)
(1)
Momentum equation:

 (2)
(2)

 (3)
(3)

 (4)
(4)
All of the variables and parameters involved have been non-dimensionalized based on the following definition:


 (5)
(5)
The non-dimensional boundary conditions are given as follows:
At the inlet, UX =1, UY =0, UZ =0
At the outlet,  , UY=0, UZ =0
Along the channel walls and sample surfaces, UX =0, UY =0, UZ =0
3.2 Grid independence study
To determine an appropriate grid size, a systematic grid independence study was carried out. Figure 2 shows the mass flow rate through the top opening between Sample 1 and Sample 2 (see Fig. 1) , separated 10 mm apart, with respect to six different grid sizes. The grid with 924342 elements was adopted for all simulations which ensured an accurate analysis and a reasonable computational runtime. Convergence was assumed when the normalized residuals were less than 10-6.
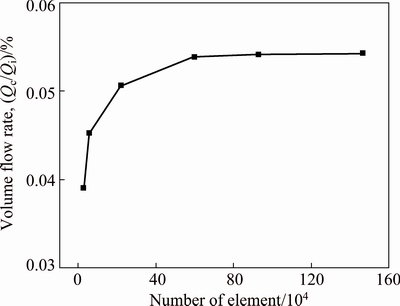
Fig. 2 Grid independence study (separation distance of sample=10 mm)
4 Results
Figures 3 and 4 show the pore distributions on five selected cross sections of each of the three sintered samples, separated 2 or 10 mm apart. The following observations are notable.
1) On the cross section, ~0.2 mm away from the sample end (Figs. 3(a) and 4(a)), each cross section was densely populated by evenly distributed pores irrespective of sample positions and their separation distance. Farther away from the sample end, the pores in the interior of each sample section largely disappeared while some subsurfaces remained porous.
2) At a sample separation distance of 2 mm, the large pores were mainly located in the subsurface regions on the cross section 0.7 mm away from the sample end (Fig. 3(b)). The outer surfaces had a thicker porous region than the inner surfaces enclosed by the blue circles. As the cross section was moved further from the sample end (��=3-28 mm), the difference in porosity between the outer and inner surfaces became more evident (Figs. 3(c)-(e)). In addition, the bottom edge and interior of each sample section was essentially free of pores.
3) At a sample separation distance of 10 mm, similar thickness of porous zones was found on all the subsurfaces on the cross section 0.7 mm and 3 mm away from the sample end (Figs. 4(b) and (c)) except for the bottom edge. When the cross sections were moved farther away from sample end (��=14 mm and 28 mm), the inner surfaces enclosed by blue circles exhibited less porosity than the outer surfaces, shown by the different thicknesses of the subsurface porous layers (Figs. 4(d)-(e)).
5 Numerical results
5.1 Flow fields around three samples on horizontal sections
Figure 5 shows the velocity profile on the mid-plane of the computational domain before the flow meets the first sample. The parabolic feature of the velocity profile indicates that the flow is fully developed prior to meeting the first sample, i.e., Sample 1 in Fig. 1. This ensured that the outer surface of Sample 1 was exposed to the same flow behavior at the two separation distances, i.e., 2 and 10 mm.
Figure 6 displays the flow fields in the vicinity of three samples on three horizontal sections (z=2, 5 and 8 mm, see Fig. 1 for the z direction). In all the cases, the streamlines exhibit a perfect fore-and-aft symmetry with respect to the centerline of the three samples, i.e., the dashed line in Fig. 6. The in-plane component of the velocity generally increases with increasing z from 2 to 8 mm. This is illustrated by the color of the streamline contours (blue to green). For the planes at z=5 mm (Figs. 6(a2) and (b2)) and z=8 mm (Fig. 6(a1) and (b1)), the streamlines are fully attached to the outer surfaces of three samples. Meanwhile, at z=2 mm (Figs. 6(a3) and (b3)), due to the generation of recirculations at the upstream of Sample 1 and downstream of Sample 3 by the flow in the streamwise direction, the flow fields differ from those observed at z= 5 and 8 mm.

Fig. 3 Pore distributions on five selected cross sections of each of three sintered samples separated 2 mm apart (The cross section of ��=28 mm corresponds to the mid-cross section. The blue circles highlight the variation in porosity in the inner surfaces along the sample length)
Despite the similarity of the flow field surrounding the outer surfaces of three samples between d=2 mm and 10 mm on the same section, the flow fields in the cavities between two adjacent samples are dependent on sample separation distance. At a separation distance of 2 mm (Figs. 6(a1)-(a3)), the absence of streamlines in the cavities between each two neighboring samples suggests that the gas is essentially stagnant in the cavities. At a separation distance of 10 mm (Figs. 6(b1)-(b3)), however, the streamlines in the cavities are an indication of recirculation in three dimensions. In particular, Figs. 6(b2) and (b3) show the recirculations generated by the side flow in the two cavities close to sample ends.
Figure 7 presents the Y (uy/ui) velocity profiles along the four selected line segments in the mid-section of two cavities. The planes of ��=28 mm and ��=0.7 mm correspond to the symmetry plane and the plane which is located 0.7 mm away from sample ends, respectively. At ��=28 mm, the values of uy/ui consistently keep constant at 0 along the cavity span irrespective of sample separation distance. This suggests that the influence of side gas flow on the mid cross-section is negligible. In contrast, for the other three line segments, increasing sample separation distance from 2 to 10 mm results in markedly increased Y (uy/ui) velocity. At a sample separation distance of 2 mm, the maximum value of uy/ui along the line segment of ��=0.7 mm in the two cavities is significantly greater than the other line segments (Fig. 7(b)). At a sample separation distance of 10 mm, the maximum value of uy/ui decreases as the distance from line segment to the sample end (��) increases.

Fig. 4 Pore distribution on five selected cross sections of each of the three sintered samples separated 10 mm apart (The cross section of ��=28 mm corresponds to the mid-cross section. The blue circles highlight the variation in porosity in the inner surfaces along the sample length)

Fig. 5 Fully developed velocity profile of gas flow before meeting the first sample (Z=z/D)
Fig. 6 Streamlines surrounding three samples on three horizontal sections
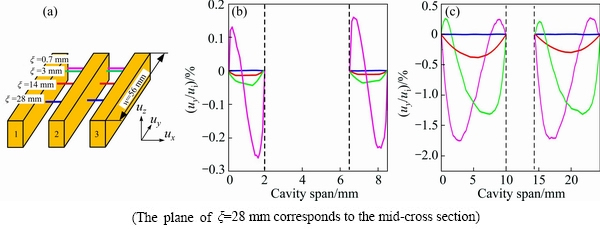
Fig. 7 Schematic diagram showing positions of four line segments across two cavities on horizontal section of z=5 mm (a), (b, c) Y (uy/ui) profiles along four line segments shown in (a) for separation distance of 2 mm and 10 mm, respectively
5.2 Flow fields around three samples on vertical sections
Figure 8 displays the streamlines surrounding three samples on four longitudinal sections. The comparison of flow fields on various sections is essential for the understanding of the variation in gas behavior along the sample length. The planes of ��=28 mm and ��=14 mm show the same flow field surrounding the three samples at both d=2 mm and 10 mm. They are also consistent with the results from 2-D modeling [14], showing the validity of 2-D approximation near the mid-cross section. It is worth mentioning that the weak strength of vortices in the upstream of Sample 1 and downstream of Sample 3 has precluded their appearance. In contrast to the sections of ��=28 mm and ��=14 mm, the two sections close to sample end (��=3 mm and ��=0.2 mm) exhibit denser streamlines at the upstream of Sample 1 and downstream of Sample 3, an indication of higher velocity at these places.
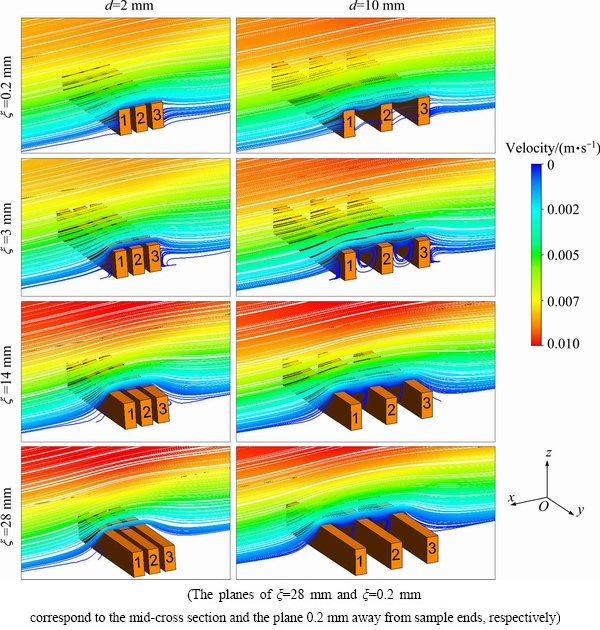
Fig. 8 Streamlines surrounding three samples on four longitudinal sections (xz planes)
Figure 9 presents the Z (uz/ui) velocity profiles along the four line segments across the two cavities shown in Fig. 7(a). At a sample separation distance of 2 mm, similar to the uy/ui velocity profile, the line segment of ��=0.7 mm shows significantly greater values of uz/ui than the other three line segments. At a sample separation distance of 10 mm, the overlapped two curves of ��=3 mm and ��=0.7 mm show slightly higher magnitude of uz/ui velocity than the overlapped curves of ��=14 mm and �� =28 mm.
6 Discussion
During the sintering of aluminum alloys the sample surfaces are often less sintered than the cores [18,19]. This is partly due to the outer layers of an aluminum compact serving as an oxygen getter for the inner zone where the oxygen partial pressure is reduced as the nitrogen gas travels from the surface to the core, leading to more effective sintering of the core [4,18,19]. In addition, the evaporation of Mg and Zn from the sintering surfaces could also contribute to formation of the surface pores [15]. Since the oxygen content in the local sintering atmosphere and the evaporation rates of Mg and Zn are closely related to the flow field [14,16], it is essential to examine the flow fields surrounding each sample surface in order to understand the variation in pore distribution in different samples.
The flow fields in Fig. 6 show that the main flow is redirected towards the sides of samples by Sample 1 on all three horizontal sections at both d=2 mm and 10 mm.

Fig. 9 (uz/ui) velocity profiles along four line segments across two cavities shown in Fig. 7(a)
As a result, the end surfaces of each sample are constantly exposed to fresh gas flow, which carries a certain amount (< 100��10-6) of O and takes away the Mg and Zn vapours. The continuous O replenishment results in inferior sintering of these surfaces. The low Mg and Zn vapour pressures facilitate further evaporation of Mg and Zn. These two aspects contribute to the formation of densely distributed pores on the surfaces close to each sample end (Figs. 3(a) and 4(a)). Meanwhile, owing to the reaction with the outer layers, the O content keeps decreasing as the gas travels through the pore network from the surface to the interior of each sample. This enables the interior of each sample to be sintered more effectively, evidenced by the markedly reduced porosity in sample core on the other cross sections (Figs. 3(b)-(e) and Figs. 4(b)-(e)).
Although no streamlines are shown in the cavity at a separation distance of 2 mm, the Y (uy/ui) velocity profile along the line segment of ��=0.7 mm in Fig. 7(b) indicates that a small amount of main flow is still able to penetrate from the side into the cavity at �� = 0.7 mm. This explains the existence of the thin porous layer on the four inner surfaces enclosed in the blue circle in Fig. 3(b) on the cross section 0.7 mm away from sample end. As the cross section is farther away from sample end, the gas velocity is minimal as shown in Fig. 7(b) and Fig. 9(a), leading to the less porous inner surfaces (Figs. 3(c)-(e)).
At a separation distance of 10 mm, Figs. 6(b2) and (b3) show that a recirculation zone is formed in each cavity close to sample end by the penetration of the side flow. These recirculation zones extend to approximately 8 mm away from sample end, which covers the inner surfaces of three samples at cross section 0.7 mm and 3 mm away from sample end. As a result of the interaction with the side flow, the O content is relatively high while the vapour pressures of Mg and Zn are relatively low within the recirculation zone. This explains the observation of the highly porous inner surface in the blue circles at those of ��=0.7 mm and 3 mm in Figs. 4(b) and (c). Figure 7(c) shows that the line segments of ��=14 mm and 28 mm have a lower gas velocity profile than ��=0.7 mm and 3 mm. In addition, the cross sections at ��=14 mm and 28 mm are outside the above-mentioned recirculation zone, indicating that the side flow has a negligible effect on the inner surfaces on these two cross sections. Therefore, the inner surfaces of three samples at ��=14 mm and 28 mm (Figs. 4(d) and (e)) show a much thinner porous region than those in Figs. 4(b) and (c).
7 Conclusions
1) The outer surfaces of the three sintered Al-7Zn-2.5Mg-1Cu samples were consistently porous on each cross section when spaced 2 mm or 10 mm apart.
2) The pore densities of inner surfaces of the three samples were dependent on the sample separation distance and the distance from the cross section examined to sample end. A separation distance of 2 mm resulted in less porosity on the inner surfaces than the separation distance of 10 mm.
3) The variation in pore densities on the inner surfaces of the three samples from sample end to center was attributed to the different oxygen contents and magnesium and zinc vapour pressures in the local sintering atmosphere, which was caused by the different gas flow fields near the sintering surfaces.
Acknowledgements
This work was supported by Ampal Inc., a member of the United States Metal Powders Group, through the CAST CRC, a Cooperative Research Centre established by the Australian Commonwealth Government.
Nomenclature
D
Diameter of furnace chamber
d
Separation distance between two adjacent samples
g
Gravitational acceleration
H
Distance from sample holder to top of furnace chamber
h
Height of sample
l
Length of furnace hot zone (computational domain)
li
Distance between furnace hot zone inlet and Sample 1
lo
Distance between Sample 3 and furnace hot zone outlet
P
Non-dimensional pressure, pD/(��ui)
p
Pressure
Re
Reynolds number, (��uiD)/��
Qc
Nitrogen volume flowrate through cavity
Qi
Nitrogen volume flowrate to computational domain
s
Thickness of sample
Ti
Isothermal sintering temperature
ui
Inlet gas velocity to computational domain
umax
Maximum gas velocity
UX
Non-dimensional velocity component in X-direction, ux/ui
ux
Velocity component in x-direction
UY
Non-dimensional velocity component in Y-direction, uy/ui
uy
Velocity component in y-direction
UZ
Non-dimensional velocity component in Z-direction, uz/ui
uz
Velocity component in z-direction
w
Width of sample
W
Width of sample holder
x
Horizontal coordinate distance
X
Non-dimensional horizontal coordinate distance, (x/D)
y
Transverse coordinate distance
Y
Non-dimensional transverse coordinate distance, (y/D)
z
Vertical coordinate distance
Z
Non-dimensional vertical coordinate distance, z/D
��
Density of nitrogen
��
Dynamic viscosity of nitrogen
��
Distance from sample end to selected cross section
References
[1] QIAN M, SCHAFFER G B. Sintering of aluminium and its alloys [C]//Sintering of Advanced Materials. Cambridge: Woodhead Publishing Limited, 2010: 289-322.
[2] OH M C, AHN B. Effect of Mg composition on sintering behaviors and mechanical properties of Al-Cu-Mg alloy [J]. Transactions of Nonferrous Metals Society of China, 2014, 24(1): 53-58.
[3] KIM J, JANG G S, KIM M S, LEE J K. Microstructure and compressive deformation of hypereutectic Al-Si-Fe based P/M alloys fabricated by spark plasma sintering [J]. Transactions of Nonferrous Metals Society of China, 2014, 24(7): 2346-2351.
[4] SCHAFFER G B, HALL B J, BONNER S J, HUO S H, SERCOMBE T B. The effect of the atmosphere and the role of pore filling on the sintering of aluminium [J]. Acta Materialia, 2006, 54(1): 131-138.
[5] OKADA T, TORIYAMA M, KANZAKI S. Direct nitridation of aluminum compacts at low temperature [J]. Journal of Materials Science, 2000, 35(12): 3105-3111.
[6] YAN M, YU P, SCHAFFER G B, QIAN M. Secondary phases and interfaces in a nitrogen-atmosphere sintered Al alloy: Transmission electron microscopy evidence for the formation of AlN during liquid phase sintering [J]. Acta Materialia, 2010, 58(17): 5667-5674.
[7] DHIMAN A K, CHHABRA R P, ESWARAN V. Flow and heat transfer across a confined square cylinder in the steady flow regime: Effect of Peclet number [J]. International Journal of Heat and Mass Transfer, 2005, 48(21-22): 4598-4614.
[8] SRIKANTH S, DHIMAN A K, BIJJAM S. Confined flow and heat transfer across a triangular cylinder in a channel [J]. International Journal of Thermal Sciences, 2010, 49(11): 2191-2200.
[9] NORTON T, SUN D W. Computational fluid dynamics (CFD)��An effective and efficient design and analysis tool for the food industry: A review [J]. Trends in Food Science & Technology, 2006, 17(11): 600-620.
[10] TIAN Zhong-liang, ZHANG Teng, LIU Kai, LAI Yan-qing, LI Jie. Effect of sintering atmosphere on composition and properties of NiFe2O4 ceramic [J]. Journal of Central South University, 2015, 22: 450-454.
[11] CHEN Duan, ZOU Zhong, TIAN Zhong-liang, XIN Peng-fei, LIU Kai, LAI Yan-qing, LI Jie. Effect of sintering atmosphere on phase composition and mechanical properties of 5Ni/(10NiO-NiFe2O4) [J]. Transactions of Nonferrous Metals Society of China, 2012, 22(1): 124-128.
[12] SAXENA N, DWYER J, HARING N, KIRSCHNER M, NAYAR H. Predicting part temperatures during sintering under production conditions using a simple PC-based mode [J]. Advances in Powder Metallurgy and Particulate Materials, 1996, 3: 43-55.
[13] STRATTON P F, GASES B. Modelling the furnace environment [C]//The 1st International Automative Heat Treating Conference, ASM International, 1999: 55-59.
[14] YUAN X N, AMINOSSADATI S M, HUO S H, SCHAFFER G B, QIAN M. The effects of sample position and gas flow pattern on the sintering of a 7xxx aluminum alloy [J]. Metallurgical and Materials Transactions A, 2012, 43(11): 4345-4355.
[15] YUAN X N, HUO S H, SCHAFFER G B, QIAN M. Distortion in a 7xxx aluminium alloy during liquid phase sintering [J]. Metallurgical and Materials Transactions A, 2014, 45(2): 1010-1018.
[16] YUAN X N, AMINOSSADATI S M, SCHAFFER G B, QIAN M. CFD modeling of the nitrogen gas flow pattern during sintering of an Al-7Zn-2.5Mg-1Cu alloy and its effect on distortion [J]. Powder Metallurgy, 2015, 58(2): 112-122.
[17] INCROPERA F P, DEWITT D P, BERGMAN T L, LAVINE A S. Fundamentals of heat and mass transfer [M]. 6th ed. New York: John Wiley & Sons, 2007.
[18] SCHAFFER G B, HALL B J. The influence of the atmosphere on the sintering of aluminium [J]. Metallurgical and Materials Transactions A, 2002, 33(10): 3279-3284.
[19] SERCOMBE T B, SCHAFFER G B. On the role of magnesium and nitrogen in the infiltration of aluminium by aluminium for rapid prototyping applications [J]. Acta Materialia, 2004, 52(10): 3019-3025.
7xxxϵ�ս����Ͻ�����Ʒ���ȵĿ�϶�ֲ��仯
Է����1,2,3, S. M. AMINOSSADATI3, M. QIAN3
1. ��ɽ�����ɷ�����˾ �о�Ժ���Ϻ� 201900��
2. �����øֿ�����Ӧ�ü��������ص�ʵ����(����)���Ϻ� 201900��
3. School of Mechanical and Mining Engineering, the University of Queensland, QLD 4072, Australia
ժ Ҫ����7xxxϵAl-7Zn-2.5Mg-1Cu�Ͻ����������������µ��ս���Ϊ����ʵ��ͼ���������ѧģ���о���3���ߴ�Ϊ56 mm �� 10 mm �� 4.5 mm�ij�����Ʒ�ڵ�������Ϊ6 L/min�Ĺ�ʽ¯��ͬһ���ν����սᣬ��Ʒ���Ϊ2��10 mm���ս��¶�Ϊ620 ��C���ս�ʱ��Ϊ40 min��ʵ�����������ս���Ʒ��ͬ�����ϵĿ�϶�ֲ�����Ʒ��༰�ý����λ���йء�ͨ��������ά������ѧģ�ͣ��о������ս������3����Ʒ��Χ�ĵ�����Ϊ�����������ÿ���ս���Ʒ����Ʒ���Ȳ�ͬ�����Ŀ�϶�ֲ����ս���渽���ĵ�������������ء�
�ؼ��ʣ����Ͻ��ս��϶�ֲ�������������������ѧģ��
(Edited by Xiang-qun LI)
Corresponding author: Xi-ni YUAN; E-mail: yuanxini@baosteel.com
DOI: 10.1016/S1003-6326(16)64320-0
Abstract: An experimental and computational fluid dynamics (CFD) numerical study of the sintering of an Al-7Zn-2.5Mg-1Cu alloy in flowing nitrogen was presented. Three rectangular bars with dimensions of 56 mm �� 10 mm �� 4.5 mm each, equally spaced 2 or 10 mm apart, were sintered in one batch at 620 ��C for 40 min in a tube furnace. The pore distribution in the selected cross section of sintered samples was found to be dependent on the sample separation distance and the distance from the cross section examined to the sample end. A three-dimensional (3D) CFD model was developed to investigate the nitrogen gas behavior near each sintering surface of the three samples during isothermal sintering. The variation in porosity in the cross section of each sintered sample along sample length was found to be closely related to the nitrogen gas flow field near the sintering surfaces.
