
J. Cent. South Univ. Technol. (2011) 18: 1263-1271
DOI: 10.1007/s11771-011-0831-2![]()
Computation and measurement for distributions of temperature and soot volume fraction in diffusion flames
ZHANG Yin-di(������), LOU Chun(¦��), XIE Ming-liang(л����),
FANG Qing-yan(������), ZHOU Huai-chun(�ܻ���)
State Key Laboratory of Coal Combustion, Huazhong University of Science and Technology, Wuhan 430074, China
? Central South University Press and Springer-Verlag Berlin Heidelberg 2011
Abstract:
A combined computational and experimental investigation to examine temperature and soot volume fraction in coflow ethylene-air diffusion flames was presented. A numerical simulation was conducted by using a relatively detailed gas-phase chemistry and complex thermal and transport properties coupled with a semi-empirical two-equation soot model. Thermal radiation was calculated using the discrete ordinates method. An image processing technique and a decoupled reconstruction method were used to simultaneously measure the distributions of temperature and soot volume fraction. The results show that the maximum error for temperature does not exceed 10% between the prediction and the measurement. And the maximum error is 6.9% for soot volume fraction between prediction and measurement. Additional simulations were performed to explore the effects of global equivalence ratio on diffusion flames and the soot formation. The results display that the soot formation increases with decreasing the coflow air velocity. And the soot formation in each case appears in the annular region, where the temperature ranges from about 1 000 K to 2 000 K and the profile becomes taller and wider when the coflow air is decreased.
Key words:
temperature; soot volume fraction; simulation; measurement; diffusion flame��
1 Introduction
Soot formation is an active field in many areas of combustion research. This is not only because it remains a challenge for fundamental research, but also because the combustion-generated soot particles have adverse health and environmental effects. Soot formation is also directly related to flame radiation and heat transfer properties, particulate emission from combustion systems and combustion efficiency [1]. Therefore, it is critical to understand the physical and chemical mechanisms about soot formation, and make it possible to control the processes of soot nucleation, surface growth, and oxidation.
Many researchers have devoted to accurately investigating the distributions of soot temperature and volume fraction in flames. The non-intrusive in-situ optical diagnostic methods [2-3] have been conducted to measure the soot temperature and volume fraction in flames. In this technique, integral values of soot emission are directly measured, and then an inversion method is needed to reconstruct the local values of soot temperature and volume fraction in non-uniform fields from measured data. SNELLING et al [1] have developed a multi-wavelength flame emission technique for high spatial resolution determination in axisymmetric laminar diffusion flames. Recently, the flame image processing techniques in the visible region have been used as effective tools for temperature measurement and combustion diagnostics [4-7]. For simultaneous estimation of non-uniform temperature and soot volume fraction distributions, AI and ZHOU [8] have proposed an emission method, in which a simultaneous estimating procedure was carried out from the spectral radiative intensities with a Newton-type iteration algorithm and the least-square method.
As emissions legislation becomes more restrictive, a detailed understanding of pollutant formation in flames will become even more critical for the design of pollutant abatement strategies and for the preservation of the competitiveness of combustion-related industries [9]. Therefore, increasing research interest focuses on the numerical modeling of coflow diffusion flames because these flames allow relatively simple calculations of detailed gas-phase chemistry coupled with a simplified soot formation model and different treatments of radiation heat transfer [10-13]. And the computation results can be compared with the optical measurement results for mutual authentication. Simulation research efforts explore the formation mechanisms of combustion-generated soot and the effects of various physical factors (gravity, pressure, co-flow air velocity, partial premixing, burner arrangement, etc) on soot. However, the investigations of experiment and computation for soot formation were often independent. Therefore, there is a desire to combine a computational and experimental investigation to examine the interrelationship of soot temperature and soot formation. In addition, it is a lack of adequate numerical studies on the effect of global equivalence ratio on flame configuration and soot formation in axisymmetric coflow diffusion flames.
In this work, a numerical simulation and an optical measurement method were combined to explore the flame structure and soot volume fraction. A numerical study of soot formation was conducted in an axisymmetric laminar diffusion ethylene flame using detailed gas-phase chemistry coupled with complex thermal and transport properties. A simple two-equation soot model was employed to predict soot formation. Radiation heat transfer by both soot and radiating gases was calculated using the discrete-ordinates method coupled with a statistical narrow-band correlated-K based band model. The image processing techniques and decoupled reconstruction method would be used to simultaneously measure the distributions of soot temperature and volume fraction under the same conditions. After calibration, a CCD camera with a filter in visible range was used to capture monochromatic radiative intensity images with different and close wavelengths. A decoupled reconstruction method was used to reconstruct the distributions of soot volume fraction and temperature. Additional simulations were performed to investigate the effects of the global equivalence ratio on the flame structure and soot formation in a laminar coflow ethylene/air diffusion flame at atmospheric pressure under three coflow air velocities.
2 Computational methodology
The flame configuration studied is an axisymmetric laminar coflow ethylene/air diffusion flame, and the simulation is carried out in a 6 cm (r)��16 cm (z) two- dimensional rectangular domain, as shown in Fig 1. The fuel (ethylene) flows from a tube having an inner diameter of 10.9 mm, with the velocity and temperature being 1.9 cm/s and 294 K, respectively. The oxidizer (air) is delivered through the annulus between the fuel tube and the air tube having an inner diameter of 100 mm, with a velocity of 65.93 cm/s at room temperature and atmospheric condition. The global equivalence ratio (��) at the inlet is 0.01. The wall thickness of fuel tube is 0.95 mm.
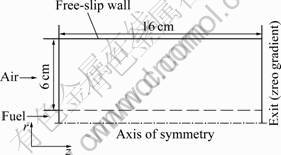
Fig.1 Computational configuration and boundary conditions
2.1 Governing equations
The fully coupled elliptic conservation equations for the conservation of mass, momentum, energy and chemical species in axisymmetric cylindrical coordinates (r, z) are given in Refs.[10-12].
Continuity:
![]() (1)
(1)
Momentum:
![]()
![]()
![]() (2a)
(2a)
![]()
![]() (2b)
(2b)
Energy:
![]()
![]() (3)
(3)
Chemical species:
![]()
![]() (4)
(4)
State equation:
 (5)
(5)
where u and v are the velocities in axial (z) and radial (r) directions, respectively; T is the temperature of the mixture; �� is the density of the mixture; Wk is the relative molecular mass of the k-th species; �� is the mixture thermal conductivity; cp is the specific heat of the mixture under constant pressure; cp,k is the specific heat of the k-th species under constant pressure; ��k is mole production rate of the k-th species per unit volume. hk denotes the specific enthalpy of the k-th species; gz is the gravitational acceleration in the axial (z) direction; �� is the viscosity of the mixture; Yk is the mass fraction of the k-th species; Vk,r and Vk,z are the diffusion velocities of the k-th species in r and z directions; K is the total species number. The quantities with subscript K+1 correspond to those of soot. The set of governing equations was closed by the ideal gas state equation. The last term on the right-hand side of Eq.(3), qr, is the source term due to radiation heat transfer. It is obtained by the discrete ordinate method coupled with statistical narrowband correlated-K (SNBCK) based wide band model for the properties of CO, CO2 and H2O [10].
The species diffusion velocity consists of three terms: ordinary diffusion, thermal diffusion and correction diffusion velocities, i.e.
![]() (6a)
(6a)
![]() (6b)
(6b)
where VT,k,r and VT,k,z are the thermal diffusions in the r and z direction for the k-th species, respectively; Vc,r and Vc,z are the correction diffusion velocities used to ensure that the net diffusive flux of all gas species and soot is zero in the r and z direction. In the current simulation, only the thermal diffusion velocities of the H2 and H species are accounted for by Ref.[14]
![]() (7a)
(7a)
![]() (7b)
(7b)
While those of all other gas species are set as zero.
Quantity Dk is related to the binary diffusion coefficients through the relation:
 (8)
(8)
where ��k is the thermal diffusion ratio of the k-th species, Xk is the mole fraction of the k-th species and Djk is the binary diffusion coefficient.
2.2 Semi-empirical two-equation soot formulation
In the present study, a modified version of the semi- empirical two-equation formulation of soot kinetics proposed by LENUG et al [15] was employed using an acetylene-based semi-empirical to model soot nucleation, surface growth and oxidation. In this simplified soot nucleation and growth model, it was assumed that acetylene was the only soot nucleation and growth species and soot nucleation and surface growth proceeded respectively via
C2H2?2C(S)+H2
and
C2H2+nC(S)?(n+2)C(S)+H2
The rates of nucleation and surface growth are given as
R1=k1(T)[C2H2]
R2=![]()
where As=��(6/��)2/3��C(S)-2/3Y2/3��N1/3, is the soot surface area per unit volume and [C2H2] is the mole concentration of acetylene. The nucleation and growth rate constants used in the present calculations are taken from a previous study [11]. k1=103?exp(-16 103/T) and k2=1 750?exp(-10 064/T). The density of soot rC(S) is assumed to be 1.9 g/cm3. It is noted that the soot surface growth rate is assumed here to be proportional to the square root of the soot surface area based on the recommendation of LEUNG et al [15]. Soot oxidation is assumed to proceed through the following reactions:
O2 +0.5C(S)?CO
OH+C(S)?CO+H
O+C(S)?CO
This simplified soot model, when used in conjunction with the GRI-Mech 3.0 mechanism, has been shown to perform quite well in the prediction of coflow C2H4/air diffusion flames at atmospheric pressure [12-13]. Further details of the governing equations and soot model can be found in Refs.[10-11].
In the following simplified analysis, it is assumed that the distributions of temperature and mass fraction of C2H2 along a given streamline are independent of pressure. As such, the soot particle number density per unit mass, N, can be easily shown to be independent of pressure as well along a given streamline. Since the surface growth is the dominant process for producing soot mass, under the assumption of Model I, i.e., R2��![]() the soot mass fraction along a streamline can be written as
the soot mass fraction along a streamline can be written as
![]() (9)
(9)
where ![]() is a pressure-independent function of acetylene mass fraction
is a pressure-independent function of acetylene mass fraction ![]() soot particle number density N, and temperature only. Integration of Eq.(9) along a streamline leads to Ys��
soot particle number density N, and temperature only. Integration of Eq.(9) along a streamline leads to Ys��![]() It can then be shown that the soot volume fraction increases with pressure, based on its definition, fv=��Ys/��C(S).
It can then be shown that the soot volume fraction increases with pressure, based on its definition, fv=��Ys/��C(S).
Under the assumption of Model II, i.e., R2��As, the soot mass fraction along a streamline can be written as
![]() (10)
(10)
Integration of Eq.(10) results in Ys��Pa3. Thus, the soot volume fraction is expected to be proportional to Pa4. This simplified theoretical analysis indicates that the assumption of linear dependence of the soot surface growth rate on the soot surface area (Model II) leads to much greater pressure dependence of soot yield than the assumption of square root dependence (Model I). Clearly, these theoretical results are approximately valid only in regions not too far away from the burner exit surface. At higher locations, however, the assumptions made in this analysis, such as pressure-independent C2H2 mass fraction and temperature distributions along a streamline and negligible soot oxidation, become invalid due to different degrees of C2H2 depletion at different pressures, different degrees of temperature drop through thermal radiation heat loss, and increased soot oxidation.
2.3 Numerical scheme and boundary conditions
The computational domain covers 16 cm(z)��6 cm(r) and was divided into 333 (z)��88 (r) control volumes. Non-uniform mesh was used to save computational time while resolving the large gradients. Very fine grids were placed in the r-direction (resolution of 0.2 mm up to r = 0.8 cm) and near the burner exit in the z-direction (resolution of 0.5 mm up to z=8 cm). It has been checked that further refinement of the mesh has negligible effect on the results. In Ref.[11], a parabolic profile was assumed for the inlet fuel velocity and a boundary layer profile was assumed for the air stream velocity. The inlet temperatures for fuel and air were both assumed to be 300 K. Symmetry, free-slip and zero-gradient conditions were enforced at the centerline, outer radial boundary and the exit boundary, respectively.
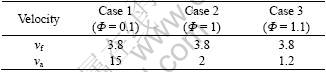
The governing equations were discretized using the control volume method. The SIMPLE numerical scheme was used to deal with the pressure and velocity coupling. The diffusion and convective terms in the conservation equations were discretized by the central and upwind difference methods, respectively. The discretized equations of gas species, soot mass fraction and soot number density were solved in a fully-coupled fashion on every grid to speed up the convergence process, while those of momentum, energy and pressure correction were solved using the TDMA method. The source term in the energy equation due to the nongray radiative heat transfer by soot and gaseous species H2O, CO2 and CO was calculated using the discrete-ordinate method in the axisymmetric cylindrical geometry described by TRUELOVE [16] along with the T3 quadrature [17] and the central difference scheme. A statistical narrow-band correlated-K based band model developed by LIU et al [10] was employed to obtain the absorption coefficients (The starting point of CK methods was that for any radiative quantity solely dependent on gas absorption coefficient (this was true for a narrow-band where the blackbody function could be treated as a constant), and the integration over wavenumber could be replaced by integration over the absorption coefficient) of H2O, CO2 and CO at each band. Based on the experimental measurement of BUCKIUS and TIEN [18], the spectral absorption coefficient of soot was assumed to be 5.5��s�� with ��s being the soot volume fraction and �� the wave-number of each spectral band. The integrated radiation intensity at each spectral band was calculated using the four-point Gauss�CLegendre quadrature scheme [19]. The spectrally integrated radiation source term was evaluated by summing up contributions from all spectral bands covering the spectral range of 150-9 300 cm-1. The chemical reaction mechanism used was essentially from GRI-Mech 3.0 [20], with the removal of all the reactions and species related to NOx formation. The revised reaction scheme consists of 36 species and 219 reactions. The conditions for which GRI-Mech 3.0 was optimized, limited primarily by availability of reliable optimization targets, are roughly 1 000-2 500 K, 1.33�� 103-1��105 Pa, and equivalence ratio from 0.1 to 5 for premixed systems [20]. All thermal and transport properties are obtained by using the database of GRI-Mech 3.0 [20]. In the present study, the axisymmetric coflow ethylene/air diffusion flames at a global equivalence ratio (��) of 0.01 was investigated using numerical simulation to be reciprocally verified with the measurement results. Additional simulation global equivalence ratios (��) among 0.1, 1.0 and 1.2 were investigated using numerical simulation to explore the influence of global equivalence ratio on flame structure and soot formation characteristics. Calculations were performed for three coflow air velocities of 15, 2, and 1.2 cm/s (see Table 1).
Table 1 Three calculation conditions for coflow diffusion flame (cm/s)
3 Experimental procedure
3.1 Experiment model
The axisymmetric sooting flame was considered as an absorbing, emitting, non-scattering, axisymmetric medium with transparent boundary and there is no externally incident radiation. As illustrated in Fig.2, the radius of flame on the cross section of measurement is Rf, and the cross section of flame is divided into N concentric ring elements. The discrete length of every concentric ring element is ��r=Rf/N. It is assumed that all the physical parameters, such as temperature and absorption coefficient, do not change within one element. A CCD camera is set on the x-axis to receive radiation intensity images from the flame. The flame is in the angular field of view of the lens. The distance between the camera and the flame centerline is LCCD. The calculating angle field is ��. Similarly, �� is also divided into M discrete angles. M can be large to, for example, 50 or 100, which depends on the resolution of the CCD camera. ��j is the included angle between x-axis and the j-th line of sight of the CCD camera.
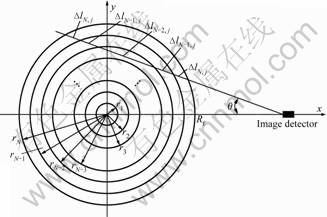
Fig.2 Geometry on cross section of axisymmetric flame
In an absorbing, emitting, and scattering enclosure, the monochromatic radiative intensity, received by the j-th line of sight of CCD camera can be expressed as
![]() (11)
(11)
where l refers to the path of the directional radiation intensity examined, Ib,�� is the monochromatic radiative intensity of blackbody with temperature of T and wavelength of ��, ���� is the spectral absorption coefficient, which is directly proportional to the soot volume fraction ��s.
Eq.(11) can be transformed into a linear matrix equation:
![]() (12)
(12)
where I�� can be measured using the image processing technique, Ib, �� represents the local blackbody radiation intensity distribution in the sooting flame, and A can be obtained from the discrete form of Eq.(11), which is related with the installation and imaging parameters of the CCD camera, and the absorption coefficient ���� of soot.
According to Rayleigh limit of the Mie theory, the soot volume fraction can be calculated from the absorption coefficient as
![]() (13)
(13)
where F(��) is a function of the real and imaginary parts of the refractive index. An inversion method was used to calculate the distributions of flame temperature and soot volume fraction from the intensity images of the monochromatic flame images [7, 21].
3.2 Experimental set-up
As shown schematically in Fig.3, the experimental set-up consists of a burner, a CCD camera, a micro-computer with a frame-grabber, and associated software. The laminar axisymmetric coflow ethylene/air diffusion flame burner at atmospheric pressure studied in this work is of similar design to that previously reported by the National Research Council of Canada [1]. The flame was generated with the burner in which pure ethylene flows through an uncooled vertical steel tube with an inner diameter of 10.9 mm and the air flows from the annular region between the fuel tube and a concentric tube with an inner diameter of 100 mm. The wall thickness of the fuel tube is 0.95 mm. The air passes through packed beds of glass beads and porous metal disks to smooth the flow and prevent flame instabilities. In addition, a flame enclosure made of flexible steel mesh protects the flame from air movements in the room. An appropriate viewing port in the mesh allows the CCD camera to capture the flame images. Two electronic mass flow controllers, with long-term accuracy within 5%, govern the flow rates. Both fuel and air are delivered at room temperature (294 K).
Radiative flame images from soot in the laminar diffusion flame were captured by the Samsung SCC- 833P CCD camera. The camera had a 1/3�� interline- transfer CCD sensor (type S-HAD) with a resolution of 752(H)��582(V) pixel elements. The electronic shutter of the camera is set as 1/5000 s. A red interferometric filter (10 nm FWHM, and 20% transmissivity) was placed between the lens and CCD sensor in order to capture monochromatic radiative images. In the experiment, two kinds of filter with different wavelength of 600 nm and 618 nm were used. By use of a frame-grabber, the video signal captured by the camera was converted into a digital image in the micro-computer. Dedicated application software developed by the authors was used to process monochromatic flame images and to calculate the distributions of soot temperature and volume fraction.
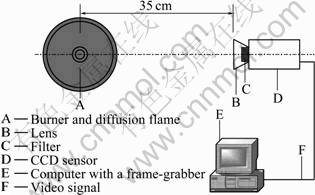
Fig.3 Burner and experiment set-up
The case of the diffusion flame is generated with air and fuel (ethylene) flow rates of 189 L/min (65.93 cm/s) and 129 mL/min (1.90 cm/s), respectively.
4 Results and discussion
The measured flame temperature distribution and radical profiles at three axial heights in the flame are compared with the calculated result in Fig.4. The peak temperature regions are clearly seen in the flame front from Figs.4(a) and (b). It is also clear that the highest temperatures in the flame do not occur in the centerline region around the flame tip (at about z=4- 4.2 cm), but in the annular region lower in the flame. Good agreement is observed not only in the qualitative (Figs.4(a) and 4(b)) but also in the quantitative (Fig.4(c)) features of the temperature, especially in the middle flame region between the experiment and the simulation. Although discrepancy between the prediction and the measurement still exists, the agreement between the prediction and the measurement is considered very good (the maximum error does not exceed 10%). The experimental result (Fig.4(a)) shows that the outer surface temperature is plunged down and the centerline temperature distribution is not uniform. The causes of these discrepancies may be attributed to: 1) the limited number of probe contact pad and 2) assumptions in processing a flame image. The predicted centerline region temperature and the peak value of temperature are higher than measurements mainly due to the effect of preheating of fuel and air, and such preheating effect is not considered. SMOOKE et al [22] argued that the difference of the prediction temperatures in the centerline region is possibly due to neglecting the radiation energy absorption by ethylene, which is also neglected in the present calculations. However, a good agreement is obtained in Fig.4(c), although there are some discrepancies. So, the prediction captures the feature of the temperature.
Figure 5 shows the comparisons of soot volume fractions for the measured and calculated distributions and the radical profiles at three heights in flame. It can be seen that the highest soot volume fraction appears in the lower annular region in the flame at about z=1.6- 3.0 cm and about r=0.2-0.3 cm. The overall distribution of soot volume fraction for calculation is similar to the measurement, although the underpredicted soot in the region of distribution and the peak value are observed. GUO et al [12] argued that the difference between the predicted and experimental data might be caused by the simplification of the soot model. It can also be seen that the soot volume fraction distribution for experiment is discontiguous. Again, this difference can be attributed to some assumptions and simplifications during experiment and calculation. The radical profiles of soot volume fraction in Fig.5(c) show a good agreement between the calculation and the measurement. From Fig.5(c), it can also be seen that the peak values of soot volume fraction for measurement and calculation are 4.98��10-6 and 4.38��10-6, respectively. The averages of soot volume fraction for measurement are higher than those for calculation, and the region for soot formation shifts to right along the radical direction in calculation. However, the maximum error between the two is 6.9%. So, the agreement between the prediction and the measurement is considered good.
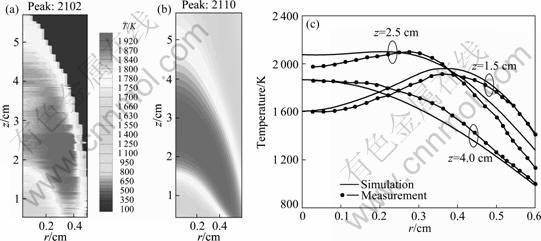
Fig.4 Comparison of temperatures for measured (a), computed (b) and radical profiles at three heights in flame (c)
The comparison profiles of temperature and soot volume fraction across the flame height at z=2.5 cm and along the flame height r=0.25 cm are shown in Fig.6. It is observed that the largest soot volume fractions occur in a temperature range of 1 000-2 000 K from Fig.6(a) and Fig.6(b). The same conclusion can be found in Refs.[10,19].
Figure 7 shows the flame temperature profiles along the flame centerline and the radical profiles at the three flame heights for three coflow air velocities. From Fig.7(a), it is observed that centerline temperature decreases (the difference is indistinct because coflow air velocities of Case 2 and Case 3 are more or less the same) with decreasing the coflow air velocity, which is primarily caused by the well mixed fuel and air. However, the maximum difference is very small (about 80 K). So, the coflow air has little effect on the temperature distribution. The predicted radial profiles of temperature in flame at three heights above the burner exit face, z=2, 5 and 7 cm, are given in Fig.7(b). Under different conditions, the flame shapes are fairly smooth, which can be found in Refs.[10-11], due to the fact that the coflow air in these cases has momentum to induce a radially inward flow in the near burner exit region. Since the flame shape is determined by the convection and diffusion processes, the change in the flame shape is associated with the variation in the velocity field. The numerical results indicate that the highest temperatures in the flames (>2 100 K) are not at the flame tips, but in the outer lower annular region in the flame at about z=6-11 cm and r=0.2-0.8 cm. The peak value of temperature is in good agreement with the experiment data by LIU et al [10-11]. Furthermore, the effects of coflow air on the flame temperature can be seen in Fig.7. From the above discussion, a conclusion may be drawn that the coflow air velocity has little influence on the temperature of flame.

Fig.5 Comparison of soot volume fractions for measured (a), computed (b) and radical profiles at three heights in flame (c)
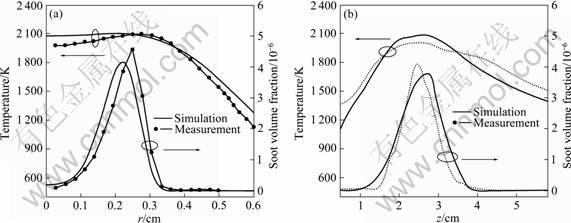
Fig.6 Comparison of profiles of temperature and soot volume fraction across flame height at z=2.5 cm (a) and along flame height at r=0.25 cm (b)
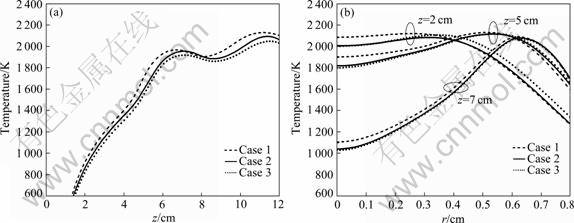
Fig.7 Comparison of profiles of temperature along flame centerline (a) and radical direction at three flame heights (b)
Figure 8 displays the profiles of soot volume fraction along the flame centerline (a) and the radical direction at the three flame heights (b) above the burner exit face, z=2.5, 4.5 and 5.5 cm for three coflow velocities. In Fig.8(a), it can be seen that the soot volume fraction increases with the coflow velocity decreasing. At z=2.5-5.5 cm, the values of soot volume fraction are increased along the flame height, then decreased in each case, and the values of soot volume fraction are in the same trend along the radical direction in Fig.8(b). So, the values of soot volume fraction in each case appear in the lower annular region in the flame and the low-temperature zone becomes taller and wider when the coflow air is decreased. In Fig.8(b), it can also be observed that the peak soot volume fraction increases from 9��10-6, to 10.8��10-6 and 11.2��10-6, as the velocity is decreased from 15, to 2.0, and 1.2 cm/s, respectively. In addition, the value and the distribution of soot volume fraction obtained by the simulation are similar to those from the experiment [23]. This is attributed to the reduced radially inward flow velocity with decreasing the coflow air velocity and the enhanced residence time. It is also worth pointing out that the peak soot volume fraction in a diffusion flame is a result of two competing processes, i.e., soot formation (nucleation and surface growth) and oxidation. Besides fuel type, soot formations are highly dependent on the fuel flow rate, flame structure, temperature field, and residence time [10-11]. The increase in the soot loading with decreasing the velocity is an indication that the residence time effect, which enhances the soot formation, plays a greater role than the radiation heat loss, which lowers the flame temperature, at a lower coflow air velocity.
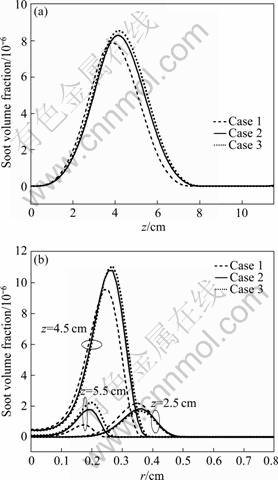
Fig.8 Comparisons of profiles of soot volume fraction along flame at r=0.3 cm (a) and radical at three flame heights (b)
5 Conclusions
1) The image processing techniques and decoupled reconstruction method were used to simultaneously measure the distributions of temperature and soot volume fraction. The results show that this diagnostic technique is reliable and useful for the combustion diagnosis.
2) A simulation under the same conditions was also performed using detailed gas-phase chemistry coupled with complex thermal and transport properties for mutual authentication to experiment results. The numerical results display that the simulation captures the main features of flame configuration and soot distribution.
3) Additional simulation results show that the soot formation increases with decreasing the coflow air velocity. And the peak value of soot formation in each case appears in the annular region.
4) The soot formation increases with the coflow air velocity decreasing due to reducing radially inward flow velocity in the smaller coflow velocity and enhancing the residence time.
Acknowledgements
Combustion Research Group, Institute for Chemical Process and Environmental Technology, National Research Council, Canada is gratefully acknowledged for help with providing the program package code.
References
[1] SNELLING D R, THOMSON K A, SMALLWOOD G J, G?LDER ? L, WECKMAN E J, FRASER R A. Spectrally resolved measurement of flame radiation to determine soot temperature and concentration [J]. AIAA Journal, 2002, 40(9): 1789-1795.
[2] LIU L H, MAN G L. Reconstruction of time-averaged temperature of non-axisymmetric turbulent unconfined sooting flame by inverse radiation analysis [J]. Journal of Quantitative Spectroscopy & Radiative Transfer, 2003, 78(2): 139-149.
[3] DE IULIIS S, BARBINI M, BENECCHI S, CIGNOLI F, ZIZAK G. Determination of the soot volume fraction in an ethylene diffusion flame by multiwavelength analysis of soot radiation [J]. Combustion and Flame, 1998, 115(1/2): 253-261.
[4] HUAND Y, YAN Y. Transient two-dimensional temperature measurement of open flames by dual-spectral image analysis [J]. IEEE Transactions of the Institute of Measurement and Control, 2000, 22(5): 371-384.
[5] LOU Chun, ZHOU Huai-chun. Deduction of the two-dimensional distribution of temperature in a cross section of a boiler furnace from images of flame radiation [J]. Combustion and Flame, 2005, 143(1/2): 97-105.
[6] ZHOU Huai-chun, HAN Shu-dong, SHENG Feng, ZHENG Chu-guang. Visualization of three-dimensional temperature distributions in a large-scale furnace via regularized reconstruction from radiative energy images: Numerical studies [J]. Journal of Quantitative Spectroscopy & Radiative Transfer, 2002, 72(4): 361-383.
[7] LOU Chun, CHEN Chen, SUN Yi-peng, ZHOU Huai-chun. Review of soot measurement in hydrocarbon-air flame [J]. Science China Technological Sciences, 2010, 53: 2129-2141.
[8] AI Yu-hua, ZHOU Huai-chun. Simulation on simultaneous estimation of non-uniform temperature and soot volume fraction distributions in axisymmetric sooting flames [J]. Journal of Quantitative Spectroscopy & Radiative Transfer, 2005, 91(1): 11-26.
[9] CONNELLY B C, LONG M B, SMOOKE M D, HALL R J, COLKET M B. Computational and experimental investigation of the interaction of soot and NO in coflow diffusion flames [J]. Proceedings of the Combustion Institute, 2009, 32(1): 777-784.
[10] LIU F, GUO H, SMALLWOOD G J, GULDER ? L. Effects of gas and soot radiation on soot formation in a two-dimensional laminar ethylene-air diffusion flame [J]. Journal of Quantitative Spectroscopy Radiative Transfer, 2002, 73(2/3/4/5): 409-421.
[11] LIU F, GUO H, SMALLWOOD G J, GULDER ? L. Numerical modelling of soot formation and oxidation in laminar coflow non-smoking and smoking ethylene diffusion flames [J]. Combustion of Theory Modeling, 2003, 7(3): 301-315.
[12] GUO H, LIU F, SMALLWOOD G J, GULDER ? L. Numerical study on the influence of hydrogen addition on soot formation in a laminar ethylene-air diffusion flame [J]. Combustion and Flame, 2006, 145(1/2): 324-338.
[13] ZHANG Yin-di, ZHOU Huai-chun, XIE Ming-liang, FANG Qing-yan, WEI Yan. Modeling of soot formation in gas burner using reduced chemical kinetics coupled with CFD code [J]. Chinese Journal of Chemical Engineering, 2010, 18(6): 142-154.
[14] KEE R J, WARNATZ J, MILLER J A. A fortran computer program package for the evaluation of gas Phase viscosities, conductivities, and diffusion coefficients [R]. Albuquerque, New Mexico: Sandia National Laboratories, 1983.
[15] LEUNG K M, LINDSTEDT R P, JONES W P. A simplified reaction mechanism for soot formation in nonpremixed flames [J]. Combustion and Flame, 1991, 87(3/4): 289-305.
[16] TRUELOVE J S. Evaluation of a multi-flux model for radiative heat transfer in cylindrical furnaces. AERE-R-9100 [R]. Harwell, UK: AERE, 1978.
[17] THURGOOD C P, POLLARD A, BECKER H A. The TN quadrature set for the discrete ordinates method [J]. Journal of Heat Transfer, 1995, 117: 1068-1070.
[18] BUCKIUS R O, TIEN C L. Infrared flame radiation. International Journal Heat and Mass Transfer, 1977, 20: 93-106.
[19] LIU F, SMALLWOOD G J, GULDER O L. Application of the statistical narrow-band correlated-K method to low-resolution spectral intensity and radiative heat transfer calculations-effects of the quadrature scheme [J]. International Journal Heat Mass Transfer, 2000, 43: 3119-3135.
[20] SMITH G P, GOLDEN D M, FRENKLACH M, MORIARTY N W, Eiteneer B, GOLDENBERG M, BOWMAN C T, HANSON R K, SONG S, GARDINER J, W C, LISSIANSKI V V, QIN Z. GRI-Mech, version 3.0 [EB/OL]. http://www.me.berkeley.edu/gri mech/, 2000.
[21] ZHOU Huai-chun, HAN Shu-dong, LOU Chun, LIU Hao. A New model of radiative image formation used in visualization of 3-D temperature distributions in large-scale furnaces [J]. Numerical Heat Transfer: Fundamental, 2002, 42(3): 243-258.
[22] SMOOKE M D, MCENALLY C S, PFEFFERLE L D, HALL R J, COLKET M B. Computational and experimental study of soot formation in a coflow, laminar diffusion flame [J]. Combustion and Flame, 1999, 117(1/2): 117-139.
[23] ZHANG J, ZHANG M C, YU J. Extended application of the moving flame front model for combustion of a carbon particle with a finite-rate homogenous reaction [J]. Energy & Fuels, 2010, 24(2): 871-879.
(Edited by YANG Bing)
Foundation item: Projects(50806024, 50806023 and 50806026) supported by the National Natural Science Foundation of China
Received date: 2010-06-12; Accepted date: 2011-01-10
Corresponding author: ZHOU Huai-chun, Professor, PhD; Tel: +86-27-87544756; E-mail: hczhou@mail.hust.edu.cn
