
Trans. Nonferrous Met. Soc. China 26(2016) 1191-1200
Microstructure evolution of Al-Zn-Mg-Cu alloy during non-linear cooling process
Hong-ying LI1,2,3, Jiao-jiao LIU1, Wei-chen YU1, Hui ZHAO1, De-wang LI1
1. School of Materials Science and Engineering, Central South University, Changsha 410083, China;
2. Key Laboratory of Nonferrous Metal Materials Science and Engineering, Ministry of Education,
Central South University, Changsha 410083, China;
3. Nonferrous Metal Oriented Advanced Structural Materials and Manufacturing Cooperative Innovation Center,
Central South University, Changsha 410083, China
Received 17 September 2015; accepted 8 January 2016
Abstract:
The microstructure evolution and properties of an Al-Zn-Mg-Cu alloy were investigated under different non-linear cooling processes from the solution temperature, combined with in-situ electrical resistivity measurements, selected area diffraction patterns (SADPs), transmission electron microscopy (TEM), and tensile tests. The relative resistivity was calculated to characterize the phase transformation of the experimental alloy during different cooling processes. The results show that at high temperatures, the microstructure evolutions change from the directional diffusion of Zn and Mg atoms to the precipitation of S phase, depending on the cooling rate. At medium temperatures, �� phase nucleates on Al3Zr dispersoids and grain boundaries under fast cooling conditions, while S phase precipitates under the slow cooling conditions. The strength and ductility of the aged alloy suffer a significant deterioration due to the heterogeneous precipitation in medium temperature range. At low temperatures, homogeneously nucleated GP zone, �ǡ� and �� phases precipitate.
Key words:
Al-Zn-Mg-Cu alloy; microstructure evolution; non-linear cooling; electrical resistivity; mechanical property;
1 Introduction
Al-Zn-Mg-Cu series alloys are widely used in aviation and aerospace industry due to their ultrahigh strength [1,2] which is always the main property desired for practical application of these alloys. The heat treatment for these alloys contains three steps: solution annealing, quenching and aging. Quenching is a key step, during which the alloy should be frozen in a supersaturated solid solution far away from thermodynamic equilibrium. Unfortunately, Al-Zn- Mg-Cu alloys are particularly prone to quench-induced precipitation, which may lead to dropping in strength after aging. Thus, the amount of the heterogeneous precipitates is critical with respect to the final mechanical properties such as yield stress, fatigue and toughness. For its practical importance, many investigations have been done on the cooling precipitation of Al-Zn-Mg-Cu alloys [3-8].
The differential scanning calorimetry (DSC) is a common method to investigate the precipitation behavior during cooling processes [8-11]. As the DSC-devices are designed only for linear scanning, most of the investigations on cooling induced precipitations are based on linear cooling. However, in practice, real components often adopt quenching methods like water- or oil-baths, (water-) spray and gas cooling. The temperature development during these quenching processes is particularly non-linear [11]. Unfortunately, the precipitation behavior under non-linear cooling remains relatively unknown, and very few relevant reports exist. MILKEREIT et al [12] have done a pioneering work in the precipitation kinetics of aluminum alloys during Newtonian cooling simulated in two DSC devices. They used DSC to achieve a stepwise linear approximation to the non-linear cooling process; however, this approximation is complex and there are still differences between the approximation curves and real cooling curves. For this reason, the challenge is to reveal the relationship between the microstructures and properties evolution of real components during non-linear cooling processes.
The electrical resistivity measurement technology has proved to be a powerful tool to characterize the precipitation behaviors of aluminum alloys during the heat treatment [3,13-16]. The electrical resistivity of the commercial Al alloy is mainly influenced by four factors. The first is the resistivity of the Al matrix, which has a linear relationship with the temperature. The second is the alloy atoms dissolved in the matrix phase, which will lead to a significant resistivity rising. Then, the resistivity of the alloy is concerned to the resistivity and volume fractions of the phases within the matrix. The last one is the scattering of conduction electrons by small precipitates/zones with a dimension near the mean free path (MFP) of the electron [17]. In the last decades, the electrical resistivity behavior of Al-Zn-Mg-Cu alloys during the heat treatment has been extensively investigated. ARCHAMBAULT and GODARD [3] have demonstrated the potential of in-situ resistivity measurement for characterizing the depletion of the solid solution. The alloy elements in aluminum matrix increasing its electrical resistivity has been measured with high precision. Hence, it is possible to estimate the mass fractions of precipitates from the specific electrical resistivity values. Furthermore, the electrical resistivity is sensitive to the precipitation of nano-scaled particles, which would cause a significant increase of resistivity [17]. However, DSC curves can hardly exhibit an obvious endothermic peak corresponding to the precipitation of these fine particles in cooling process [11]. Therefore, the in-situ electrical resistivity measurement technologies can be conveniently applied to revealing the microstructural evolution of Al-Zn- Mg-Cu alloy during non-linear continuous cooling processes. The purpose of this work is to demonstrate the microstructures and properties evolution during non-linear cooling processes based on a combination of in-situ resistivity measurements, microstructure analysis and tensile tests.
2 Experimental
The specific composition of the received AA7050 plate, provided by Aluminum Corporation of China, was 6.1% Zn, 2.15% Mg, 2.37% Cu, 0.1% Zr, 0.06% Ti, 0.09% Mn, 0.12% Si, 0.15% Fe and balance Al (mass fraction). The alloy was cast and hot rolled as a plate with 80 mm in thickness. All samples were taken at 1/4 thickness along the rolling direction with 5 mm in thickness, and then cold rolled to 1 mm. The specimens (200 mm �� 5 mm �� 1 mm) for the following tests were machined from the cold plate along the deformation direction. A K-thermocouple was welded on the specimen as a temperature sensor. The thermal cycles were performed using a laboratory-designed apparatus. As the specimens were only 1 mm in thickness and were positioned on the constant temperature zone of the furnace, the temperature variations across the samples would be neglected. A single solution annealing temperature of 743 K was used with holding time of 60 min and then the specimens were cooled following a series of non-linear cooling processes, for instance gas quenching, air-cooling and controlled cooling (the samples were cooled in different positions of thefurnace), which were labeled as C1-C11. The temperature development in different cooling processes was measured by the thermocouple and is shown inFig. 1(a). The samples suffered a typical cooling condition (C7) were chosen to investigate the microstructure evolution during the non-linear cooling procedure. The samples were cooled from the solution temperature following the C7 condition and a series of temperature points were selected to conduct water quenching. Then, these specimens were artificially aged at 393 K for 24 h (Fig. 1(b)). The as-quenched (AQ) samples were water-quenched from the solution temperature to ambient temperature. Thus, the supersaturated solid solution would be frozen in the AQ sample. The fully annealing (FA) samples were prepared using the AQ samples, which were suffered a long time high temperature annealing (t=��). The high temperature annealing was finished until the resistivity and hardness of the sample reached the minimum value and did not decrease with extending the time. In the FA sample, most of alloy atoms were out of solution.
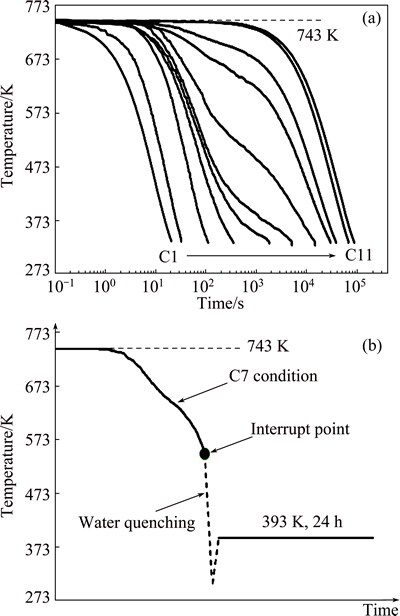
Fig. 1 Temperature developments under different cooling conditions (a) and thermal cycles (b)
In-situ resistivity measurements were acquired using a custom built rig based on the four-point probe technique and the applied current was 100 mA powered by the Agilent 6633B System DC power. The electrical resistivity signal was collected by the personal computer. Benefited from the convenient electrical resistivity measurement technology, all specimens were tested immediately after the heat treatment. Hence, the natural aging would be neglected during the electrical resistivity tests unless otherwise noted. The temperature dependence of the resistivity values of AQ samples and FA samples was measured during a rapid heating process with a rising rate of 1000 K/min (the highest heating rate for the system). This measurement was finished at 573 K and the test time lasted for only 15 s. Hence, the microstructure evolution during the rapid heating process would be minimized by the relatively low temperature and limited time. Based on the Matthiessen��s rule, the electrical resistivity values for higher temperature range (573-743 K) were determined by the linear extrapolation. The resistivity versus temperature lines for AQ and FA samples were conducted as references to analyze the electrical resistivity curves during non-linear cooling processes.
Thin foils for ransmission electron microscopy (TEM) were prepared from 3 mm discs using twin-jet electro-polishing in a 25% nitric acid/75% methanol solution at 243 K. TEM observations were performed using an FEI Tecnai G220 microscope, operating at 200 kV. The tensile samples were machined along rolling direction orientations from the quarter-plane. Tensile tests were carried on an MTS810 material testing system to evaluate the mechanical properties of the samples.
3 Results
3.1 Electrical resistivity of AQ and FA samples
The effect of solute atoms on the overall resistivity is usually well described by Matthiessen��s law [18,19]. In the Al-Zn-Mg-Cu system, the resistivity caused by different alloying atoms are additive, even when Mg and Zn are present in the ratio to form MgZn2 phase [20]. Thus, the electrical resistivity of the alloy can be expressed as follows:
 (1)
(1)
where ��M is the resistivity of the alloy, ��Al(T) is the resistivity of the pure aluminum [20],  is the resistivity contribution of atoms in solution,
  is the contribution of atoms out of solution. The average increase of resistivity per 1% of the element in solution and out of solution for AA7050 alloy is listed in Table 1.
Table 1 Effect of elements in and out of solid solution on resistivity of aluminum [20]
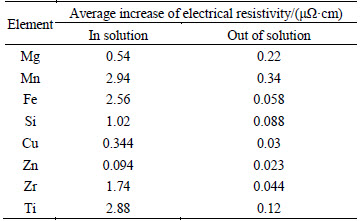
In AQ samples, most alloy elements are retained in solid solution, except for Fe and Zr atoms. Most Fe and Zr atoms are consumed in Al7Cu2Fe phase and Al3Zr dispersoids, which will not vary in solution treatment and the following cooling processes. The solid solubility of Fe and Zr in aluminum matrix is limited, which can hardly cause any significant changes in resistivity. Thus, Fe and Zr atoms are considered as out of solution. On the other hand, a part of Cu atoms are also not dissolved, which are consumed by the Al7Cu2Fe particles. The concentration of undissolved Cu atoms can be calculated by
 (2)
(2)
where M(Fe) and M(Cu) are the molar mass of Fe and Cu, respectively. Using Eqs. (1) and (2) and data listed in Table 1, the electrical resistivity value for AQ samples can be evaluated as
 (3)
(3)
The next step is the determination of the resistivity values for FA samples, in which a stable equilibrium is reached (t=��). According to phase diagrams [21], most of Mn, Fe, Si, Cu, Zr and Ti can be considered as out of solution after a long time aging. The precipitated products concern mainly the �� (MgZn2), S (Al2CuMg), T (Mg3Zn3Al2) with some Cu atoms dissolved in it and Mg2Si phases [22,23]. In the present work, the precipitation of T and Mg2Si is neglected, because DESCHAMPS et al [24] have indicated that they are either present or only present in limited amounts in commercial Al-Zn-Mg-Cu alloys. The composition of the �� phase is assumed to be fixed and the Zn/Mg mole ratio is approximated to equal 2:1. As a result, the concentrations of Zn and Mg cannot reach the equilibrium solubility at the same time for the limited Zn content in the AA7050 alloy. In a similar alloy, STARINK and LI [19] assumed that the final Zn was nearly consumed after completion of precipitation reaction, i.e., c(Zn)out(t=��)=c(Zn)in (t=0). Hereby, based on Matthiessen��s law, the electrical resistivity value for FA samples can be estimated as
 (4)
(4)
The temperature dependence of resistivity of pure aluminum (��Al(T)) is a coefficient between 273-573 K. However, this coefficient changes at higher temperatures [19]. The resistivity values of pure aluminum at high temperatures (573, 673 and 743 K) are plotted in Fig. 2, as well as their linear fitting results. Figure 2 exhibits the electrical resistivity of the AQ sample and FA sample as a function of temperature, during the rapid heating process. Whilst, the calculation results of Eqs. (3) and (4) are also plotted in Fig. 2. It can be observed that the AQ and FA lines are parallel lines with a slope of 0.010501. Moreover, the calculated results show a good agreement with the experimental data. The calculated results (solid points) show a good agreement with the experimental data. The calculation results indicate that the tested and extrapolated AQ and FA lines are accurate and precise. Thus, it is reliable to use these lines to describe temperature dependences of supersaturated solid solution and fully precipitated state.

Fig. 2 Electrical resistivity of AQ samples, FA samples and calculation results
3.2 Relative electrical resistivity curves
The AQ sample has the highest electrical resistivity value, and the phase transformation rate under this condition is considered as zero. On the other hand, the FA sample has the lowest electrical resistivity value and its phase transformation rate could be determined as 1. A parameter ��e (relative electrical resistivity) is carried out to exhibit the phase transformations in AA7050 alloy during non-linear cooling processes. The relative resistivity is defined as
 (5)
(5)
where ��AQ(T) and ��FA(T) are the resistivity values of AQ and FA samples at temperature T, respectively, and ��i(T) is the electrical resistivity value at temperature T for the sample which suffered Ci cooling condition.
The ��e of AA7050 Al alloy for different cooling processes is calculated using Eq. (5). As reported by FERRAGUT et al [25], there is a good correlation between the precipitation volume fraction and the relative changes of electrical resistivity. The evolution of ��e as a function of temperature under different cooling conditions is shown in Fig. 3. These curves can be divided into four groups. Firstly, as shown in Fig. 3(a), the C1 curve is more like a straight line in the tested temperature range. Secondly, under C2-C4 conditions, the peak values are observed in similar temperature ranges (653-673 K). Thirdly, under C5-C7 conditions, the peak values are observed in lower temperature range (393-473 K), and the temperatures corresponding to peak values increase with the decrease of the cooling rate. The last group is corresponding to the cooling conditions of C8-C11, in which the ��e value is firstly observed increasing at about 723 K, and finally closing to 1. The curves are similar with each other under these four conditions. In particular, the precipitation reactions reach an equilibrium state under extremely slow cooling conditions. Thus, the curves for C9-C11 are overlapped in the tested temperature range. In order to make a visible comparison for these curves, only C8 and C9 conditions are exhibited in Fig. 3(d). The reasons that the ��e value varying with the temperature under C2 to C11 conditions will be discussed in the following sections combined with the microstructure characterization.
3.3 Microstructure characteristics
Figure 4 displays the bright field (BF) images of AA7050 alloy suffered different cooling conditions. In the case of C1, Al3Zr dispersoids are observed which exhibit the classic lobed strain-field diffraction contrast in BF images. It is noted that no precipitates are observed nucleating on these dispersoids. However, the heterogeneous nucleating precipitates (��-MgZn2) are observed under C2 condition and the preferred nucleation sites are Al3Zr dispersoids (Fig. 4(b)). These incoherent precipitations are corresponding to the peak values of ��e curves under C2-C4 conditions, observed in medium temperature range. As shown in Fig. 4(c), coarse precipitates are observed on dispersoids, moreover, some particles without clear nucleated sites are also precipitated. The precipitation fraction increases significantly under C7 condition (Fig. 4(d)). It can be observed that some equilibrium �� particles are found to be nucleated in the matrix without any clear nucleation sites. These homogenous precipitates are corresponding to the peak values of ��e curves under C5-C7 conditions in the low temperature range. Figures 4(d) and (e) reveal that there are at least two different phases (identified with arrows). The energy diffraction spectrum (EDS) analysis results are shown in Figs. 4(h) and (i). With reference to previous phase identifications on the similar alloy, it is concluded that the plate-shaped precipitates are equilibrium MgZn2 (�� phase containing a few of Cu atoms) while the precipitates having irregular shapes should be Al2CuMg (S phase containing a few of Zn atoms) [26,27]. Figures 4(f) and (g) show the high magnification images of AA7050 alloy under C2 and C4 conditions, respectively. Clearly, the size of precipitates under C2 condition is small than 100 nm, which is close to the MFP of the electron. As a result, the ��e curve under this condition decreases continuously with the cooling extending beyond the peak. On the other hand, the sizes of precipitates under C4 condition significantly increase to 100-500 nm, which is evidently greater than the MFP. Hence, the coarsening of precipitates under C4 condition leads to the ��e curve increasing again at low temperatures.
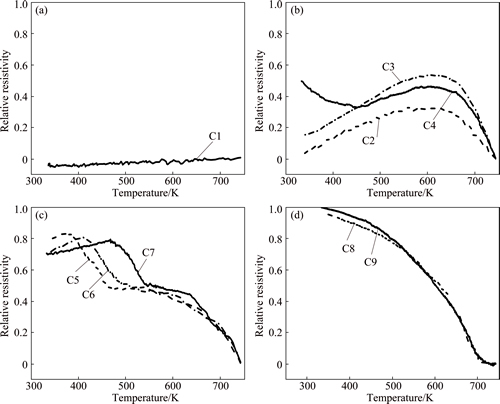
Fig. 3 ��e curves under different non-linear cooling conditions
The precipitates under C7 condition was also analyzed by selected area diffraction patterns (SADPs) and the main Al projections used are <001> and <011>. Weak diffraction spots at 1/3 and 2/3 of {220} in the <001>Al projections can be observed in Fig. 5(a), indicating that �ǡ� phase precipitates. The diffraction features of �ǡ� phase are also observed, such as weak streaks present along {111} directions in the <011>Al SADP, as shown in Fig. 5(b). However, the SADPs for samples, which were interrupted quenched at temperature higher than 453 K, have shown little diffraction features of �ǡ� phase. The fine scale �ǡ� phase might lead to the decrease of ��e value in low temperature range.
The precipitation reactions during the non-linear cooling can affect the subsequent aging process. Figure 6 exhibits the typical morphologies of aging precipitates (T6 state) at different temperatures during the cooling process of C7. The vicinity of grain boundaries which are free from coarse particles is shown in Figs. 6(a)-(d). At 743 K, continuous grain boundary precipitates are observed and grain boundaries are surrounded by a precipitation free zone (PFZ), with an average width of ~30 nm. As shown in Fig. 6(b), similar microstructures are observed at 698 K, except for coarser grain boundary precipitates. This implies that the precipitation reaction occurring in the high temperature range has slight influence on the matrix precipitation. However, the grain boundary precipitates at 598 K are relatively coarse(Fig. 6(c)), with an average length of ~50 nm and thickness of ~12 nm, even though, the PFZ is presented in a similar size. At 548 K, much coarser grain boundary precipitates are observed (Fig. 6(d)), and a well-defined PFZ with an average width of ~111 nm is observed. As seen from Fig. 6(e), GP zones are observed at 698 K. An interesting feature is that the fine-scale precipitates show a similar density and size in the temperature range of 678-743 K, even though the high temperature transformation occurs under C7 condition. However, the fine intra-granular precipitates in the material interrupting quenched at 548 K (still in T6 state) are quite different (Fig. 6(f)). The density of the fine precipitates reduces significantly at this temperature. While its size increases and more disc-platelet shaped �ǡ� precipitates are observed.

Fig. 4 Typical TEM images of AA7050 alloy under cooling conditions of C1 (a), C2 (b,f), C4 (c,g), C7 (d) and C11 (e), and EDS results of �� (h) and S (i) phases
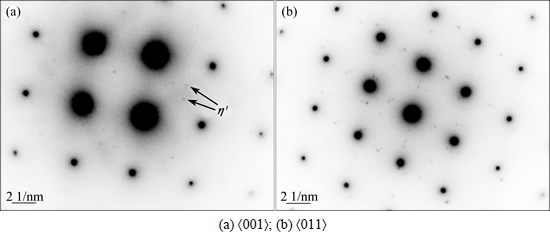
Fig. 5 SADPs of samples suffered C7 cooling process and interrupted quenching at 443 K

Fig. 6 TEM images of aging precipitates quenched at 743 K (a), 698 K (b), 598 K (c) and 548 K (d) during cooling process of C7 and subsequently aged to T6 state, and fine intra-granular precipitates quenched at 698 K (e) and 548 K (f)
3.4 Mechanical properties
Tensile tests were done after the T6 heat treatment was carried out on the materials subjected to different quenching temperatures (743, 723, 698, 648, 623, 598, 573, 548, 443 and 333 K) under C7 cooling condition. The influence of the interrupt quenching temperature on the yield strength (YS), Rp, ultimate strength (UTS), Rm, and elongation to failure, A, is illustrated in Fig. 7. The mainly strengthen mechanism for aged Al-Zn-Mg-Cu alloy is the precipitation strengthening of the fine intra- granular particles. In general, the strength and elongation decrease with decreasing the interrupting quench temperature. At 723 K, the YS and UTS reach their maximum values of 491 and 573 MPa, respectively. Then, the YS and UTS decrease with decreasing the temperature. The change of ductility with quenching temperature is less straightforward. By reducing the quenching temperature from 743 to 648 K, the elongation fluctuates around 17%. Subsequently, the ductility of the experimental alloy deteriorates rapidly in the temperature range of 623 to 573 K. The average elongation to failure decreases to 1.1% at 573 K, which implies a serious brittle fracture with hardly any plastic deformations. However, the average elongation increases to 14% at 548 K again, and then decreases with the drop of quenching temperature.
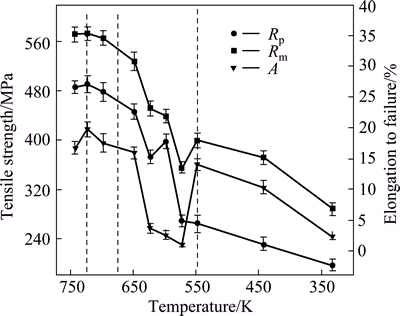
Fig. 7 Influence of interrupt quenching temperature on tensile strength and elongation to failure for T6 state material under C7 cooling condition
4 Discussion
The precipitation reactions of Al-Zn-Mg-Cu alloy during the non-linear cooling process are complicated. However, it is apparent from this study that the electrical resistivity measurement technology is a promising method to reveal the microstructure evolution during the non-linear cooling. Some interesting characterizes for ��e curves will be discussed in this section.
The turning points for curves of C8-C11 are unclear (Fig. 3(d)), where the ��e values gradually increase in a wide temperature range. Similar results were exhibited in the DSC study for linear cooling with a cooling rate of 0.005 K/s, in which an exothermal peak with a wide temperature range was observed [11]. In fact, the precipitation reactions during cooling processes are continuous (both in non-linear and linear). The S phase firstly precipitates at high temperatures, and then, as the temperature decreases, the �� phase begins to precipitate and a little of S phase also precipitates. At the ending of the cooling, the ��e values are close to 1 which means that the precipitation reactions have finished.
Things are more complicated under faster cooling conditions of C2-C7. An interesting feature is that the ��e values of C2-C7 increase immediately at the beginning of the cooling and their slopes are much higher than those under slow cooling conditions (C8-C11). This rapid increase of ��e values seems to be abnormal. As the slow diffusion velocity of Cu in Al matrix, it is impossible to precipitate enough mass fraction of S phase to cause a significant rise of ��e in a few seconds. The ��-MgZn2 phase can hardly precipitate at high temperatures (673-743 K). Moreover, as shown in Figs. 6(a) and (b), the grain boundary precipitates in the aged samples quenched at 698 K are coarser than those at 743 K, which indicates that more solution atoms have migrated into grain boundaries. Generally, the grain boundaries and interphase boundaries are locations of greater disorder and higher energy than the solid-solution matrix. If the cooling rate is slower than the critical value, the solute starts diffusion as soon as the beginning of the cooling, which is driven by the energy gradient between heterogeneous precipitation sites and Al matrix. Thus, the authors believed that the increase of ��e is attributed to the directional diffusion of solutes which can be defined as the preparation of the heterogeneous precipitation at medium temperatures. Solution atoms in the vicinity of grain boundaries and Al3Zr dispersoids move into these heterogeneous nucleating sites at high temperatures. Although no particles precipitate, the short-range solid diffusion changes the atomic configuration and solute-depleted regions formed around the grain boundaries and dispersoids. Based on the resistivity model developed by STARINK and LI [19], the total resistivity of the alloy can be considered as the result of a parallel connection for the grains and the solute depleted areas around the grain boundaries. These regions provide a channel for the conducting electrons, which should decrease the electrical resistivity of the alloy.
The average cooling rate of C4 condition is between those of C3 and C5 conditions. Consequently, its ��e curve is different from those under C2, C3 and C5-C7 conditions. Similar ��e peaks are observed under C2-C4 conditions, which implies the precipitation of �� phase on the grain boundaries and dispersoids. On the other hand, the ��e curve under C4 condition rises again at about 450 K. This implies that the �� particles without any preferred nucleation sites also precipitate under C4 condition, which do not precipitate under faster cooling conditions of C2 and C3. However, low temperature peaks as shown under C5-C7 conditions are not observed under C4 condition. This is because the limited cooling time under C4 condition is insufficient for the precipitation of �ǡ� phase at low temperatures.
A turning point was observed in the curves of C5-C7 at about 720 K, which implies the precipitation of S phase. Basically, the instantaneous cooling rate decreased with the decline of temperature during the non-linear cooling process. At the beginning of C5-C7 conditions, the cooling rate was higher than the critical value for inhibiting the precipitation of S phase, thus, a rapid rise of ��e value was observed. Then, the cooling rate was slowed down and below the critical rate, which leaded to the precipitation of S phase.
The non-linear cooling process would influence the subsequent aging process. As shown in Fig. 7, the mechanical properties of samples interrupted quenched at 723 K are even better than those of as-quenched samples, which implies that the directional diffusion of solute atoms can improve the mechanical properties. However, heterogeneous precipitation at medium temperatures increases the number of heterogeneities for the material, which would contribute to both the localization of plastic flow and the initiation and propagation of failure [28]. In the low temperature range, Al matrix was homogeneously covered with equilibrium �ǡ�/�� phases, thus, the strengthening and ductility of T6 state were improved compared with those interrupted quenching at medium temperatures.
The microstructure evolution during the non-linear cooling processes is shown in Fig. 8. For extremely fast cooling, the alloy should be frozen in a supersaturated solid solution. Under C2-C7 conditions, the solute- depleted regions are the result of short range solid diffusion, thus, it forms only at high temperatures and takes a few seconds. As the precipitation reactions continue, the solute-depleted regions will develop to PFZ. In medium temperature ranges, �� phase is nucleated on Al3Zr dispersoids and grain boundaries. The nano-metastable phases precipitated at low temperatures result in the decrease of ��e value under C2-C7 conditions.
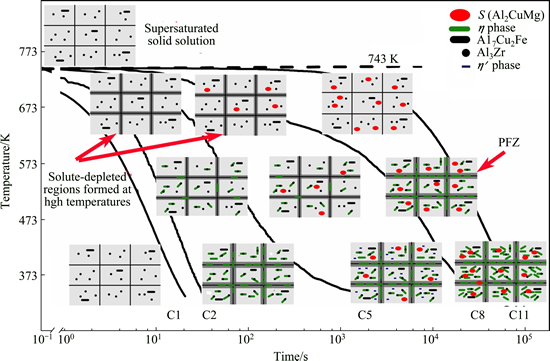
Fig. 8 Microstructure evolution of AA7050 alloy during non-linear cooling process
5 Conclusions
1) The microstructure evolution at high temperature includes three forms. Under conditions of C2-C4, the short range diffusion of Zn and Mg atoms leads to the rapid increase of ��e value. In the cases of C8-C11, the slow cooling processes result in the precipitation of S phase. The cooling processes of C5-C7 are in a kind of intermediate state that short range diffusion and precipitation of S phase will both occur at high temperature.
2) At medium temperatures, �� phase can be observed nucleating on Al3Zr dispersoids and grain boundaries. Under slow cooling conditions, S phase also precipitates. The strength and ductility of AA7050 alloy suffer a significant deterioration due to the heterogeneous precipitation at medium temperatures.
3) At lower temperatures, homogeneous �ǡ�/�� phases form under C1-C7 conditions, while no nano-metastable phases precipitate under slow cooling conditions (C8-C11) because the cooling precipitates coarsen.
References
[1] LI Pei-yue, XIONG Bai-qiang, ZHANG Yong-an, LI Zhi-hui. Temperature variation and solution treatment of high strength AA7050 [J]. Transactions Nonferrous Metals Society of China, 2012, 22(11): 546-554.
[2] ROMETSCH P A, ZHANG Y, KNIGHT S. Heat treatment of 7xxx series aluminium alloys��Some recent developments [J]. Transactions Nonferrous Metals Society of China, 2014, 24(7): 2003-2017.
[3] ARCHAMBAULT P, GODARD D. Precipitation sequences during quenching of the AA 7010 alloy [J]. Scr Mater, 2000, 42: 675�C680.
[4] ROBSON J D. Microstructural evolution in aluminium alloy 7050 during processing [J]. Mater Sci Eng A, 2004, 382: 112�C121.
[5] ROBINSON J S, TANNER D A, TRUMAN C E, PARADOWSKA A M, WIMPORY R C. The influence of quench sensitivity on residual stresses in the aluminium alloys 7010 and 7075 [J]. Mater Charact, 2012, 65: 73-85.
[6] FENG Chun, SHOU Wen-bin, LIU Hui-qun, YI Dan-qing, FENG Yao-rong. Microstructure and mechanical properties of high strength Al-Zn-Mg-Cu alloys used for oil drill pipes [J]. Transactions Nonferrous Metals Society of China, 2015, 25(11): 3515-3522.
[7] ZANG Jin-xin, ZHANG Kun, DAI Sheng-long. Precipitation behavior and properties of a new high strength Al-Zn-Mg-Cu alloy [J]. Transaction of Nonferrous Metals Society of China, 2012, 22(11): 2638-2644.
[8] DESCHAMPS A, TEXIER G, RINGEYAL S, DELFAUT-DURUT L. Influence of cooling rate on the precipitation microstructure in a medium strength Al-Zn-Mg alloy [J]. Mater Sci Eng A, 2009, 501: 133�C139.
[9] MILKEREIT B, KESSLER O, SCHICK C. Recording of continuous cooling precipitation diagrams of aluminium alloys [J]. Thermochim Acta, 2009, 492: 73�C78.
[10] MILKEREIT B, WANDERKA N, SCHICK C, KESSLER O. Continuous cooling precipitation diagrams of Al-Mg-Si alloys [J]. Mater Sci Eng A, 2012, 550: 87�C96.
[11] ZHANG Y, MILKEREIT B, KESSLER O, SCHICK C, ROMETSCH P A. Development of continuous cooling precipitation diagrams for aluminium alloys AA7150 and AA7020 [J]. J Alloy Comp, 2014, 584: 581-589.
[12] MILKEREIT B, BECK M, REICH M, KESSLER O, SCHICK C. Precipitation kinetics of an aluminium alloy during Newtonian cooling simulated in a differential scanning calorimeter [J]. Thermochim Acta, 2011, 522: 86-95.
[13] ABDALA M R W S, GARCIA de BLAS J C, BARBOSA C, ACSELRAD O. Thermoelectrical power analysis of precipitation in 6013 aluminum alloy [J]. Mater Charact, 2008, 59: 271-277.
[14] SEYEDREZAI H, GREBENNIKOV D, MASCHER P, ZUROB H S. Study of the early stages of clustering in Al-Mg-Si alloys using the electrical resistivity measurements [J]. Mater Sci Eng A, 2009, 525: 186-191.
[15] FERRAGUT R, SOMOZA A, TORRIANI I. Pre�Cprecipitation study in the 7012 Al-Zn-Mg-Cu alloy by electrical resistivity [J]. Mater Sci Eng A, 2002, 334: 1-5.
[16] RAEISINIA B, POOLE W J, LOYD D J. Examination of precipitation in the aluminum alloy AA6111 using electrical resistivity measurements [J]. Mater Sci Eng A, 2006, 420: 245-249.
[17] ROSSITER P L. The electrical resistivity of metals and alloys [M]. Cambridge: Cambridge University Press, 1987.
[18] BROWN R H, WILLEY L A. Aluminum: Properties, physical metallurgy and phase diagrams [M]. Metals Park, OH: ASM, 1967, 1.
[19] STARINK M J, LI X M. A model for the electrical conductivity of peak-aged and overaged Al-Zn-Mg-Cu alloys [J]. Metall Mater Trans A, 2003, 34: 899-911.
[20] HATCH J E. Aluminum, properties and physical metallurgy [M]. Metals Park, OH: ASM, 1984.
[21] HANSEN M, ANDERKO K. Constitution of binary alloys [M]. New York: McGraw�CHill, 1958.
[22] LI X, STARINK M J. Effect of compositional variations on characteristics of coarse intermetallic particles in overaged 7000 aluminium alloys [J]. Mater Sci Technol, 2001, 17: 1324-1328.
[23] WARNER T J, SHAHANI R A, LASSINCE P, RAYNAUD G M. Processing and modelling of advanced materials [M]. Paris: ASM, 1997.
[24] DESCHAMPS A, LIVET F, BRECHET Y. Influence of predeformation on ageing in an Al-Zn-Mg alloy��I. Microstructure evolution and mechanical properties [J]. Acta Mater, 1998, 47: 281-292.
[25] FERRAGUT R, SOMOZA A, TORRIANI I. Pre-precipitation study in the 7012 Al-Zn-Mg-Cu alloy by electrical resistivity [J]. Mater Sci Eng A, 2002, 334(1-2): 1-5.
[26] XU D K, ROMETSCH P A, BIRBILIS N. Improved solution treatment for an as�Crolled Al-Zn-Mg-Cu alloy. Part I. Characterisation of constituent particles and overheating [J]. Mater Sci Eng A, 2012, 534: 234-243.
[27] WANG S C, STARINK M J. Two types of S phase precipitates in Al-Cu-Mg alloys [J]. Acta Mater, 2007, 55(3): 933-941.
[28] DUMONT D, DESCHAMPS A, BRECHET Y. A model for predicting fracture mode and toughness in 7000 series aluminium alloys [J]. Acta Mater, 2004, 52: 2529-2540.
Al-Zn-Mg-Cu�Ͻ��ڷ�������ȴ�����е���֯�ݱ����
���Ӣ1,2,3��������1����ΰ�1���� ��1�������1
1. ���ϴ�ѧ ���Ͽ�ѧ�빤��ѧԺ����ɳ 410083��
2. ���ϴ�ѧ ��ɫ�������Ͽ�ѧ�빤�̽������ص�ʵ���ң���ɳ 410083��
3. ���ϴ�ѧ ��ɫ�����Ƚ��ṹ����������Эͬ�������ģ���ɳ 410083
ժ Ҫ������ԭλ���跨��ѡ����������(SADPs)����羵(TEM)����ѧ���ܲ����о�һ��Al-Zn-Mg-Cu�Ͻ�ӹ����¶Ⱦ���ͬ��������ȴ������ȴ�����µ���֯�����ݱ���ɣ�������Ե���ĸ���������ͬ��������ȴ�е������̡�����������ڸ��������£�������ȴ���ʵĽ��ͣ��Ͻ������֯�ݱ���Zn��Mgԭ�ӵĶ�����ɢת��ΪS��������������������ڣ��ڽϿ����ȴ�����£�����������Al3Zr��ɢ���Ӻ;������κˣ��ڽ�������ȴ�����£�S�������������κ˲����Ĵִ�ڶ������ӻᵼ�ºϽ����ѧ���ܶ��ڵ������䣬GP�����ǡ�ͦ���п��ܾ��ȵ�������
�ؼ��ʣ�Al-Zn-Mg-Cu�Ͻ���֯�ݱ䣻��������ȴ�������ʣ���ѧ����
(Edited by Mu-lan QIN)
Foundation item: Project (2014GK2013) supported by the Science and Technology Program of Hunan Province, China
Corresponding author: Hong-ying LI; Tel: +86-731-88836328; E-mail: lhying@csu.edu.cn
DOI: 10.1016/S1003-6326(16)64250-4
Abstract: The microstructure evolution and properties of an Al-Zn-Mg-Cu alloy were investigated under different non-linear cooling processes from the solution temperature, combined with in-situ electrical resistivity measurements, selected area diffraction patterns (SADPs), transmission electron microscopy (TEM), and tensile tests. The relative resistivity was calculated to characterize the phase transformation of the experimental alloy during different cooling processes. The results show that at high temperatures, the microstructure evolutions change from the directional diffusion of Zn and Mg atoms to the precipitation of S phase, depending on the cooling rate. At medium temperatures, �� phase nucleates on Al3Zr dispersoids and grain boundaries under fast cooling conditions, while S phase precipitates under the slow cooling conditions. The strength and ductility of the aged alloy suffer a significant deterioration due to the heterogeneous precipitation in medium temperature range. At low temperatures, homogeneously nucleated GP zone, �ǡ� and �� phases precipitate.
[20] HATCH J E. Aluminum, properties and physical metallurgy [M]. Metals Park, OH: ASM, 1984.
[21] HANSEN M, ANDERKO K. Constitution of binary alloys [M]. New York: McGraw�CHill, 1958.
" target="blank">[28] DUMONT D, DESCHAMPS A, BRECHET Y. A model for predicting fracture mode and toughness in 7000 series aluminium alloys [J]. Acta Mater, 2004, 52: 2529-2540.
