

Numerical simulation of tungsten alloy in powder injection molding process
ZHENG Zhen-xing(֣����)1, XIA Wei(�� ΰ)1, ZHOU Zhao-yao(����ҫ)1, ZHU Quan-li(��Ȩ��)1
School of Mechanical Engineering, South China University of Technology, Guangzhou 510460, China
Received 6 December 2007; accepted 2 June 2008
Abstract:
The flow behavior of feedstock for the tungsten alloy powder in the mold cavity was approximately described using Hele-Shaw flow model. The math model consisting of momentum equation, consecutive equation and thermo-conduction equation for describing the injection process was established. The equations are solved by the finite element/finite difference hybrid method that means dispersing the feedstock model with finite element method, resolving the model along the depth with finite difference method, and tracking the movable boundary with control volume method, then the pressure equation and energy equation can be resolved in turn. The numerical simulation of the injection process and the identification of the process parameters were realized by the Moldflow software. The results indicate that there is low temperature gradient in the cavity while the pressure and shear rate gradient are high at high flow rate. The selection of the flow rate is affected by the structure of the gate. The shear rate and the pressure near the gate can be decreased by properly widening the dimension of the gate. There is a good agreement between the process parameters obtained by the numerical simulation and the actual ones.
Key words:
powder injection molding; tungsten alloy; numerical simulation; finite element method; finite difference; control volume method;
1 Introduction
Tungsten alloy generally means the mixture of W-Ni-Fe, W-Ni-Cu and W-Cu. These kinds of alloys have many common properties, such as high density, small thermo-expansion coefficient, anti-cautery, anti-oxidation and the fine conductivity of electric and heat. In addition, the high intensity, good extension and so forth are their characteristics. Thus, these kinds of tungsten alloys have a comprehensive application in both national defense and civil industry[1].
Powder injection molding is one of the near-net forming technologies for manufacturing the tungsten alloy. The process is to inject melt feedstock into mould cavity and form the rough shape of part by cooling and solidifying. The rough part is to be sintered to remove the binder to get the fine part[2]. The traditional method for determining the process parameter is to try and correct again and again because of the complexity. The melt feedstock is a kind of non-Newtonian fluid and its flow in the channel and the mould cavity is unsteady and nonisothermal. Due to the features of PIM process, researchers have tried to solve the problem by the numeric simulation. LI et al[3-4], ZHENG et al[5], GAO et al[6], PANDELIDIS and ZOU[7], NAJMI and LEE[8] studied the optimal position for the gate using numerical simulation. PANDELIDIS and ZOU[9] went further to study the optimization of process parameters. In this work, a novel numerical simulation method was presented to simulate the injection process, through which these parameters such as pressure, temperature and distribution of flow rate can be predicted and proper parameters for the process can be determined.
2 Theoretical basis
The concentrated suspension mixture of particle/ binder of PIM is assumed to be non-Newtonian fluid. The flow can be assumed to be quasi-steady and the slip between melt and the wall of the mould cavity can be neglected. For thin part, the Hele-Shaw model can be employed for modeling the flow behavior in the mould cavity.
2.1 Flow governing equation
The basic control equations describing feedstock mold filling flow can be expressed as[10-11]

where �� is the viscosity coefficient; �� is the density; cp is the specific heat; K is the coefficient of heat conduction; t is time; �� is the fluid temperature; p is the static pressure;  is the shear rate;
  and
and  are the velocities in the direction of x and y axes, respectively; b is the half-gap thickness of cavity.

When the no-slip boundary condition is employed at the wall with a given viscosity, Eqns.(1) and (2) are easily integrated. The result is shown as Eqn.(6):

where  Flow conductance S is expressed as

Integrating Eqn.(1) across the thickness, the following equation can be obtained:

From the above equations derived, it can be concluded that the filling course in MIM is seen as the solution of a set of partial equations under the determined boundary conditions. The analytical solution is usually difficultly obtained for the complexity of the equations and the geometry model in dealing with the factual problems. Only the numerical method (such as the finite element method and finite difference method) is used to resolve it. The flow conductance S is a key parameter to couple with pressure equation and energyequation for the solution of pressure and temperature fields in the numerical simulation of injection molding.
2.2 Material models
In this work, the feedstock consists of 53% (volume fraction) W-Ni-Fe powder with a D90 size of 5 ��m and 47% (volume fraction) binder (mixture of polyethylene, wax and lubricant). Material data related to viscosity (Fig.1) were recorded at different temperatures by the Instron 3211 capillary rheometer. The objective is the identification of the mathematical models fitting material testing data to obtain accurate flow simulations.
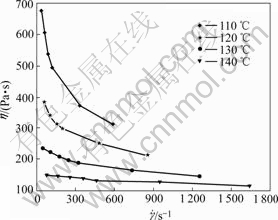
Fig.1 Curves of viscosity vs shear rate (experimental)
Cross-WLF[12] and second order[13] are two of the viscosity models available for this material. The choice between these two models was performed after analyzing data available because material behavior influenced the choice of the proper viscosity model to use for numerical simulations. The material viscosity (Fig.1) quickly declined at low shear rate and lightly declined at high shear rate. As a consequence, the Cross-WLF model was not used because it was more suitable for material with constant viscosity at low shear rates and a noticeable decline in medium-high ranges.
The second order model is shown by Eqn.(9)[11]:

where �� is the viscosity (Pa?s), while A, B, C, D, E and F are data-fitted coefficients. The coefficients were identified using a genetic algorithm (GA) approach implement in the MatLab programming environment. The coefficients fitted by GA are listed in Table 1.
Table 1 Coefficients of viscosity data fitted by GA
3 Numerical solution
In this work, the hybrid method including the finite element, the finite difference and the control volume method is adopted for the mathematic model of the filling course in MIM. According to the hybrid method, in the flowing plane, the element is discretized by FEM, while along the gapwise direction the element is discretized by finite difference method. The pressure equation and the energy equation are solved sequentially by the control volume method.
3.1 Solution of pressure field[14]
We can infer the following filling pressure, Eqn.(10), from governing Eqn.(1) and Eqn.(4):

where S is calculated by Eqn.(7).
During numerical simulation, the cavity model needs to be meshed by FEM and the pressure distribution of element can be expressed by linear interpolation. By Galerkin method, the pressure finite-element equation of every brimming node is deduced as

where l traverses all elements which include node N, and i and j mean the local node numbers in element l corresponding to the node number N in whole.  is the parameter concerned with the geometric shape of the element N.
3.2 FEM/FDM solution for temperature field[15]
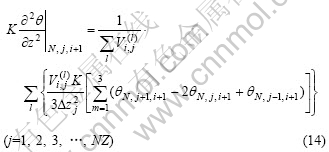
A finite difference grid, as shown in Fig.2, is mapped onto each element centroid for solving the unsteady energy equation and capturing the thickness variation of temperature. The nodal energy equation with averaged temperature evaluated at the node of each element in matrix form can be written as where [K]N is the global stiffness matrix, {Mk+1}N is the pending matrix vector such as nodal vector of temperature at time step k+1, {F}N is the force vector including the transitory, heat conduction, convection and viscous heating. Eqn.(12) can be solved for temperature field distribution.
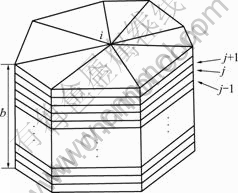
Fig.2 Illustrative finite difference along gapwise direction

Every item of Eqn.(4) is conducted as
1) Transitory item (back implicit difference):
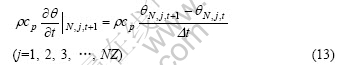
2) Heat conduction item (front implicit difference):
where N means the whole node number which corresponds to the local node number m in element l, and Z is the number obtained by even difference along the thickness direction based on the energy equation. It can be expressed as
Z=b/��z (15)
where ��z is the thickness difference.
In order to keep numerical stability, the upwind method was used to handle the convection item and viscous heat item. At each node, the effect of the convection item and viscous heat item from the last element is considered, while that of the next element is neglected.
3.3 Identification for melt flow front[16]
The filling course is complicated during which the area filled with melt gradually extends. For tracing melt flow front, the control volume is employed. To distinguish the filled nodes from melt front nodes, a fill factor fij, having a value between 0 and 1, which is associated with each element to indicate the percentage of filling, is defined by
fij=?Vij/Vi (16)
where Vi and ?Vij denote control volume and filled volume respectively of the ith vertex node at the j time step. Numerical calculation of the pressure field is based on mass conservation in each control volume which can be either empty (fij��0), partially filled (0��fij��1) or completely filled (fij=1) with feedstock. At each time step, the pressure field is calculated to obtain the velocity distribution in the flow domain.
4 Numerical simulations and experimental tests
4.1 Mesh size
In this work, the material of product (Fig.3) is W-Ni-Fe alloy. The viscosity model of the metal powder is the second order. According to the process requirement, the FE model (Fig.4), which is the two-part in one cavity geometrical model, realized by the software of Moldflow Plastic Insight Version 5.0, consists of more than 47812 tetrahedral elements with a 3D volume mesh type. The feeding system consists of one cold sprue, two cold runners with circular section and two cold taper gate with circular section (Table 2) set up according to the real size of the mold. By the second development based on the Moldflow software, the parameters of the viscosity model from Eqn.(9) can be input, by which the Moldflow software can be applied in PIM domain.
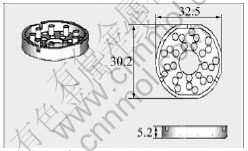
Fig.3 CAD model (unit: mm)
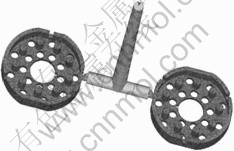
Fig.4 FEM model
Table 2 Main dimensions of feeding system
4.2 Initialization of process parameter
The initial process parameters used for both numerical simulation and experimental test are set as: 1) The velocity/pressure switch-over point is at the 99% volume filled; 2) The mold surface and feedstock melt temperature is 40 and 120 ��, respectively; 3) The screw montion was defined to carry out by the low-high-low velocity profile in order to avoid jetting. The screw diameter was equal to 38 mm. The shot size was equal to 45 mm according to the volume of product and the cushion was set to 5 mm in the packing pressure phase. In the simulation, the flow rate is set as 10 cm3/s and 20 cm3/s, respectively, so that the effect of the flow rate on the filling course can be researched.
5 Result analysis
5.1 Fill time
The FE simulation of the filling is shown in Fig.5. From Fig.5, it is shown that two cavities are filled at the same time and the shortcut does not happen, which proves that the qualified green can be ensured because of the flow balance during the filling course. From Figs.5(a) and (b), it is testified that the filling time is shortened at the high flow rate.

Fig.5 FE simulation of filling: (a) Flow rate 10 cm3/s; (b) Flow rate 20 cm3/s
5.2 Bulk temperature at end of filling
The results of bulk temperature are shown in Fig.6. The distribution of the flow front temperature is shown in Fig.7. From Figs.6 and 7, the bulk temperature and the flow front temperature gradient are low in the whole cavity at the high flow rate. This means that the quality of the product is good because non-uniform shrinkage and warpage do not occur.
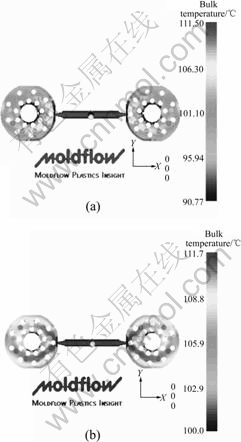
Fig.6 Bulk temperature at end of filling: (a) Flow rate 10 cm3/s; (b) Flow rate 20 cm3/s

Fig.7 Temperature gradient at flow front: (a) Flow rate 10 cm3/s; (b) Flow rate 20 cm3/s
5.3 Pressure field and shear rate
The distributions of the pressure and the shear rate at the end of filling are shown in Figs.8 and 9, respectively. From Figs.8 and 9, it can be seen that at high flow rate, the distributions of the pressure and the shear rate in the end of fill are more uneven. The gradient of the pressure and the shear rate is the highest at the place between the cavity and the gate, where the separating between the powder and the binder is presented resulting in the uneven distribution of density in the green. In factual trial, the measure was adopted that the gate was widened in order to decrease the gradient of the pressure and the shear rate. The simulated results of the pressure field and the shear rate field are shown in Figs.10 and 11, respectively, after the gate was redesigned (top diameter was 4.5 mm, bottom diameter was 2.5 mm). The pressure and the shear rate at the place between the cavity and the gate are obviously lowered from Figs.10 and 11.
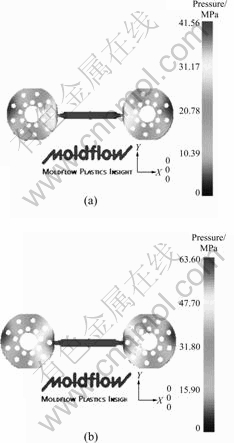
Fig.8 Pressure gradient at end of filling: (a) Flow rate 10 cm3/s; (b) Flow rate 20 cm3/s
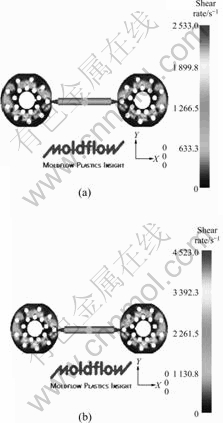
Fig.9 Shear rate gradient at end of filling: (a) Flow rate 10 cm3/s; (b) Flow rate 20 cm3/s

Fig.10 Pressure gradient (after redesigning gate)

Fig.11 Shear rate gradient in filling (after redesigning gate)
6 Experimental test
According to the parameters determined by numerical simulation, the experiment was executed for inspecting the process parameters. The qualified green part was manufactured (as shown in Fig.12) after adjusting the parameters for several times.
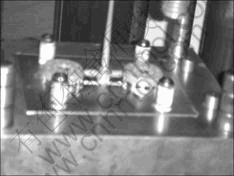
Fig.12 Molded green part (not sintered)
The pressure at injection location during the filling phases in different times is shown in Fig.13. The pressure gradient is lower before about 0.52 s for slowly filling the runners and gates, while the pressure rapidly increases between 0.52 s and 1.15 s for fast forming part. At the velocity/pressure switch point (1.15 s) the pressure becomes stable because the injection velocity ceases. After this point, the pressure slowly increases to reach the maximum value of 39.6 MPa because the pressure control is activated. The same figure reports the experimental profile recorded with a pressure meter fixed on the FC-80 Plastic-Injection-Moulding machine at the same time. The comparison of the experimental and simulated profile points out a good agreement between fabrication and FE results. Consequently, the result means that the velocity profile is correctly carried out.
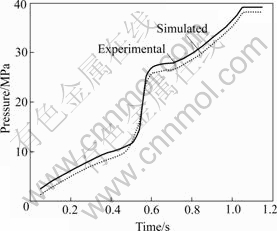
Fig.13 Pressure profiles with time
7 Conclusions
1) The flow rate has important effect on the filling course in PIM. There is low temperature gradient in the cavity while the pressure and shear rate gradient are high at the high flow rate.
2) The selection of the flow rate is affected by the structure of the gate. The experiment shows that the shear rate and the pressure near the gate can be decreased by properly widening the dimension of the gate.
3) After redesigning the gate and the determination of the process parameters (the mold surface temperature and feedstock melting point is 40 and 120 �� respectively, and the flow rate is 20 cm3/s), the distribution of the temperature, shear rate and pressure is even in the cavity and the qualified green is obtained in the experimental tests.
Acknowledgement
Special thanks to the Guangdong Provincial Key Lab for advanced metallic material processing.
References
[1] LI Peng. Present research and future development of high-density tungsten alloys [J]. Rare Metals and Cemented Carbides, 2004, 3(9): 32-35. (in Chinese)
[2] GAO Jian-xiang, QU Xuan-hui, ZHAO Sai. Newest researching situation and developing tendency of PIM [J]. Cemented Carbides, 2003, 20(3): 56-60. (in Chinese)
[3] LI Yi-min, KHALIL K A, HUANG Bai-yu. Rheological, mechanical and corrosive properties of injection molded 17-4PH stainless steel [J]. Trans Nonferrous Met Soc China, 2004, 14(5): 934-939.
[4] LI Yi-min, LIU Xiang-quan, LUO Feng-hua, YUE Jian-ling. Effects of surfactant on properties of MIM feedstock [J]. Trans Nonferrous Met Soc China, 2007, 17(1): 1-8.
[5] ZHENG Zhou-shun, QU Xuan-hui, LEI Chang-ming. Defects and variation of viscosity in powder injection molding filling process [J]. Acta Metallurgica Sinica, 2007, 43(2): 187-193. (in Chinese)
[6] GAO Jian-xiang, ZHUO Hai-yu, JIANG Man-wen. Computer simulative study of mold filling in the complicated cavity for metal powder injection molding [J]. Rare Metals and Cemented Carbides, 2006, 34(4): 11-17. (in Chinese)
[7] PANDELIDIS I, ZOU Q. Application of mold filling simulation to gate location optimization in powder injection molding [J]. Advances in Powder Metallurgy, 1991, 1: 95-101.
[8] NAJIM L A, LEE D Y. Modeling of mold filling process for powder injection molding [J]. Polymer Engineering and Science, 1991, 15(3): 1137-1148.
[9] PANDELIDIS I, ZOU Q. Optimization of injection molding design (Part II): Molding conditions optimization [J]. Polym Eng Sci, 1990, 30(5): 883-890.
[10] HIEBER C A, SHEN S F. A finite-element/finite-difference simulation of the injection-molding filling process [J]. J Non-Newtonian Fluid Mech, 1980, 7(1): 1-6.
[11] GENG Tie, LI De-qun, ZHOU Hua-min. Numerical simulation of the filling stage in injection molding based on a 3D model [J]. Journal of Harbin Institute of Technology, 2005, 12(2): 129-133. (in Chinese)
[12] JIANG Bing-yan, WANG Lin, XIE Lei, HUANG Bai-yun. Viscosity model parameters fitting of feedstock in MIM simulation and analysis [J]. The Chinese Journal of Nonferrous Metals, 2005, 15(3): 429-434. (in Chinese)
[13] BINET C, HEANEY D F, SPINA R, TRICARICO L. Experimental and numerical analysis of metal injection molded products [J]. Journal of Materials Processing Technology, 2005, 15(5): 1160-1166.
[14] ZHOU Hua-min, ZHANG Yi-sheng, LI De-qun. An improved injection molding filling simulation for 3D surface model [J]. Journal of Basic Science and Engineering, 2001, 9(1): 52-59. (in Chinese)
[15] LAM Y C, CHEN X, TAM K C. Simulation of particle migration of powder-resin system in injection molding [J]. Journal of Manufacturing Science and Engineering, 2003, 8(1): 538-547.
[16] YU Min, LUO Ying-she, PENG Xiang-hua, QIN Yin-hui. Numerical simulation and its application of rheological forming of titanium alloy vane disk [J]. Trans Nonferrous Met Soc China, 2006, 16(2): 671-675.
Foundation item: Project([2006]112) supported by the Transformation of the Scientific and Technological Achievement of the Colleges in Guangdong Province, China
Corresponding author: ZHENG Zhen-xing; Tel: +86-20-87112948; E-mail: zhengzhenxing@sina.com
(Edited by LI Xiang-qun)
Abstract: The flow behavior of feedstock for the tungsten alloy powder in the mold cavity was approximately described using Hele-Shaw flow model. The math model consisting of momentum equation, consecutive equation and thermo-conduction equation for describing the injection process was established. The equations are solved by the finite element/finite difference hybrid method that means dispersing the feedstock model with finite element method, resolving the model along the depth with finite difference method, and tracking the movable boundary with control volume method, then the pressure equation and energy equation can be resolved in turn. The numerical simulation of the injection process and the identification of the process parameters were realized by the Moldflow software. The results indicate that there is low temperature gradient in the cavity while the pressure and shear rate gradient are high at high flow rate. The selection of the flow rate is affected by the structure of the gate. The shear rate and the pressure near the gate can be decreased by properly widening the dimension of the gate. There is a good agreement between the process parameters obtained by the numerical simulation and the actual ones.
