

Laws of strata energy release and corresponding safety warning system in
metal mine
LIU Zhi-xiang, GUO Yong-le, LIU Chao, LU Jun-hua
College of Resources and Safety Engineering, Central South University, Changsha 410083, China
Received 23 June 2010; accepted 5 September 2011
Abstract:
The strata deformation in mining area was monitored in Dabaoshan copper-iron mine, and an analytical method of strata energy release was put forward. On the basis of chaotic theory, by reconstructing the phase space for time series data of strata energy release, the saturated embedding dimension and the correlation dimension of the dynamic system were obtained to be 4 and 1.212 8, respectively, and the evolution laws of distances between phase points of strata energy release in the phase space were revealed. With grey theory, a prediction model of strata energy release was set up, the maximum error of which was less than 6.7%. The results show that there are chaotic characters in strata energy release during mining; after reconstructing phase space, the subtle changing characteristics of energy release can be magnified, and the internal rules can be fully demonstrated. According to the laws, a warning system for strata stability in mining area was established to provide a technical safeguard for safe mining.
Key words:
strata energy release; phase space reconstruction; grey theory; safety warning system;
1 Introduction
In metal mining, people most concerned on the stability and damage laws of rock strata [1-2]. Usually, strata deformation in mining areas is monitored to predict the stability according to the measured data. The methods of probability and statistics are always applied in the analysis of monitoring data. KUMAR et al [3] assessed the pillar and roadway stability by probability method. TESARIK et al [4] researched the long-term stability of a backfilled room-and-pillar test section at the Buick mine with statistical method. However, the strata deformation is related to the embedding condition of ore body, earth stress, mechanical parameters of rock mass, mining depth, mining sequence, stope area, mining rate, ore output, etc. Also they are always accompanied by energy dissipation (the phenomenon was proved by RYDER [5]). Especially, under the complicated mining conditions, strata deformations and energy dissipation are often affected by the stochastic factors, and they show not only the determinacy, but also some uncertainty and randomness (chaotic phenomenon was proved by GURTUNCA et al [6] and LI et al [7]).
Therefore, strata deformation in mining area was monitored in Dabaoshan copper-iron mine of Guangdong province, China, according to its technical condition. The characteristics of strata energy release during mining were analyzed by adopting chaos theory, and the laws of strata deformation and energy dissipation were revealed. Strata energy release was accurately predicted by combining phase space reconstruction with grey theory, and a corresponding safety warning system was set up to provide a technical safeguard for safe mining.
2 Deformation monitoring of strata
The methods of sublevel open stope and regional backfill were adopted in underground deposit of Dabaoshan copper-iron mine, and deformation of roof strata in mining area was monitored to ensure safe mining. A 4-point displacement meter was installed in the prospecting line W11+2 at +1 170 m altitude level, with 4 measuring points in the drill hole, which are 5, 10, 20 and 30 m away from the orifice, respectively.
The displacement meter was installed in July, 2007. At early mining period, strata deformation was very slight, so the measuring data were taken every 10 days. Then, the deformation got larger obviously after October, 2007, and the data were taken every other day to master the details of strata deformation. The deformation amount of each measuring point divided by its length is the unit length deformation of rock strata (i.e. strain value), and the average strain of four measuring points is considered the strain of roof strata in mining area.
The strata deformation in mining area was monitored from October 10, 2007 to June 14, 2008, and the monitoring data are illustrated in Fig. 1. According to the interpolation method, the strata deformation data of each day can be obtained from the monitoring data taken every other day, so there are 248 data in all.
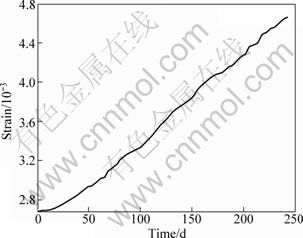
Fig. 1 Monitoring curve of strata deformation
3 Analysis of strata deformation energy
3.1 Energy release of rock strata
Consider a cuboid element of rock strata with side lengths of dx, dy and dz, respectively, and load the stress of side dx from 0 to ��x gradually, as well as suppose a deformation amount ��x is made. The elastic deformation energy dW can be calculated as
![]() (1)
(1)
The deformation energy of one unit volume is called specific energy or energy release rate [8], which is marked as U. According to Eq. (1), U is calculated as
![]() (2)
(2)
Equation (2) indicates that specific energy of strata equals numerically the area enclosed by the curve of stress and the strain axis in the stress��strain chart. The stress��strain relation of elastic rock is ��=ER��, where ER is the elastic modulus of rock. According to Eq. (2), specific energy of strata U can be obtained as
![]() (3)
(3)
3.2 Energy release of rock strata in mining area
According to the deformation result of strata in Fig. 1, the elastic modulus of rock mass ER is 5 510 MPa in Dabaoshan copper-iron mine, so the curve of strata energy release in different phases can be figured out by Eq. (3). The result is shown in Fig. 2.
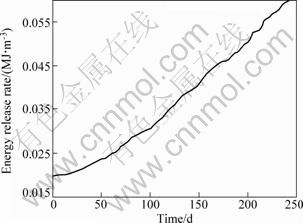
Fig. 2 Energy release rate of strata vs time in mining area
4 Chaotic laws of strata energy release
4.1 Phase space reconstruction to monitoring data of strata energy release
During the mining process, strata deformation is caused by the material and energy exchange with the outside [9], so it is a nonlinear dynamical system with energy dissipation. The laws of energy dissipation are reflected in the monitoring data of strata energy change. The monitoring data are a group of univariate time series x1, x2, ��, xn, with time interval ��t. By adopting the time interval p=��t, the phase space Xj can be reconstructed as
![]() (4)
(4)
where m is the embedding dimension of the dynamic system.
After reconstructing the phase space, these phase points form a locus in it. On the basis of embedding theorem by TAKENS [10-11], a proper embedding dimension m can be found to keep diffeomorphisms between the locus in the reconstructed phase space and the quondam dynamical system, where m��2D+1 and D is the dimension of the dynamical system which can be determined by Grassberger-Procaccia method [12].
According to the data of strata energy release (248 data, in Fig. 2), set ��t=1 and reconstruct the phase space by Eq. (4). The correlation dimension of time series of strata energy release can be calculated by Grassberger- Procaccia method, as shown in Fig. 3. Where r is the measuring scale and Cm(r) is the probability of the distance between 2 points smaller than r in N m-dimensional phase points.
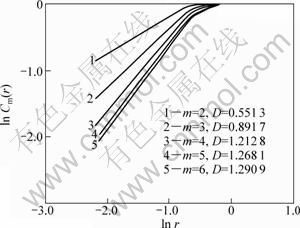
Fig. 3 Correlation dimension calculation of energy release
According to the calculation results in Fig. 3, when m��4, the correlation dimension D of the dynamical system increases little. So m=4 can be considered the saturated embedding dimension, and the corresponding correlation dimension D=1.212 8. Here, D is a fractional number, which demonstrates that strata energy release has chaotic characteristics [13-14].
4.2 Distance evolution of neighboring points of strata energy release in phase space
After the phase space of the time series is reconstructed, each phase point stands for an energy state of strata in it. Suppose point X(t1) is the nearest to X(tb1) at moment t1, the distance Z1 between them is calculated as
![]()
![]() (5)
(5)
In a similar way, at moment t2, the distance between phase point X(t2) and X(tb2) can be calculated, and is denoted as Z2. The rest may be deduced by analogy until the end of the phase space. The time series Z of distance evolution of neighboring points in phase space can be obtained as
![]() (6)
(6)
According to the monitoring data of strata energy release (Fig. 2), there are 245 4-dimension vectors (phase points) in the reconstructed phase space with saturated embedding dimension m=4. The distances between the two neighboring points by are calculated Eq. (5), from the first point to the last one. And 245 distance values are obtained, composing an array Zk by Eq. (6). The evolution curve of distances between neighboring points in time sequence of strata energy release is shown in Fig. 4.
Comparing Figs. 2 and 4, the energy release is studied on 1-dimension curve in Fig. 2, and the inherent laws are covered by cumulative energy. So it is hard to distinguish the chaotic characteristics. However, in Fig. 4, the subtle changing characteristics are magnified in four-dimension space, and the internal rules are fully demonstrated by reconstructing the phase space.

Fig. 4 Distance evolution of phase points of strata energy release
5 Grey prediction of strata energy release
The above researches show that each point in phase space stands for an energy state, so the issue of predicting strata energy release is turned into fixing the phase point position of the next moment. Grey theory can be applied in the prediction of linear, nonlinear or stochastic system [15]. In the case of relatively small quantity of data, the trend of system can be forecast on the basis of the known information. Therefore, the energy release of strata in mining area is predicted coupling phase space reconstruction with grey theory.
After the time series Z (![]() ) of distance evolution of neighboring points of strata energy release in phase space are obtained, to enforce the regularity of Z sequence, make 1-AGO to Z, and the time series Z* can be gained as
) of distance evolution of neighboring points of strata energy release in phase space are obtained, to enforce the regularity of Z sequence, make 1-AGO to Z, and the time series Z* can be gained as
![]() (7)
(7)
Using grey GM(1, 1) model, and the linear first-order differential equation of Z* about time is obtained as
![]() (8)
(8)
The general solution of differential Eq. (8) is
![]() (9)
(9)
where v and a are parameters of grey predictive equation, which can be calculated by least square method [16].
When the phase point distance is calculated, the position of phase point in reverse is figured out, and the predicted value of strata energy release can be obtained. Suppose that when t=tk, point X(tk) is the nearest to point X(tb), so the distance between X(tk) and X(tb) is calculated as
![]()
![]() (10)
(10)
In Eq. (10), parameter Zk can be derived from grey prediction, and only x(tk) is unknown. By solving the quadratic equation, the predicted value x(tk) of strata energy release can be acquired.
In Fig. 4, the first-order accumulated generation is done to Z array, and GM(1, 1) model is adopted to predict the trend of phase points. To examine the predicted results, the last 21 data do not get involved in regression analysis so that they can be used to verify the results. The grey predictive equation of cumulative distances of phase points of energy release in phase space can be obtained by Eqs. (7)-(9) as
![]() (11)
(11)
The cumulative distance of phase point was calculated by Eq. (11), the reduction treatment was made by Eq. (7), and the position of phase point was figured out by Eq. (10). The measured and predicted data of phase point distance of strata energy release between the 240th and 258th day are shown in Fig. 4.
The contrast curves of the measured and predicted data are shown in Fig. 5.
Compare the last 21 data in Fig. 5, the errors between the measured and predicted values are 0.9%, 3.2%, 4.9%, 5.1%, 2.6%, 3.8%, 2.5%, 4.6%, 0.7%, 2.9%, 1.2%, 4.5%, 2.0%, 6.1%, 4.1%, 5.8%, 1.5%, 4.2%, 6.7%, 2.8% and 0.9%, respectively. The maximum error is less than 6.7%, so the results show that the grey prediction model based on phase space reconstruction has a high precision to approach the measured data.
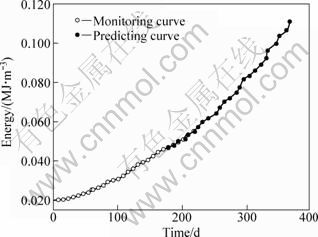
Fig. 5 Comparison between measured and predicted results of strata energy release
6 Safety warning system for strata energy release in mining area
The evolution law of distances between phase points reveals that the longer the distance is, the fiercer the strata energy release is, and the more severe the consequences are in the mining area. According to the comprehensive analysis of distance evolution of phase points of energy release in phase space, the safety classification of strata energy release is as follows: when the phase point distance Z��0.009 MJ/m3, it is red warning region (D region), in which the energy release is furious and dangerous in mining area. In this class, great pressure activities probably occur, thus, people should be evacuated. When 0.009 MJ/m3>Z��0.006 MJ/m3, it is orange warning region (C region), in which the energy release is relatively fierce. In this class, dangers are likely to come about, and the monitoring frequency should be increased to forecast in time. At the same time, some measures should be taken accordingly. When 0.006 MJ/m3 >Z��0.003 MJ/m3, it is normal energy release region (B region), in which strata is safe. In this class, the monitoring work can be done in a routine way. When Z<0.003 MJ/m3, it is little energy release region (A region). In this condition, the monitoring frequency can be properly decreased to save some personnel cost.
According to the above demarcation, the classification regions of strata energy release are illustrated in Fig. 4. In Fig. 4, the laws show that the amount of strata energy release is relatively small during 0-58 d, belonging to little energy release region (A region). During 59-109 d, the amount of strata energy release gradually increases, belonging to normal energy release region (B region). The monitoring data on days 110, 112, 152, 154, 198, 200, 202, 224 and 228 show that the amount of strata energy release is very large, belonging to orange warning region (C region). Under this circumstance, the monitoring frequency must be increased. Also, in analysis under the on-site mining condition, the early stopes are proceeding with slotting and undercutting, which have little disturbance to rock strata. With the expansion of undercutting area at the bottom of stopes, strata energy release increases. In 110-112 d, the slotting and undercutting are totally finished in stopes, and earth pressure begins to appear. For this, the mining sequence is adjusted, and strata energy release goes into the normal energy release region. With mining going along, during 152-154 d and 198-202 d, strata energy release again goes into the orange warning region. At this time, not only the monitoring times are increased, but also regional roof-contacted filling is adopted. Finally, strata energy release returns to the normal energy release region. During 224-228 d, strata energy release goes into red warning region (D region). Then, all the working people in mining area are evacuated, and both regional roof-contacted filling and local pillar keeping are adopted to control the earth pressure. Strata energy release minishes gradually into the normal energy release region.
The prediction results (Fig. 4) show that in 242-256 d, strata energy release lies in the normal energy release region, while on the 258th day, it goes into the orange warning region, for which the monitoring frequency should be increased and necessary measures should be taken.
7 Conclusions
1) Strata deformation is related to the conditions of ore-bodies, mining technology and mining sequence. With the expansion of mining area, stress transfers in surrounding rock, the concomitant deformation and energy release show chaotic characteristics.
2) The subtle changing characteristics of strata energy release are magnified and the internal laws are fully demonstrated by the method of phase space reconstruction.
3) The grey prediction model for strata energy release is established based on the chaos theory and grey GM(1, 1) model. Precise prediction of strata energy release is achieved in mining area, and the maximum error is less than 6.7%.
4) According to the characteristics that subtle changing of strata energy release is magnified in reconstructed phase space, the safety warning system for strata energy release in mining is established, which provides a technical safeguard for safe mining.
References
[1] GU De-sheng, LI Xi-bing. Modern mining science and technology for metal mineral resources [M]. Beijing: China Metallurgical Industry Press, 2006: 9-20. (in Chinese)
[2] VONGPAISAL S, LI G, PAKALNIS R. New 3D engineering curves for predicting stope stability and mining dilution in longitudinal blasthole mining operations [J]. International Journal of Mining, Reclamation and Environment, 2009, 23(2): 92-102.
[3] KUMAR P, KIRAN S, CHOUDHURY P B. Pillar and roadway stability assessment of development working of a metal mine with rock mechanics instrumentation��A case study [J]. Journal of Mines, Metals and Fuels, 2010, 58(5): 109-111.
[4] TESARIK D R, SEYMOUR J B, YANSKE T R. Long-term stability of a backfilled room-and-pillar test section at the Buick Mine, Missouri, USA [J]. International Journal of Rock Mechanics and Mining Sciences, 2009, 46(7): 1182-1196.
[5] RYDER J A. Excess shear stress in the assessment of geologically hazardous situations [J]. Journal of the South African Institute of Mining and Metallurgy, 1988, 88(1): 27-39.
[6] GURTUNCA R G, ADAMS D J. Determination of the in situ modulus of the rockmass by the use of backfill measurements [J]. Journal of the South African Institute of Mining and Metallurgy, 1991, 91(3): 81-88.
[7] LI Xi-bing, LIU Zhi-xiang. Research on grey prediction of deformation laws in backfill based on phase space reconstruction [J]. Journal of Safety and Environment, 2004, 4(6): 54-57. (in Chinese)
[8] CHENG Chang-jun, ZHU Yuan-yuan. Elastic mechanics [M]. Shanghai: Shanghai University Press, 2005: 61-87. (in Chinese)
[9] LIU Zhi-xiang, LI Xi-bing, DAI Ta-gen. On damage model of cemented tailings backfill and its match with rock mass [J]. Rock and Soil Mechanics, 2006, 27(9): 1442-1446. (in Chinese)
[10] SHAHVERDIEV E M, HASHIMOVA L H, HASHIMOVA N T. Chaos synchronization in some power systems [J]. Chaos, Solitons and Fractals, 2008, 37(3): 827-834.
[11] COWPER M R, MULGREW B, UNSWORTH C P. Nonlinear prediction of chaotic signals using a normalised radial basis function network [J]. Signal Processing, 2002, 82(5): 775-789.
[12] ALBANO A M, MUENCH J, SCHWARTZ C, MEES A I, RAPP P E. Singular-value decomposition and the Grassberger-Procaccia algorithm [J]. Phys Rev A, 1988, 38(6): 3017-3026.
[13] BRESTEN C L, JAE H J. A study on the numerical convergence of the discrete logistic map [J]. Communications in Nonlinear Science and Numerical Simulation, 2009, 14(7): 3076-3088.
[14] SHERIF J, SINGHANIA R. Extracting order from chaos [J]. Kybernetes, 2009, 38(6): 1010-1016.
[15] CAFAGNA D, GRASSI G. An effective method for detecting chaos in fractional-order systems [J]. International Journal of Bifurcation and Chaos in Applied Sciences and Engineering, 2010, 20(3): 669-678.
[16] ERDAL KAYACAN, BARIS ULUTAS, OKYAY KAYNAK. Grey system theory-based models in time series prediction [J]. Expert Systems with Applications, 2010, 37(2): 1784-1789.
�������Ҳ������ͷŹ����밲ȫԤ��ϵͳ
��־�飬�����֣��� ����¬����
���ϴ�ѧ ��Դ�밲ȫ����ѧԺ����ɳ 410083
ժ Ҫ���Դ�ɽͭ���ɹ����в����Ҳ�ı��ν����˼�⣬��������Ҳ��ͷ������ķ������������Ҳ��ͷ�������ʱ�������ع���ռ䣬�ó��Ҳ��ͷ������Ķ���ϵͳ����Ƕ��ά��Ϊ4����ϵά��Ϊ1.212 8���û������۽�ʾ�Ҳ��ͷ���������ռ��е��������ݱ���ɡ��û�ɫ���۽����Ҳ��ͷ�������Ԥ��ģ�ͣ����Ԥ�������6.7%���ڣ�ʵ�ֲ����Ҳ��ͷ�������ȷԤ�⡣�о��������Ҳ��ͷ��������ֳ��������ԣ�������ռ�����ع����Ҳ��ͷ�������ϸ�仯�������Ŵ������ڹ����ܵõ����չʾ�����Դ˽��������Ҳ��ͷ������İ�ȫԤ��ϵͳ��Ϊ��ɽ��ȫ�ɿ��ṩ�˼������ϡ�
�ؼ��ʣ��Ҳ��ͷ���������ռ��ع�����ɫ���ۣ���ȫԤ��ϵͳ
(Edited by FANG Jing-hua)
Foundation item: Project (2010CB732004) supported by the National Basic Research Program of China; Project (51074177) supported by the Joint Funding of National Natural Science Foundation and Shanghai Baosteel Group Corporation, China
Corresponding author: LIU Zhi-xiang; Tel: +86-731-88879612; E-mail: liulzx@mail.csu.edu.cn
DOI: 10.1016/S1003-6326(11)61043-1
Abstract: The strata deformation in mining area was monitored in Dabaoshan copper-iron mine, and an analytical method of strata energy release was put forward. On the basis of chaotic theory, by reconstructing the phase space for time series data of strata energy release, the saturated embedding dimension and the correlation dimension of the dynamic system were obtained to be 4 and 1.212 8, respectively, and the evolution laws of distances between phase points of strata energy release in the phase space were revealed. With grey theory, a prediction model of strata energy release was set up, the maximum error of which was less than 6.7%. The results show that there are chaotic characters in strata energy release during mining; after reconstructing phase space, the subtle changing characteristics of energy release can be magnified, and the internal rules can be fully demonstrated. According to the laws, a warning system for strata stability in mining area was established to provide a technical safeguard for safe mining.
