

Phase formation and electrical characteristic of NASICON ceramics
ZHU Dong-mei(�춬÷), LUO Fa(�� ��), XIE Zhang-long(л����), ZHOU Wan-cheng(�����)
State Key Laboratory of Solidification Processing, Northwestern Polytechnical University, Xi��an 710072, China
Received 15 July 2007; accepted 10 September 2007
Abstract:
Hot pressed sintering were employed to prepare the sodium super ionic conductor (NASICON: Na3Zr2Si2PO12) ceramics using the powder with the corresponding composition from sol-gel method. The density, phase and microstructure of different samples sintered at different temperatures were analyzed and the dependences of density, phase formation, and the microstructure on the sintering temperature were investigated in detail. The AC electrical conductivity and the buck conductivity of the ceramics sintered at different temperatures were measured and discussed. Results show that the samples contain mainly monoclinic NASICON and no ZrO2 phase was found no matter the sintering temperature is high or not. The sintering temperature mainly dominated the density, the microstructure and the electrical characteristics of the ceramics. The densities of the samples increase obviously as the sintering temperature increases and reach 99.4% when the sintering temperature is 1 150 ��. With the increase of sintering temperature, both the density and crystal size of the samples increase obviously, resulting in the visible increase of ionic conductivity of the samples as the sintering temperature. When sintering temperature reaches 1 150 ��, the ionic conductivity of the sample has the highest value of 3.6��10-3 S/cm, which could be attribute to the highest density and least crystal boundary due to largest crystal size of the ceramics.
Key words:
NASICON ceramic; hot-press; electrical conductivity; structure; density;
1 IntroductionSodium superionic conductor(NASICON) has attracted scientific and technological attention due to its promising electrical properties suitable for gas sensors and energy storage systems[1�C3]. NASICON has some useful and unique characteristics, such as low sintering temperature, three dimensional framework and considerably good ionic conductivity compared to other solid electrolytes particularly alumina[4-5].
Structure of Na1+xSixZr2P3-xO12 (x=0-3) can be described as a three-dimensional network of ZrO6 octahedra sharing corners with PO4/SiO4 tetrahedra. The Na+ ions are located in the interstitial sites in this framework. Ionic conduction takes place when Na+ moves from one site to another through ��bottlenecks�� formed by oxygen ions. Moreover, total electrical conductivity strongly depends on density and nature of the grain boundaries[6-7]. It is reported that the compound exhibits a few crystalline form depending on temperature and composition (x), and most sintered NASICONs contain a certain amount of ZrO2 second phases.
NASICON is usually synthesized by two methods (the traditional ceramic route or a sol-gel method) and the microstructure of samples is usually affected by the preparation methods[8-10]. The ceramic route requires higher sintering temperatures leading to segregation of a resistive monoclinic zirconia second phase, following Na and P volatilization. On the contrary, the fine and reactive sol-gel powders require lower sintering temperatures and the obtained materials is more conductive and homogeneous.
In this work, a series of NASIC ceramics with composition of Na1+xZr2SixP3-xO12 (x=2) are developed by hot-press sintering and the dependences of crystalline phase formation, microstructure on the sintering condition are studied. Also, the electrical conductivity of the samples sintered at different temperatures are measured and discussed.
2 Experimental2.1 Preparation of samples
The NASICON powder with the composition Na1+xZr2SixP3-xO12 (x��2) were prepared through sol-gel method and used as the raw materials for NASIC ceramics. The NASIC ceramics were sintered through hot-press method with sintering pressure of 20 MPa at different sintering temperatures (1 000, 1 050, 1 100 and 1 150 ��) for a certain time (30 min).
2.2 Measurement of properties
The crystalline phase were analyzed through X-ray diffraction(XRD) using Rigaku D/max-3C model. The microstructures of the sample were observed using scanning electron microscope (SEM, JEOL JXA-840). The flat surface of the sintered tablet was prepared by polishing and gold paste was used as electrodes on both flat sides of the tablet. The electrical conductivity was measured with an impedance analyzer (Age4294) in frequency band 40-110 MHz and at temperature 300 ��.
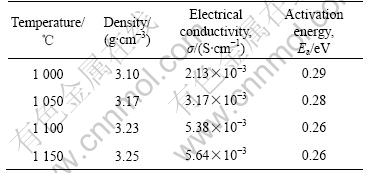
3 Results and discussionThe densities and the calculated porosities of different samples were measured and listed in Table 1. The densities of the samples were improved with the increase of sintering temperature, and reached 3.25 g/cm3 (very close to the ideal value of 3.27 g/cm3) when the sintering temperature is 1 150 ��, indicating that the increase of sintering temperature is much helpful to densify the NASICON ceramics.
Table 1 Density, electrical conductivity, activation energy of samples sintered at different temperatures
The XRD curves of the samples sintered at 1 000, 1 100 and 1 150 �� for 30 min under 20 MPa are shown in Fig.1. All the peaks corresponding to the monoclinic NASIC phase, existing no ZrO2 phase in any sample, means that the hot-press sintering method could avoid the formation of ZrO2 phase. The peaks of the sample sintered at 1 000 �� is wider and lower than those of the samples sintered at higher temperature, especially at 1 150 ��, indicating that the crystal size of the samples sintered at low temperature is smaller than that sintered at high temperature. Therefore, high sintering temperature is helpful for the growth of crystals.
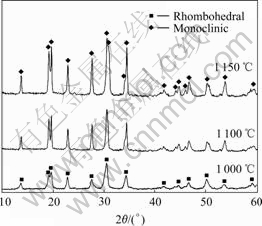
Fig.1 XRD curves of different NASICON samples
The microstructures of the samples were observed through SEM and the micrographs of different samples are shown in Fig.2. It is found that the crystal in the sample sintered at 1 000 �� is much smaller than that of the others. With the increase of sintering temperature, the crystal size increases obviously. There are lots of pores in the sample from low temperature sintering, and both the amount and size of pores in the sample decrease as the temperature increase. When the sintering temperature reaches 1 150 ��, there is almost no pores observed in the samples and the crystals become larger compared with the other samples. It is consistent of the above discussion about the XRD and densities results.
The complex impedance plots of different ceramics at 28 �� are given in Fig.3. For the sample from low temperature sintering, the grain boundary arc is clearly seen and the bulk contribution can only be estimated from the high frequency intercept of the grain boundary arc. With the increase of temperature, the grain boundary arc becomes smaller and the grain arc becomes more visible. When the temperature reaches 1 150 ��, the grain boundary arc and the grain arc are both semicircle with good shape.
The DC conductivity of the samples was calculated using the bulk resistances determined from the complex plots and the results are listed in Table 1. With the increment of sintering temperature, the DC conductivity is improved clearly and reached 5.64��10-3 S/cm when the temperature is 1 150 ��, which is a little higher than that of the reported results[5-6, 9, 11].
It is known that the conductivity is a combination of concentration of mobile species and mobility of these species. The impediment to the mobility of species for the multi-crystal sample includes two parts: one is the impedance from the crystals themselves, and the other from crystal boundary. For the sintered NASIC ceramics, the impedance from crystals boundary are dominate because that the crystals of these samples are very small.
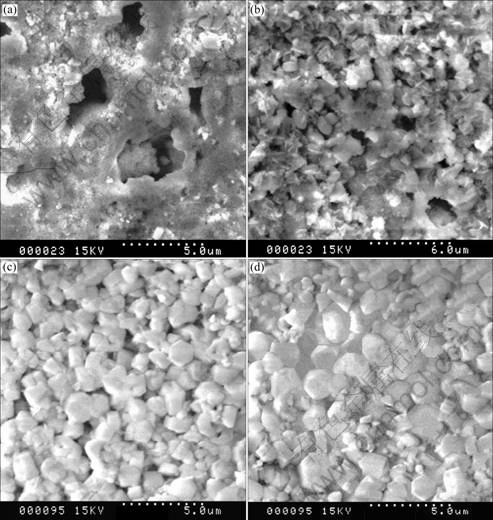
Fig.2 SEM photographs of NASICON ceramics sintered at 1000 ��(a), 1 050 ��(b), 1 100 ��(c) and 1 150 ��(d)
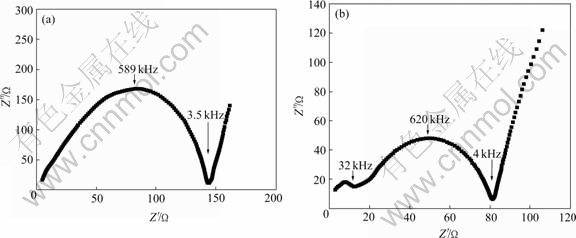
Fig.3 Complex impendence plots of NASICON samples sintered at 1 000 ��(a) and 1 150 ��(b)
As mentioned above, the density of the sample sintered at 1 000 �� is the lowest and the crystal size is the smallest, resulting that the impedance from crystals boundary is the highest and the ion conductivity of the sample is the lowest. As the sintering temperature increase, the crystal grows slowly, the impedance from crystals boundary becomes weaker, and the ion conductivity increases obviously.
The Arrhenius plot of the NASIC ceramics is shown in Fig.4. The activation energy and the transport activation energy of Na+, are determined using the following formula:
![]() (1)
(1)
where �� is the ion conductivity at the temperature of T, Ea is the activation energy, and ��0 is the pre-exponential term which is assumed to be non-temperature dependence. The activation energies of different NASIC ceramics are also listed in Table 1 and the results show that the activation energy of the ceramics falls down slowly as the sintering temperature increase. It is in concordance with the ion conductivity because high ion conductivity corresponding to low activation energy.
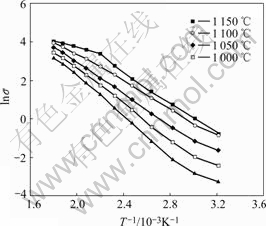
Fig.4 Arrhenius plots of NASICON ceramics
4 Conclusions
The NASICON samples from different sintering temperature contain mainly monoclinic NASICON and no ZrO2 phase was found in the samples no matter the sintering temperature is high or not. The density, the crystal size, and the electrical characteristics of samples are very close related to the sintering temperature. As the sintering temperature increases, both the density and crystal size of samples increase obviously, resulting in the visible increase of ionic conductivity and the decrease of activation energy. When the sintering temperature reaches 1 150 ��, the ionic conductivity of the sample has the highest value of 3.6��10-3 S/cm, which could be attribute to the highest density and least crystal boundary due to largest crystal size of the ceramics.
References
[1] AONO H, SADAOKA Y, MONTANARO L. Humidity influence on the CO2 response of potentiometric sensors based on NASICON pellets with new compositions, Na3Zr2-(x/4)Si2-xP1+xO12 (x=1.333) [J]. Journal of the American Ceramic Society, 2002, 85(3): 585-589.
[2] KIDA T, MIYACHI Y, SHIMANOE K. NASICON thick film-based CO2 sensor prepared by a sol-gel method [J]. Sensors and Actuators B-Chemical, 2001, 80(1): 28-32.
[3] TRAVERSA E, MONTANARO L, AONO H, Synthesis of NASICON with new compositions for electrochemical carbon dioxide sensors [J]. Journal of Electroceramics, 2002, 5(3): 261-272.
[4] HONG H. Crystal structure and crystal chemical in the system Na1+xZr2SixP3-xO12 [J]. Mater Res Bull, 1976, 11: 173-182.
[5] GORDON R S, MILLER G R, MCENTIRE B J, BECK E D, RASMUNSSEN J R. Fabrication and characterization of NASICON electrolytes [J]. Solid State Ionics, 1981, 3/4: 243-248.
[6] FUENTES R O. FIGUEIREDO F M. MARQUES F M B. Processing and electrical properties of NASICON prepared from yittria-doped zirconia precursor [J]. J Eur Ceram Soc, 2001, 21: 737-774.
[7] SHIMIZU Y, USHIJIMA T. Sol-gel processing of NASICON thin film using aqueous complex precursor [J]. Solid State Ionics, 2000, 132(1/2): 143-148
[8] AHMARD A, WHEAT T A, KURIAKOSE A K, CANADAY J D, MCDONALD A G. Dependence of the properties of NASICON on their composition and processing [J]. Solid State Ionic, 1987, 24: 89-97.
[9] SCHAF O, WEIBEL A, LLEWELLYN P. Preparation and electrical properties of dense ceramics with NASICON composition sintered at reduced temperatures [J]. Journal of Electroceramics, 2004, 13(1/3): 817-823
[10] ZHU Q, QIU F, QUAN Y. Preparation and sintering densification of nanocrystalline NASICON solid material [J]. Journal of Inorganic Materials, 2004, 19(3): 510-516.
[11] Fuentes R O, FIGUEIREDO F M, MARQUES F M, FRANCO J I. Influence of microstructure on the electrical properties of NASICON materials [J]. Solid State Ionics, 2001, 140: 173-179.
Foundation item: Projects(50572090) supported by the National Natural Science Foundation of China
Corresponding author: ZHU Dong-mei; Tel: +86-29-88494574; E-mail: dzhunwpu@nwpu.edu.cn
