

J. Cent. South Univ. (2018) 25: 879-891
DOI: https://doi.org/10.1007/s11771-018-3791-y

A quantitative analysis method for GPR signals based on optimal biorthogonal wavelet
LIU Hao-ran(����Ȼ)1, LING Tong-hua(��ͬ��)1, LI Di-yuan(���Ԫ)2,HUANG Fu(�Ƹ�)1, ZHANG Liang(����)1
1. School of Civil Engineering and Architecture, Changsha University of Science & Technology,Changsha 410114, China;
2. School of Resources and Safety Engineering, Central South University, Changsha 410006, China
 Central South University Press and Springer-Verlag GmbH Germany, part of Springer Nature 2018
Abstract:
Due to the disturbances arising from the coherence of reflected waves and from echo noise, problems such as limitations, instability and poor accuracy exist with the current quantitative analysis methods. According to the intrinsic features of GPR signals and wavelet time�Cfrequency analysis, an optimal wavelet basis named GPR3.3 wavelet is constructed via an improved biorthogonal wavelet construction method to quantitatively analyse the GPR signal. A new quantitative analysis method based on the biorthogonal wavelet (the QAGBW method) is proposed and applied in the analysis of analogue and measured signals. The results show that compared with the Bayesian frequency-domain blind deconvolution and with existing wavelet bases, the QAGBW method based on optimal wavelet can limit the disturbance from factors such as the coherence of reflected waves and echo noise, improve the quantitative analytical precision of the GPR signal, and match the minimum thickness for quantitative analysis with the vertical resolution of GPR detection.
Key words:
Cite this article as:
LIU Hao-ran, LING Tong-hua, LI Di-yuan, HUANG Fu, ZHANG Liang. A quantitative analysis method for GPR signals based on an optimal biorthogonal wavelet [J]. Journal of Central South University, 2018, 25(4): 879�C891.
DOI:https://dx.doi.org/https://doi.org/10.1007/s11771-018-3791-y1 Introduction
Engineering quality testing is of great importance for the maintenance and secure operation of infrastructure [1]. Non-destructive GPR testing technology has been widely used in the detection and evaluation of engineering quality for tunnels and bridges [2, 3]. In the fields of concrete structure quality acceptance and tunnel lining safety level evaluation [4�C6], accurate quantitative analysis results must be provided by non- destructive testing technology for the quantified indices of test items.
Generally, the peak amplitude of reflected waves is used to quantitatively analyse the measured target. However, the coherence of reflected waves and the echo noise can change the position of peak amplitude, which will decrease the accuracy of the quantitative analysis of the GPR signal. In addition, the echo noise can lower the signal-to-noise radio (SNR), causing the quantitative analysis to be too dependent on the empirical judgement of researchers, thereby reducing the reliability of the quantitative analysis.
Researchers have completed several studies on quantitative analysis. SCHMELZBACH et al [7] and ZHAO et al [8] used Bayesian frequency- domain deconvolution and regularized deconvolution, respectively, to improve the precision of quantitative analyses for GPR signals. Although these deconvolution methods have a certain degree of accuracy in quantitative analysis, they are built on the minimum phase wavelet and the white noise reflection coefficient; thus, they cannot improve the SNR and are susceptible to echo noise. Therefore, deconvolution methods have the disadvantages of poor stability and low reliability. ZHAO et al [9] used an improved Hough transform to identify the position and diameter of pipelines from GPR images. His method can identify the wave reflected from the upper surface of the pipeline and can calculate the burial depth of the pipeline, but it cannot identify the reflection from the lower surface. Therefore, this method, which can only be used to accomplish the quantitative analysis of pipelines, has a narrow application range and low reliability. Recently, ANNAN et al [10] used a radar range equation to improve the amplitude of the reflected wave and enhance the SNR. A high SNR can reduce the dependence of the quantitative analysis on empirical judgement. However, his study does not take into account the influence of coherent reflected waves and has not been used for actual signal analysis.
In recent years, time-frequency analysis methods, such as wavelet analysis and HHT, have been widely used in GPR signal analysis [11�C13]. LING et al [11] used the Hilbert�CHuang transform (HHT) method to improve the recognition effect of the unfavourable geological body in the GPR signal. OUADFEUL et al [12] used wavelet analysis to extract the land topographical information from the GPR signals, and LI et al [13] used wavelet analysis to identify and distinguish the different strata in the geological radar signal from a karst area. These findings indicate that the time-frequency analysis method can extract the reflected wave information of measured targets from the GPR signals and use the reflected wave information to identify and distinguish the measured targets qualitatively. LING et al [14] used wavelet analysis to identify the singularity of the blasting vibration signal of each section detonator and identified the delay time of the millisecond blasting based on the time coordinates of these singularities. LING et al [15] further improved the recognition precision of the delay time by constructing a new wavelet basis, which is similar to the blasting vibration signal of a single detonator. Inspired by these works, this paper attempts to select or construct a wavelet basis to identify the singularity of reflected waves from measured targets in GPR signals and use the singularity of reflection to provide an accurate quantitative analysis of a GPR signal.
At present, a unified industry standard has not been established among commercial radar companies; therefore, all GPR systems adopt different antenna pulse functions. In this paper, to identify the features of the pulse functions of the SIR and RIS GPR system, an optimal wavelet basis is constructed for the quantitative analysis of a GPR signal via an improved biorthogonal wavelet construction method. According to the wavelet time-frequency analysis, a new quantitative analysis method based on optimal wavelet is proposed and used in the quantitative analysis of analogue and measured signals. The results show that the new method can match the minimum thickness for quantitative analysis with the vertical resolution of GPR detection and improve the quantitative analytical precision of GPR signals compared with both the Bayesian frequency-domain blind deconvolution and the existing wavelet bases.
2 Improved biorthogonal wavelet construction method and its application
2.1 Improved biorthogonal wavelet construction method
Let the vanishing moments of the scale filter {h0,k} and dual scale filter  be N and
  with support lengths L and
 respectively, in the biorthogonal wavelet construction method with PR filter banks [16, 17]. According to the construction formula of LHBF [18], the filters {h0,k} and can be rewritten as follows:
1) When N and are both even, L and  are both odd, and
  is equal to the odd multiplied by 2, we have the following:
 (1)
(1)
2) When N and are both odd, L and are both even, and is equal to the even multiplied by 2, we have the following:
 (2)
(2)
where H0(Z) and  are the half band filters of {h0,k} and
  respectively; ai and bi are unknown parameters; M=(L�CN�C1)/2;
 ; Z=cos(lnz/j) and j2=�C1.
Let the variable z=earccos(z)j, and by substitution, Formulas (1) and (2) can be rewritten as follows:
 (3)
(3)
 (4)
(4)
where H0(z) is the Z-transform of {h0,k}, and  is the Z-transform of [19]. Then, {h0,k} andcan be solved for by the inverse Z-transforms of H0(z) and
 In multiresolution analysis, the {h0,k} andmust satisfy the following bi-orthogonality property [20]:
 (5)
(5)
The following equation set can be obtained by using {h0,k} and 
 (6)
(6)
Putting the solution of Eq.(6) into Eq.(3) and (4) enables the value of filters {h0,k} and to be solved. The above content describes the improved biorthogonal wavelet construction method, herein named the wavelet construction based on LHBF and bi-orthogonality (WMLB) method. When constructing the wavelet basis according to the features of an engineering signal, the WMLB method can use the supporting length and the vanishing moment to decrease the blindness and complexity of wavelet construction. Furthermore, this method is easy to run on the computer, and the procedure is as follows:
h1:=matrix(1,L,[f(a0, ��, ai)])%{h0,k};
h2:=matrix(1, [f(b0,��, bi)])%
For i from 1 to n, do;
t=l1�C2i
If t��l2,
z=l2
otherwise, z=l1-2i
end
eq[1,i]:=submatrix(h1,1..1,1..z)&*transpose (-submatrix(h2,1..1,1+2i.., z+2i)=0
end
solve({eq[1,1],��eq[1,n]},{a0, a1, ��, ai, b0, b1, ��, bi});
2.2 Construction of optimal wavelet basis
The WMLB method is used to construct an optimal biorthogonal wavelet basis for the quantitative analysis of signals in the SIR and RIS GPR systems. For these systems, the waveforms of pulse functions have good smoothness and rapid attenuation [21]. To ensure the localization feature of the wavelet [22], the supported length and vanishing moment of the optimal wavelet basis cannot be too large, and to ensure the correlation between waveform and wavelet basis [23], the optimal wavelet basis should have good symmetry and smoothness.
Suppose the support lengths of {h0,k} and are 6 and 10, respectively, and the vanishing moments are 3. According to Eq. (2), the scale filter and dual scale filter can be written as follows:
 (7)
(7)
By changing the variables of Eq.(7) and then putting it into Eq. (5), the following equation set is obtained:
 (8)
(8)
Since Eq. (8) is an indefinite equation set, let a0=�C5/3 and obtain the solution. The scale filter banks of the new wavelet are obtained:
 (9)
(9)
By importing the {h0,k} and into the MATLAB wavelet toolbox, the optimal wavelet basis is obtained and named the GPR wavelet basis with 3 and 3 order vanishing moment(GPR3.3 wavelet), as shown in Figure 1.
3 Quantitative analysis method based on biorthogonal wavelet
The goal is to construct a quantitative analysis method for GPR signals based on the biorthogonal wavelet (QAGBW method), and the detailed steps are as follows:
Step 1: Image recognition of measured target
Use existing signal processing technology to identify the measured target in the radar image, then extract the single-trace signal containing reflected waves of the measured target.
Step 2: Wavelet time�Cfrequency analysis
Use wavelet time�Cfrequency analysis to address the single-trace signal and extract the wavelet transform modulus of detail coefficients. The detail coefficients are given by
 (10)
(10)
where f(x) is the signal, |dn| is the detail coefficient, ��n(x) is the wavelet scale function, and n is the level of wavelet decomposition.

Figure 1 Functions of GPR3.3 wavelet:
Step 3: Identifying the reflections of the measured target
Mark the local modulus maxima points in the wavelet transform modulus [24] and find the soaring local modulus to determine the reflected waves. Because the wavelet identifying the singularity of reflected waves is better than that of echo noise, the wavelet transform modulus of reflected waves is obviously larger than that of echo noise.
Note that in the case of non-contact detection, the modulus corresponding to the wave reflected off of a medium��s surface is greater than that corresponding to echo noise. In the case of contact detection, it may be less than that of echo noise.
Step 4: Quantitative analysis of the measured target
After identifying the reflected wave of the measured target, use the start times of reflected waves to calculate the distance between them, thereby achieving the quantitative analysis of the measured target��s location and size. The distance calculation formula is given by
 (11)
(11)
where S is the distance between reflected waves, v�� is the propagation velocity of electromagnetic (EM) waves in the medium, and ��t is the two-way travel time.
4 Numerical simulation and experimental verification
The analogue signal is an ideal signal without the disturbance of echo and equipment noise; therefore, a numerical simulation experiment was designed to verify the accuracy and feasibility of the QAGBW method. There are so many echo and equipment noises in the measured signal that a cavity detection experiment was designed to verify the stability of the QAGBW method. In the cavity detection experiment, the results of wavelet bases are compared with each other to verify that the GPR3.3 wavelet is the optimal wavelet basis for the SIR GPR system.
4.1 Analogue signal analysis
4.1.1 Numerical simulation
According to the Rayleigh standard, the vertical resolution of GPR detection is ��/4. For the EM waves in the simulations, the wavelength ��s in sand was 0.136 m, and the wavelength ��0 in air was 0.333 m; therefore, a simulation model was designed with cavity depth of ��s/4 and vertical size of ��0/2. The analogue signal was simulated in GPRMAX2.0 software. Table 1 shows the detailed parameters of the simulation, and Figure 2 shows the design and analogue signal of the simulation model.
Table 1 Detailed parameters of simulation


Figure 2 Design and analogue signal of simulation model:
4.1.2 Comparative analysis of analogue signals
1) Results of Bayesian frequency-domain blind deconvolution
Figure 3 illustrates the profile of the analogue signal processed by Bayesian frequency-domain blind deconvolution. In accordance with the waveform analysis method [25], the change of crest was observed and the No. 30 trace was selected for quantitative analysis. In the No. 30 trace, points 1, 2, and 3 were used to represent the waves reflected by the surface of the simulation sandbox and by the upper and lower surfaces of the simulation cavity, respectively. The start time of points 1, 2 and 3 is 0.537 ns, 0.957 ns and 2.074 ns, respectively, as shown in Table 2. From Formula (11), the calculated depth and vertical size of the simulation cavity were 2.55 cm and 16.79 cm, respectively. Comparing those values with the design values in Table 3, the errors of this method are 0.85 cm and 1.79 cm, respectively, and the error percentages are 25% and 11.9%, respectively. The accuracy of this method is obviously reduced when the thickness of the medium is equal to the vertical resolution. This condition indicates that the coherence of reflected waves can change the location of the reflected wave crest, which will reduce the precision of the quantitative analysis by Bayesian frequency- domain blind deconvolution.

Figure 3 Analogue signal processed by Bayesian frequency-domain blind deconvolution
2) Results of QAGBW method
Based on a comparison among existing wavelet bases, the Bior6.8 wavelet was selected as the optimal wavelet basis of sinusoidal excitation in GPRMAX2.0 software. According to the QAGBW method, the grey variation of the analogue signal observed in Figure 2(b) indicated that the No. 30 trace should be selected for quantitative analysis. Figure 4(a) shows the time�Camplitude curve of the No. 30 trace, and Figure 4(b) shows the Bior6.8 wavelet transform modulus, where |d4| is the detail coefficient at level 4. In Figure 4(b), according to the characteristics of the wavelet singularity analysis, points 1, 2 and 3 represent the waves reflected by the surface of the simulation sandbox and by the upper and lower surfaces of the simulation cavity, respectively; the start time of these points is 0.9547 ns, 1.551 ns and 2.506 ns, respectively, as shown in Table 2. From Formula (11), the calculated depth and vertical size of the simulation cavity are 3.65 cm and 14.32 cm, respectively. Compared to the design values in Table 3, the errors of the QAGBW method are 0.25 cm and 0.68 cm, respectively, and the error percentages are 7.3% and 4.5%, respectively.
3) Comparison and discussion
The comparison results between calculations provided by the two methods and the design values are illustrated in Table 3. In the sand medium, when the thickness L1 is equal to the vertical resolution ����/4, compared with the Bayesian frequency-domain blind deconvolution, the result from the QAGBW method is closer to the design value L1, and the error percentage is reduced by 17.7%. In the air medium, when the thickness L2 is equal to ��0/2, compared with the Bayesian frequency-domain blind deconvolution, the result from the QAGBW method is closer to the design value L2, and the error percentage is reduced by 7.4%. These results indicate that the QAGBW method can reduce the impact of coherent reflected waves on the quantitative analytical precision and can match the minimum thickness for quantitative analysis with the vertical resolution; therefore, this method has higher precision than the Bayesian frequency- domain blind deconvolution.

Figure 4 No. 30 trace and its Bior6.8 wavelet transform modulus:
Table 2 Coordinates of wave crests in analogue signal analyses

4.2 Experimental signal analysis
4.2.1Cavitydetection experiment
Table 4 shows the design parameters of the cavity detection experiment, and Figure 5 shows the design, model-making process and radar profile of the cavity detection experiment.
4.2.2 Comparative analysis of experimental signal
1) Results of Bayesian frequency-domain blind deconvolution
Figure 6 presents the profile of the experimental signal processed by Bayesian frequency-domain blind deconvolution. The change of crest was observed, and the No. 50 trace was selected for quantitative analysis. In the No. 50 trace, points 1, 2 and 3 represent the waves reflected by the surface of the sandbox and by the upper and lower surfaces of the cavity, respectively; the start time of these points is 1.438 ns, 2.964 ns and 4.021 ns, respectively, as shown in Table 5. From Formula (11), the calculated depth and vertical size of the cavity are 11.45 cm and 15.86 cm, respectively, and compared with the actual values (Table 6), the errors of the waveform analysis method are 4.55 cm and 5.14 cm, respectively, and the error percentages are 28.4% and 24.5%, respectively. These results indicate that the echo and equipment noise can reduce the precision of Bayesian frequency-domain blind deconvolution.
2) Results of the QAGBW method based on GPR3.3 wavelet
According to the QAGBW method, the grey variation of experimental signal in Figure 5(c) was observed, and the No. 50 trace was selected for wavelet analysis. Figure 7 shows the time- frequency analysis of the No. 50 trace decomposed by the GPR3.3 wavelet. Figure 8(a) shows the GPR3.3 wavelet transform modulus of the No. 50 trace. According to the wavelet singularity analysis, points 1, 5 and 9, represent the waves reflected by the surface of the sandbox and by the upper and lower surfaces of the cavity, respectively; the start time of these points is 1.086 ns, 3.199 ns and 4.725 ns, respectively, as shown in Table 5.
Table 3 Quantitative analysis of analogue signal
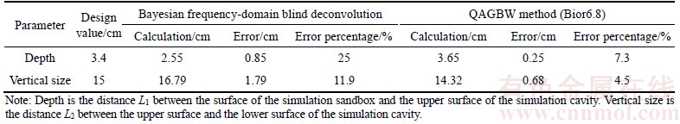
Table 4 Experimental parameters of cavity detection


Figure 5 Cavity detection experiment:
According to Formula (11), the calculated depth and vertical size of the simulation cavity are 15.85 cm and 22.87 cm, respectively. Compared with the actual value in Table 6, the errors of the QAGBW method are 0.15 cm and 1.87 cm, respectively, and the error percentages are 0.9% and 8.9%, respectively.
3) Results of QAGBW method based on the Bior2.4 wavelet
The Bior2.4 wavelet has the smallest signal reconstruction error among the existing wavelet bases. The QAGBW method based on the Bior2.4 wavelet was used to analyse the No. 50 trace, and Figure 8(b) shows the Bior2.4 wavelet transform modulus of the No. 50 trace. According to the wavelet singularity analysis and the change of modulus, points 1, 5 and 6, represent the waves reflected by the surface of the sandbox and by the upper and lower surfaces of the cavity, respectively; the start time of these points is 1.086 ns, 2.319 ns and 4.696 ns, respectively, as shown in Table 5. From Formula (11), the calculated depth and vertical size of the simulation cavity are 8.81 cm and 35.65 cm,respectively; compared with the actual values (Table 6), the errors of the QAGBW method are 7.19 cm and 14.65 cm, respectively, and the error percentages are 44.9% and 69.8%, respectively.

Figure 6 Experimental signal processed by Bayesian frequency-domain blind deconvolution
4) Results of QAGBW method based on Db6 wavelet
The Db6 wavelet is mainly used to identify the delay time of millisecond blasting. The QAGBW method based on the Db6 wavelet was used to analyse the No. 50 trace. Figure 8(c) shows the Db6 wavelet transform modulus of the No. 50 trace. According to the wavelet singularity analysis, points 1, 3 and 5, represent the waves reflected by the surface of the sandbox and by the upper and lower surfaces of the cavity, respectively; the start time of these points is 1.115 ns, 2.289 ns and 3.228 ns, respectively, as shown in Table 5. From Formula (11), the calculated depth and vertical size of the simulation cavity are 8.80 cm and 14.09 cm, respectively; the errors of the QAGBW method are 7.20 cm and 6.91 cm, respectively; and the error percentages are 45% and 32.9%, respectively, as shown in Table 6.

Figure 7 Time�Cfrequency analysis of No. 50 trace by the GPR3.3 wavelet
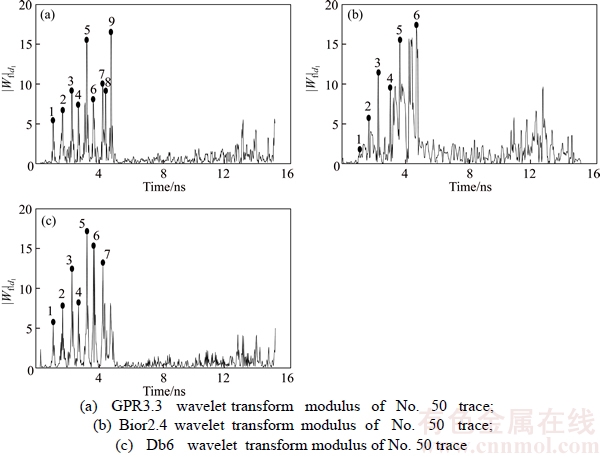
Figure 8 Wavelet transform modulus of No. 50 trace:
Table 5 Coordinates of wave crests in experimental signal

Table 6 Quantitative analysis of experimental signal

5) Comparison and discussion
The quantitative analysis results of the QAGBW method based on the three different wavelets are listed in Table 6. A comparison of the three shows that the GPR3.3 wavelet produced results that are closest to the actual values. This finding indicates that the GPR3.3 wavelet basis can accurately identify the singularity of the measured target reflected wave, which is used to achieve the exact quantitative analysis. At the same time, the QAGBW method based on the GPR3.3 wavelet has higher precision than the Bayesian frequency- domain blind deconvolution, and the error percentages for L1 and L2 are reduced by 27.5% and 15.6%, respectively, as shown in Table 6. These results indicate that the QAGBW method can limit the impacts of the echo and equipment noise on the quantitative analysis of GPR signals to improve the quantitative analytical precision. The above analytical results verify the stability and accuracy of the QAGBW method in the quantitative analysis of measured signals, and they also prove that the GPR3.3 wavelet basis is the optimal wavelet basis for the quantitative analysis of the SIR GPR system��s signal.
5 Engineering applications
5.1 Non-destructive test of pre-stressed unit
The RIS GPR system was used to evaluate whether the actual layout of corrugated pipe and longitudinal bar conform to design in a pre-stressed unit. Table 7 shows the design parameters for the non-destructive test of a pre-stressed unit. Figure 9 shows the design and GPR profile of the pre-stressed unit.
5.2 Signal analysis of non-destructive test
According to the grey variation of the test signal in Figure 9(c), the time frame in which the longitudinal bar is located is [2.0 ns, 2.8 ns], and the time frame in which the corrugated pipe is located is [3.3 ns, 4.5 ns]. The QAGBW method based on the GPR3.3 wavelet was used to analyze the No. 37 and No. 44 traces, as shown in Figure 10. Figure 10(c) shows the GPR3.3 wavelet transform modulus of the No. 37 trace. According to the wavelet singularity analysis, points 1, 2 and 3 represent the waves reflected by the surface of the concrete and by the upper and lower surfaces of the corrugated pipe, respectively; the start time of these points is 1.095 ns, 3.825 ns and 4.278 ns, respectively, as shown in Table 8. According to Formula (11), the calculated depth and vertical size of the corrugated pipe are 12.28 cm and 6.79 cm,respectively, as shown in Table 9. Figure 10(d) shows the GPR3.3 wavelet transform modulus of the No. 44 trace. In Figure 10(d), points 1 and 2 are used to represent the surface of the concrete and longitudinal bar, and the start times of these points are 1.007 ns and 2.394 ns, respectively, as shown in Table 8. According to Formula (11), the calculated depth of the corrugated pipe is 6.24 cm, as shown in Table 9.
Table 7 Design parameters for non-destructive test of pre-stressed unit

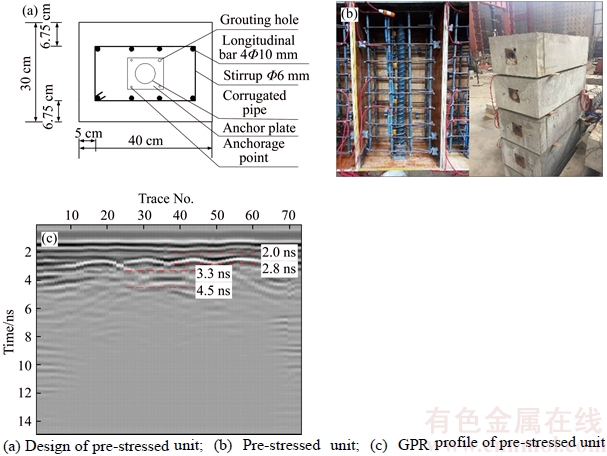
Figure 9 Non-destructive test of pre- stressed unit:

Figure 10 Traces and their wavelet transform moduli:
Table 8 Coordinates of wave crests in engineering test signal analysis

Table 9 Quantitative analysis results for pre-stressed unit
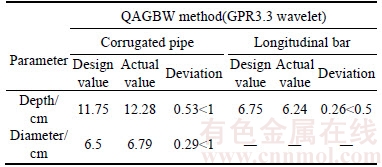
According to the code for acceptable construction quality of concrete structures, in Table 9, the depth deviation of the corrugated pipe is 0.53 cm from design depth, which is less than the allowable deviation (1 cm). The diameter deviation of the corrugated pipe is 0.29 cm from design depth, which is also less than the allowable deviation(1 cm). The depth deviation of longitudinal bar is 0.26, which is less than the allowable deviation (0.5 cm). It is clear that this pre-stressed unit conforms to the demands of design.This result also proves that the QAGBW method based on the GPR3.3 wavelet can be effectively used in the quantitative analysis of signals of RIS GPR systems.
6 Conclusions
1) According to the features of pulse functions in the SIR and RIS GPR systems, an optimal wavelet basis (GPR3.3 wavelet basis) was constructed for the quantitative analysis of the GPR signal via an improved biorthogonal wavelet construction method. Based on a wavelet time�C frequency analysis, a new quantitative analysis method for GPR signals based on a biorthogonal wavelet (QAGBW method) was proposed and successfully used in the analysis of analogue signals, experimental signals and engineering detection signals.
2) The QAGBW method based on the optimal wavelet can further improve the quantitative analytical effects of GPR signals. In the analysis of analogue and measured signals, compared with the existing deconvolution method, the QAGBW method can improve the quantitative analytical precision of the GPR signal by limiting the impact of factors such as the coherence of the reflected waves, echo and equipment noise and matching the minimum thickness for quantitative analysis with the vertical resolution of GPR detection. Furthermore, compared with existing wavelet bases, the GPR3.3 wavelet provides the optimal wavelet basis for the quantitative analysis of signals in the SIR and RIS GPR systems.
3) The QAGBW method expands the application fields of wavelet time-frequency analysis and enriches the quantitative analysis methods for GPR signals. To further perfect the application of the QAGBW method in the quantitative analysis of GPR signals, the optimal wavelet basis will be selected and constructed to improve the pulse functions of the RAMAC GPR and pulse EKKOGPR systems in the next phase.
References
[1] SOLLA M, LORENZO H, MART NEZ-S
NEZ-S NCHEZ J, P
 REZ-GRACIA V. Applications of GPR in association with other non-destructive testing methods in surveying of transport infrastructures [M]// Civil Engineering Applications of Ground Penetrating Radar. Springer International Publishing, 2015: 327�C342.
[2] LEI Xiang, ZHOU Hui-lin, SHU Z, TAN Si-hao, LIANG Guo-qing, ZHU Jian. GPR evaluation of the Damaoshan highway tunnel: A case study [J]. Ndt & E International, 2013, 59(7): 68�C76.
[3] VARNAVINA A V, KHAMZIN A K, SNEED L H, ANDERSON N L, MAERZ N H, BORKO K J. Concrete bridge deck assessment: Relationship between GPR data and concrete removal depth measurements collected after hydrodemolition [J]. Construction & Building Materials, 2015, 99: 26�C38.
[4] DIEGO A. Rock fracture characterization with GPR by means of deterministic deconvolution [J]. Journal of Applied Geophysics, 2016, 126: 27�C34.
[5] The Professional Standards Complication Group of People��s Republic of China. Rail transportation letter 174�C2004: Temporary rules on evaluation of safety classification for railway tunnel lining[S]. Beijing: China Railway Publishing House, 2004. (in Chinese)
[6] China Academy of Building Research. Code for acceptance of constructional quality of concrete structures GB50204- 2015 [M]. Beijing: China Construction Industry Press, 2015. (in Chinese)
[7] SCHMELZBACH C, SCHERBAUM F, TRONICKE J, DIETRICH P. Bayesian frequency-domain blind deconvolution of ground- penetrating radar data [J]. Journal of Applied Geophysics, 2011, 75(4): 615�C630.
[8] ZHAO S, SHANGGUAN P, AL-QADI I L. Application of regularized deconvolution technique for predicting pavement thin layer thicknesses from ground penetrating radar data [J]. Ndt & E International, 2015, 73: 1�C7.
[9] ZHAO Y, JIN M, WU J. Quantitative analysis on pipelines from GPR images based on improved hough transform [C]// IEEE Particle Accelerator Conference. New York: IEEE, 2011, 3: 1428�C1430.
[10] ANNAN A P, DIAMANTI N. A Step towards quantitative target analysis for GPR [C]// GPR2016, International Conference on Ground Penetrating Radar. Hong Kong: IEEE, 2016.
[11] LING Tong-hua, ZHANG Sheng, LI Sheng-ran. Hilbert-Huang Transform method for detection signal of tunnel geological prediction using ground penetrating radar [J]. Chinese Journal of Rock Mechanics and Engineering, 2012, 31(7): 1422�C1428.
[12] OUADFEUL S A, ALIOUANE L. Multiscale analysis of 3D GPR data using the continuous wavelet transform [J]. Arabian Journal of Geosciences, 2009, 6(11): 1�C4.
[13] LI S C, ZHOU Z Q, YE Z H, LI L P, ZHANG Q Q, XU Z H. Comprehensive geophysical prediction and treatment measures of karst caves in deep buried tunnel [J]. Journal of Applied Geophysics, 2015, 116: 247�C257.
[14] LING Tong-hua, LI Xi-bing. Time-energy analysis based on wavelet transform for identifying real delay time in millisecond blasting [J]. Chinese Journal of Rock Mechanics and Engineering, 2004, 23(13): 2266�C2270. (in Chinese)
[15] LING Tong-hua, ZHANG Sheng, CHEN Qian-qian, LI Jie. Wavelet basis construction method based on separation blast vibration signal [J]. Journal of Central South University, 2015, 22(7): 2809�C2815.
[16] SU Juan, DONG Xin-han. Algebraic structure and construction of bi-orthogonal filter banks [J]. Chinese Annals of Mathematics, Series A, 2014, 35(4): 451�C462.
[17] TAY D B H, KINGSBURY N G. Flexible design of multidimensional perfect reconstruction FIR 2-band filters using transformations of variables [J]. IEEE Transactions on Image Processing, 1993, 2(4): 466�C480.
[18] TAY D B H. Rationalizing the coefficients of popular biorthogonal wavelet filters [J]. IEEE Transactions on Circuits & Systems for Video Technology, 2000, 10(6): 998�C1005.
[19] CHEN Yong, WANG Guo-qiu. Construction of 4-band compactly supported symmetric wavelet frame [J]. J Sys Sci & Math Scis, 2014, 36(6): 718�C723. (in Chinese)
[20] ZHANG S, ZHANG S, YAN W. Biorthogonal wavelet construction using homotopy method [J]. Chinese Journal of Electronics, 2015, 24(4): 772�C775.
[21] ZENG Zhao-fa, LIU Si-xin, FENG Xuan. Principle and application of ground penetrating radar [M]. Beijing: Publishing House of Electronics Industry, 2010: 143�C155. (in Chinese)
[22] PRASAD P M K, PRASAD D Y V, RAO G S. Performance analysis of orthogonal and biorthogonal wavelets for edge detection of X-ray images [J]. Procedia Computer Science, 2016, 87: 116�C121.
[23] ABDOLMALEKI M, TABAEI M, FATHIANPOUR N, GORTE B G H. Selecting optimumbase wavelet for extracting spectral alteration features associated with porphyry copper mineralization using hyperspectral images [J]. International Journal of Applied Earth Observation & Geoinformation, 2017, 58(8): 134�C144.
[24] WU X F, HU S G, ZHAO J, LI Z M, LI J, TANG Z J, XI Z F. Comparative analysis of different methods for image enhancement [J]. Journal of Central South University, 2014, 21(12): 4563�C4570.
[25] YANG Yan-qing, HE Shao-hui, QI Fa-lin, JIANG Bo. Simulation test of GPR non-contact detection on lining of railway tunnel [J]. Chinese Journal of Rock Mechanics and Engineering, 2011, 30(9): 1761�C1771. (in Chinese)
(Edited by HE Yun-bin)
���ĵ���
��������˫����С�����ĵ����״��źŶ�����������
ժҪ�����еĵ����״��źŶ��������������ܷ��䲨����ͻز����������ص�Ӱ�죬�������ԵIJ��ȶ��ԡ������Ժ�ȷ�Բ�����⡣������Ե����״��źź�С��ʱ�CƵ�����Ĺ����ص㣬���øĽ���˫����С�����췽�����������ڵ����״��źŶ�������������˫����С����(GPR3.3С����)������˻���˫����С�����ĵ����״��źŶ���������(QAGBW��)�������÷�Ӧ����ģ���źź�ʵ���źŵĶ��������С����������������BayesianƵ����ä����������С������ȣ���������С������QAGBW���ܹ���Ч���Ʒ��䲨����ͻز����������صĸ��ţ���ߵ����״��źŶ����������ȣ���ʹ������������С���������״�Ĵ�ֱ̽��ֱ�����ƥ�䡣
�ؼ��ʣ������״����źţ�����������С��ʱ�CƵ������˫����С����
Foundation item: Projects(51678071, 51278071) supported by the National Natural Science Foundation of China; Projects(14KC06��CX2015BS02) supported by Changsha University of Science & Technology, China
Received date: 2017-10-16; Accepted date: 2018-03-15
Corresponding author: LING Tong-hua, PhD, Professor; Tel: +86�C13974870263; E-mail:lingtonghua@163.com
Abstract: Due to the disturbances arising from the coherence of reflected waves and from echo noise, problems such as limitations, instability and poor accuracy exist with the current quantitative analysis methods. According to the intrinsic features of GPR signals and wavelet time�Cfrequency analysis, an optimal wavelet basis named GPR3.3 wavelet is constructed via an improved biorthogonal wavelet construction method to quantitatively analyse the GPR signal. A new quantitative analysis method based on the biorthogonal wavelet (the QAGBW method) is proposed and applied in the analysis of analogue and measured signals. The results show that compared with the Bayesian frequency-domain blind deconvolution and with existing wavelet bases, the QAGBW method based on optimal wavelet can limit the disturbance from factors such as the coherence of reflected waves and echo noise, improve the quantitative analytical precision of the GPR signal, and match the minimum thickness for quantitative analysis with the vertical resolution of GPR detection.
