

J. Cent. South Univ. (2021) 28: 179-193
DOI: https://doi.org/10.1007/s11771-021-4595-z

Cobalt crust recognition based on kernel Fisher discriminant analysis and genetic algorithm in reverberation environment
ZHAO Hai-ming(�Ժ���)1, 2, ZHAO Xiang(����)1, HAN Feng-lin(������)1, 2, WANG Yan-li(������)1
1. School of Mechanical and Electrical Engineering, Central South University, Changsha 410083, China;
2. State Key Laboratory of High Performance Complex Manufacturing, Central South University,Changsha 410083, China
 Central South University Press and Springer-Verlag GmbH Germany, part of Springer Nature 2021
Abstract:
Recognition of substrates in cobalt crust mining areas can improve mining efficiency. Aiming at the problem of unsatisfactory performance of using single feature to recognize the seabed material of the cobalt crust mining area, a method based on multiple-feature sets is proposed. Features of the target echoes are extracted by linear prediction method and wavelet analysis methods, and the linear prediction coefficient and linear prediction cepstrum coefficient are also extracted. Meanwhile, the characteristic matrices of modulus maxima, sub-band energy and multi-resolution singular spectrum entropy are obtained, respectively. The resulting features are subsequently compressed by kernel Fisher discriminant analysis (KFDA), the output features are selected using genetic algorithm (GA) to obtain optimal feature subsets, and recognition results of classifier are chosen as genetic fitness function. The advantages of this method are that it can describe the signal features more comprehensively and select the favorable features and remove the redundant features to the greatest extent. The experimental results show the better performance of the proposed method in comparison with only using KFDA or GA.
Key words:
Cite this article as:
ZHAO Hai-ming, ZHAO Xiang, HAN Feng-lin, WANG Yan-li. Cobalt crust recognition based on kernel Fisher discriminant analysis and genetic algorithm in reverberation environment [J]. Journal of Central South University, 2021, 28(1): 179-193.
DOI:https://dx.doi.org/https://doi.org/10.1007/s11771-021-4595-z1 Introduction
Ocean is richer in cobalt crust than land, and cobalt crust is attached to the bedrock and the coverage of the mine is about 50%. Therefore, the recognition of cobalt crust in the deep-sea mine is very important. During the detection of cobalt crusts, the sediment which is stirred up by the working mining equipment and the uneven surfaces of cobalt and bedrock will both affect the target echoes. The main problem of classifying the seabed materials located in mining area is processing the features of target echoes. The purpose of this research is to propose a method for recognizing seabed material of cobalt crust mining areas in the reverberant environment.
At present, the linear prediction method is used to extract the features of one-dimensional sequences. For example, JAVIER et al [1] used linear prediction to extract linear prediction coefficients (LPC) features of radar signals of seven human targets with different postures. YANG et al [2] extracted linear predictive cepstral coefficient (LPCC) features of acoustic waves generated by construction equipment. Besides, wavelet analysis methods can perfectly reflect local features of signal because the time and frequency windows are both changeable. Therefore, wavelet analysis methods are successfully applied in classifying the underwater materials. The features of sub-band energy are extracted via orthogonal wavelet packet transform (WPT), which will produce notable results in identifying materials of rock, pebble, sand and sludge, and the average recognition rate is 87.5% [3]. Edge features extracted by wavelet transform (WT) are used to classify underwater materials in lake, whose recognition rate is 95% [4]. While using the features of singular values of stationary wavelet transform (SWT), the recognition rate is 98.7% [5]. Tail- wave envelop features of discrete wavelet transform (DWT) are adopted to classify silver sand, coarse sand and gravel, and the recognition rate is 93.1% [6]. According to the researches of the above scholars, linear prediction and wavelet analysis are reliable methods for extracting the single feature of echo of general bottom sediment.
It can be easily classified using the single feature methods presented above for the underwater objects with even surfaces. However, when the above methods are used to recognize underwater objects with fluctuant surfaces such as cobalt crusts and bedrocks in the reverberation environment, the single features cannot fully describe properties of the signal and the performance of recognition is unsatisfactory, because the fluctuant surfaces will affect the reflection and the scattering of boundary sound waves. In addition, the echo will also contain the scattered wave of suspended sediment because of the reverberation environment. Hence, it is necessary to extract multiple features to fully describe properties of the signal.
However, these features are often high- dimensional data, which will cause ��curse of dimensionality��. How to reduce the dimension and fuse these features is of great significance. Both feature transformation and subset selection are used in this research to reduce dimensions of features. The difference between feature transformation and subset selection is that a new set of features will be generated in the process of feature transformation [7]. Feature transformation includes linear and non-linear methods. In Ref. [8], test samples of Iris are applied to simulate these two types of methods. Results show that non-linear methods are more suitable for feature reduction. Furthermore, the results of two non-linear transformation algorithms including kernel principal component analysis (KPCA) and kernel Fisher linear discriminant analysis (KFDA) are compared and KFDA has better performance. KFDA is widely used in feature processing and it is successfully applied in pattern recognition such as face recognition [9]. Therefore, KFDA is a reliable algorithm to transform many types of features. Then, due to the difference in the recognition performance of different features applied in the mining area, the genetic algorithm (GA) is used to further select the features and obtain the optimal identification feature subset in order to determine the combination of multiple types of features.
In this study, we propose a method for recognizing substrate material of cobalt crust mining areas in the reverberant environment. Firstly, this method extracts the features of LPC, LPCC, modulus maxima, sub-band energy and multi-resolution singular spectrum entropy in wavelet domain. And then KFDA is applied to reduce the dimension of these features; GA is adopted to select optimal feature subsets with higher classification performance. Finally, the recognition result of the substrate material is obtained. To test the validity of this method, we simulate a real-life condition of the mining environment. Bedrock and cobalt crust are placed on the floor of a water filled tank with dimensions of 5 m��3 m��1.8 m, and these materials are interrogated by ultrasonic at 160 kHz. The experimental results show that the performance of this method is better than the single-feature recognition method and the dimensionality reduction method using only KFDA or GA.
2 Acquisition of substrate echo in mining areas
Before presenting the recognition method of substrates materials in cobalt crust mining areas, we first describe the experiments and experimental data used in the study. Because the real mining experiment in deep-sea is difficult to conduct, a set of ultrasonic detection system was developed independently in order to simulate the mining condition. The experimental apparatus was introduced in Ref. [10] and the experimental apparatus is schematically shown in Figure 1.
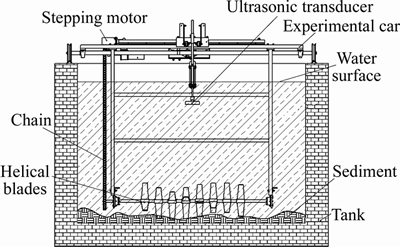
Figure 1 Schematic diagram of experimental apparatus
The experimental apparatus consists of the tank, helical blades, chain, ultrasonic transducer, experimental car. The dimensions of the tank are 5 m��3 m��1.8 m. The ultrasonic transducer is installed at the front end of the experimental car and moves around with it. The bottom under the helical blades are covered with gravel and sediment to simulate the bottom of mine. After turning on the motor, the seafloor sediments can be stirred up and suspended by the helical blades, and when the tank environment is stabilized, the reverberation environment for ultrasonic detection is formed. The volume concentration is 0.06, and the average diameter of the sediment is 3.39 ��m. Through the simulation analysis of velocity and volume fraction of the sediment, the results show that the reverberation environment simulated by the experimental apparatus is little different from the reverberation environment during actual mining; therefore, the experimental apparatus can better simulate the mining environment [11].
In order to reduce the influence of the reverberation environment, the relationship between the detection frequency and the concentration of sediment was obtained based on the sound attenuation model of the reverberation environment and the sonar detection equation under the reverberation conditions. Then, the simulation of the axial sound field of the transducer based on the Khokhlov-Zabolotkaya- Kuznetsov (KZK) equation determined that the center frequency of the ultrasonic transducer is 160 kHz; the beam angle is 7��; and the radiated ultrasonic power is 85 W. The results show that the target echo can be clearly obtained under mining reverberation conditions by using this detection frequency [12]. The transmitting waveform of ultrasonic transducer is sine wave with a sampling frequency of 2 MHz, and a single acquisition of 10000 data points.
The ultrasonic transducer is positioned to be 1-2 m away from the bottom and 1.5 m in front of the helical blades, and its bottom under the helical blades is covered with cobalt crusts and two kinds of bedrock substrates. Substrates are tested in a simulated mining environment in the laboratory, and 210 samples are for each substrate. In general, the number of test samples needs to be no less than half of the training samples. Therefore, 140 signals are selected as training samples, and the number of test samples is 70. First, the received signal is normalized in amplitude. Then, the starting point of the echo is calculated through cross-correlation method. Finally, the echo length is selected to be 700 points according to the longest duration of the echo sample [12].
3 Features extraction of substrate echo
We represent ultrasonic signals using a combination of features. To find the optimal combination, five kinds of features are extracted in this section, which include LPC, LPCC, wavelet transform modulus maxima, sub-band energy of wavelet packet transform and multi-resolution singular spectrum entropy of stationary wavelet transform.
3.1 Feature of LPC
Though the different physical and mechanical properties of cobalt crusts and different types of bedrock result in different characteristics of ultrasonic echoes, the echoes of the same sample are correlated to a certain extent at different moments. Therefore, theoretically, some past values of the sample can be used to predict future or current sample values, that is, using the linear prediction idea in speech recognition to minimize the errors between actual values and linear prediction values under certain conditions. A set of linear prediction coefficients can be uniquely determined, and the features of the signal LPC can be obtained. JAVIER et al [1] introduced the calculation process of linear prediction coefficient of one-dimensional sequence.
The process of extracting the echo features of cobalt crust by linear prediction coefficient is as follows:
1) Chunk (framing): decompose the echo signals based on the principle of speech signal framing, and the number of frames is J.
2) Calculate the linear prediction coefficient of each frame signal.
3) Calculate the sum of the squares of the linear prediction coefficients of each frame signal as the features of the frame Hi, and the linear prediction coefficient features of signal frequency domain are obtained:
 .
.
The echo is divided into 7 frames; the size of window is 160 samples; the frame shift is 80 samples; and the order of the linear predictor is 8. The LPC feature of the echo obtained by the above steps is a 7-dimensional matrix.
3.2 Feature of LPCC
In the process of target recognition, linear prediction coefficients are often converted into equivalent parameters in engineering. Such parameters are derived based on linear prediction coefficients, and the derived parameters are often used for feature extraction of one-dimensional sequences.
LPCC is a kind of derivation of LPC parameters. LPCC performs Fourier transform on LPC and takes the modulus value, and then the result is inverse Fourier transform. LPCC is small in calculation and easy to implement, and is widely used in feature extraction fields such as voice, radar, and noise [13, 14]. The method of calculating the LPCC according to the Fourier transform method is more complicated. In practical applications, the recurrence formula is usually used for calculation. The LPCC coefficients of one- dimensional sequences are calculated according to the method in Ref. [2].
1) First, the echo is framed according to the steps in Section 2.1 and the LPC coefficients are extracted.
2) Calculate the LPCC coefficient of the echo according to the recurrence formula in Ref. [2].
3) Find the sum of the squares of the LPCC coefficients of each frame signal as the features of the frame.
4) A feature of a sample echo is obtained, the dimension of which is equal to the number of frames.
The signal is divided into 7 frames; the size of window is 160 samples; the frame shift is 80 samples; the order of the linear predictor is 8; and the number of LPCC is 10. The LPCC feature of the echo obtained by the above steps is a 7-dimensional matrix.
3.3 Wavelet transform modulus maxima
The idea of wavelet transform is inner products of the signal f(t) and a family of wavelets. The process of wavelet transform is introduced in Ref. [15]. The family of wavelets is shown as:
 (1)
(1)
where ��(t) is the wavelet prototype, which is also called the mother wavelet of the analysis; a is the dilatation or scale parameter that defines the support width of the son wavelet; f(��) is the wavelet basis function; b is a translation parameter related to time domain.
Wavelet transform can be written as:

 (2)
(2)
Let Wf be the coefficient of wavelet decomposition; ��*(��) is the scaling function; (a0, b0) is chosen randomly. When b belongs to the neighborhood of b0, it will always have:
 (3)
(3)
Then, b0 is the local maximum value point and Wf(a0, b0) is the local maximum value on scale a0 [16].
The quantity and position of local value points may be changeable for different echoes. For the signal of f(t), we can get all the local maximum value points on scale a0 such as: Wf (a0, b1), ��, Wf (a0, bm). In this work, the time axis (0, t)(0i
 (4)
(4)
Finally, the feature can be expressed as: Fwt=(E1, ��, El)T.
The wavelet transform modulus maxima has outstanding effects on detecting the singularity of the signal, and has good anti-interference and anti-noise performance. For echoes with little difference in spectrum but significant difference in local singularity, better recognition results can be achieved based on feature extraction method of the mode maximum. The steps of extracting features of the modulus maxima of the substrate signal are as follows:
1) The echo sample is divided into n segments, and each segment of the signal is wavelet transformed. Gaussian anti-symmetric wavelet, of which the length is 20 and amplitude  is adopted as the wavelet function.
2) Find the modulus maxima of the wavelet coefficients, and calculate the sum of the squares of the modulus maxima En.
3) Using En as a feature of the segment signal, the dimension of a sample feature is n.
Setting n=20, and then the echo sample of seafloor material is divided into 20 segments. According to the above steps, the feature matrices with 20-dimension can be obtained.
3.4 Sub-band energy of wavelet packet transform
The cobalt crust and bedrock have different attenuation absorption effects on the ultrasonic signals of different frequency components. Therefore, the energy of different frequency components in the received signal can be used as the feature of the substrate, so that the originally unobvious frequency characteristics have several different resolutions. The subspace is presented in a more significant form of energy variation, thereby extracting characteristic information reflecting the type of substrate. However, wavelet transform decomposes only the lower frequency of the signal, which may cause the loss of important information located in higher frequency components. The use of wavelet packet transform can extract many more features about the signal because it represents the signal with the various combinations of high and low frequency components. The process of wavelet packet transform was introduced in Ref. [17].
Wavelet packet decomposition is performed on the signal, and each frequency band decomposition coefficient is reconstructed to extract signals in each frequency band. The reconstructed signal via wavelet packet coefficients of level j can be expressed as  and then wavelet energy can be written as:
 (5)
(5)
where i (i=0, 1, ��, 2j-1) represents the number of sub-bands.
For the sample of the substrate echo, the feature extraction process of wavelet packet transform sub-band energy is:
1) A j-layer wavelet packet transform is performed on the echo to obtain 2j decomposition coefficients of different frequency components.
2) Wavelet packet is reconstructed for each decomposition coefficient to obtain signals of each frequency band 
3) Calculate the energy of each band signal E(j, i) and the sum of the signal energy of each band E.
4) Construct the features of wavelet packet sub-band energy:
 (6)
(6)
DB4 orthogonal wavelet function is selected in this section. Wavelet packet transform for three layers is used to decompose echoes to get 8 frequency bands. Based on the above steps, we can obtain features of sub-band energy, namely 8-dimensional matrices.
3.5 Multi-resolution singular spectrum entropy
Compared with the wavelet transform, the advantage of stationary wavelet transform is that it makes the detail and approximation coefficients have the same length with input signal. Stationary wavelet transform has the properties of time invariance and data redundancy which are conducive to recognize the jump information [18, 19]. It is significant for feature extraction.
The singular spectral entropy based on phase space reconstruction can effectively estimate the size of the mode information contained in the one-dimensional sequence, and combine it with stationary wavelet transform to characterize the size of the signal content of different frequency components. Phase space reconstruction is performed on the one-dimensional sequence x(t). Phase space reconstruction requires two parameters, length m and delay constant ��. The reconstructed matrix is as follows [20]:
 (7)
(7)
where T is called track matrix. Then, the sequence x(t), the length of which is n��+m, can be written as the track matrix which includes n time-lapse sequences, and the length of every sequence is m. The smaller the correlation of different rows in this matrix is, the greater the total number of non-zero singular values will be, which means the more kinds of patterns included in the signal. Therefore, the singular value information can be expressed by entropy, thereby indirectly reflecting the mode information contained in the signal, and the singular spectrum entropy can be written as the following formula:
 (8)
(8)
where ��i represents the singular value of the track matrix; pi represents the normalized spectral probability density.
The singular spectral entropy feature extraction process of stationary wavelet transform for substrate echo is as follows:
1) Stationary wavelet transform for L layers is carried out in the target signal. The stationary wavelet decomposition process can be referred in Ref. [21];
2) After m and �� are set, and then track matrix of the wavelet detail coefficients on level l (l=1, 2, ��, L) can be obtained;
3) Singular spectrum of the track matrix is calculated. Calculate the singular spectral entropy Hi according to the formula;
4) Finally, we can obtain the feature of singular spectrum entropy Fspe=(H1, ��, HL)T.
The length of the bottom echo is 700 points. The signal suitable for the length of the stationary wavelet transform is taken and the first 640 points of the echo are intercepted. Then, the wavelet coefficients of the seven scale spaces are obtained. The embedding dimension is 340 and the time delay is 300. The singular spectral entropy of the phase space reconstruction matrix is calculated, and the 7-dimensional singular spectral entropy feature of the stationary wavelet transform is extracted according to the above steps.
4 Feature processing method
Extracting multiple types of features can more fully describe the signal. However, extracting multiple types of features also increases the dimension of the feature. Due to the redundancy and correlation between the features, the classifier is more complicated and increased. The amount of calculation may even be counterproductive, and the classifier over-fitting phenomenon occurs, resulting in ��dimensionality disaster�� and lowering the classification recognition rate. In Section 3, the five features of cobalt crust and bedrock are extracted, and the dimension reaches 49. Therefore, it is necessary to reduce the dimension of the substrate echo features, and the features of cobalt crust and bedrock are reduced by the combination of feature transformation and selection.
4.1 Features transformation based on KFDA
The basic thought of KFDA is mapping the input data into a high-dimensional space H through nonlinear kernel mapping f, and then carrying on linear FDA in high-dimensional space H [22], thus realizing implicit nonlinear classification in the input space. KFDA can facilitate classification performance and simultaneously decrease the dimension of features. The calculation process of feature conversion using KFDA is as follows:
N is the total number of samples, and C is the total of all categories. Each sample  (i=1, ��, C), j=1, ��, Ni is a d-dimensional matrix. Here, Ni is the number of samples in class i.
 represents the sample k (k=1, ��, Ni) in class i, and xj is the sample j (j=1, ��, N). f(X) is the mapping of the input vector X in H. Within-class- scatter and between-class-scatter matrices
 and
and  can be defined as:
 (9)
(9)
 (10)
(10)
where is the mapping of sample
 in H; Pi is a priori probability for samples of class i, which is used to modify the equation, because the number of samples of each class is different; Pi is defined as Pi=Ni/N;
 is the mean of class i in H, which can be expressed as:
 (11)
(11)
In addition,  is the classes mean given by:
 (12)
(12)
The non-linear mapping f is applied in the samples, and then we need to seek a direction w to maximize the Fisher criterion:
 (13)
(13)
Clearly, it is impossible to solve w directly when H is very high, or even infinitely dimensional. To overcome this limitation, instead of mapping the sample explicitly to H, the formulation of algorithm which uses only inner-products  of the training patterns can solve the original problem [23], i.e.,
  Gaussian RBF kernels are possible choices as the kernel function K(x, y), which has been proved to be useful. Gaussian RBF kernels can be written as:
 (14)
(14)
Based on reproducing kernel theory, every solution w must depend on the span of all training samples in H. Hence, it can be expanded as:

 (15)
(15)
Samples in H, every mean of class  and classes meanare mapped to w. The following can be obtained:
 (16)
(16)

 (17)
(17)

 (18)
(18)
where  is the kernel sample; ui is the mean of kernel samples in class i and u is the mean of all kernel samples.
According to Eqs. (17) and (18), it can be rewritten as:
 where Kb and Kw are kernel between-class-scatter and kernel within-class-scatter matrices which can be written as:
 (19)
(19)
 (20)
(20)
Combining those, Eq. (12) can also be expressed as:
 (21)
(21)
The maximum of J can be found by solving the generalized characteristic equation of 
 Here, Kb and Kw are symmetric semi-definite matrices. The number of non-zero eigenvalues of the characteristic equation is no more than C-1.
Hence, the projection of the input samples onto w is:
 (22)
(22)
where  is the optimal projection vector set.
According to the above method, when the total number of categories of samples is C, the dimension after feature transformation does not exceed C-1. After using KFDA to reduce dimension of 3 types of substrates, the dimension becomes 2. Then, the features which are transformed by KFDA are combined in order of LPC, LPCC, modulus maxima, sub-band energy, and singular spectral entropy to obtain a combined feature with a dimension of 10. Different recognition performance of various features and different feature combinations will both produce different recognition results. Therefore, in order to obtain the optimal combination mode, the feature set needs to be selected.
4.2 Feature selection based on GA
In this paper, GA is applied in selecting optimal feature subsets. Feature matrices including LPC, LPCC, wavelet transform modulus maxima, sub-band energy of wavelet packet transform and multi-resolution singular spectrum entropy are integrated into one matrix in order. The basic principle of GA for feature selection is to find an optimal binary code, and each individual in the code corresponds to a feature vector [24]. In this study, the individuals are encoded by 10-bit binary vectors because the dimension of feature matrix processed by KFDA is 10. If the bit in the vector is 0, it represents that the corresponding feature is not selected, while the bit is 1, meaning that the corresponding feature is selected. Use the recognition result of the classifier as a fitness function. Selecting effective features can improve the performance of classifier. The common non- linear classifiers which include KNN, product- based neural network (PNN) and support vector data description (SVDD) are used to examine the effectiveness of GA, and the common non-linear classifiers which include KNN, PNN and SVDD are chosen. Optimal feature subsets for three kinds of classifiers are selected. The 6 steps of GA are as follows:
1) The features are coded using 10-bit binary vectors;
2) Generate initial population. N initial strings are randomly generated to form the initial population, and the number of the initial populations in this paper is 100;
3) Define the fitness function: Fitness function represents the superiority/inferiority of individuals. Based on the comprehensive consideration of the recognition rate and false positive rate of cobalt crust, combined with the average recognition rate of the three types of substrates, the following fitness function is designed:
 (23)
(23)
where d is the average classification accuracy of cobalt crust, bedrock 1 and bedrock 2; b is the correct recognition rate of cobalt crust; c is the false positive rate of cobalt crust; ��1, ��2 and ��3 are the corresponding weight coefficients. According to the requirements of this project, considering the average recognition rate and the correct rate and false positive rate of cobalt crust, set ��1=0.6, ��2=0.2, ��3=0.2. The parameters of the three classifiers are set as follows:
a) KNN: KNN algorithm predicts category of the test sample according to K training samples which are the nearest neighbors to test sample. The process of KNN was introduced in Ref. [25]. In this experiment, K is set to 5. We also experimented K=3, K=4 and K=6. However, the results of them are not satisfactory.
b) PNN: Since there is only one parameter needing to be set, PNN has the advantages of short training time and simple structure. The structure of PNN was introduced in Ref. [26]. The PNN includes four layers. The first layer is the input layer, which is responsible for the input of the training samples. The number of neurons is the same as the dimensions of the sample. The second layer is the pattern layer, including three pattern area neurons, corresponding to three types of substrates, and each zone contains 140 neurons, corresponding to 140 training samples. The third layer is the summation layer, and the number of neurons is 3, which is the total number of categories of sample. The fourth layer is the output layer, and the number of neurons is 3, corresponding to three types of substrate. After experimental simulation, when the smoothing parameter of the network is 0.3, it has a good average recognition rate.
c) Support vector data description (SVDD): The core idea of SVDD is to map the features of training samples to high-dimensional space through non-linear mapping. Subsequently, in the high dimensional space, an optimal supersphere including all or most of the training samples and having the smallest volume is determined. Finally, the testing sample is also projected into the high-dimensional space and the category of the sample is determined by the relative distance between the test sample and the center of the hypersphere [27]. The kernel function in SVDD is a Gaussian function. It is shown by simulation that when the kernel parameter �� is 0.4 and the penalty factor is C=0.72, the performance of classifier is better.
4) Individuals of current population are evaluated according to the fitness function. A new population is generated via applying genetic operations which include selection, crossover and mutation. The parent population is selected by using roulette wheel. The crossover probability is 0.9 and the mutation probability is 0.05. The mutation method is to randomly select two gene positions, and reverse the genes with mutation probability. The individual with the greatest fitness is copied into the new generation.
5) Set the generations: Here, the number of generations is 200. If the set of generations is reached, the best gene string is outputted. Otherwise, return to step 4 to continue the propagation.
6) Compare the total number of individual genes in the final population, and then the classification performance of the corresponding features of the gene can be obtained. The order of the total number of genes corresponds to the classification performance of the features.
5 Experimental results and discussion
5.1 Waveforms of substrates
Using the ultrasonic detection system described in Section 2, the substrates in clear water and reverberant environments are detected separately. The number of experiments is three. The waveform of the cobalt crust is shown in Figures 2 and 3.
It can be concluded from Figures 2 and 3 that there are differences between the samples of the same type of substrate; the received signal in the mining environment is obviously affected by the suspended sediment, gravel, etc. The amplitude of the echo is significantly reduced, and the received signal has multiple peak points due to the reflection of the sediment.
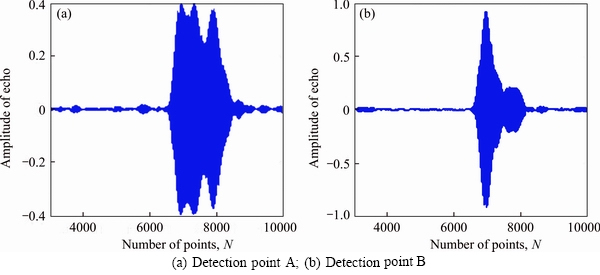
Figure 2 Waveforms of different detection points of cobalt crust in clear water:

Figure 3 Waveforms of different detection points of cobalt crust in turbid water:
5.2 Experimental results of feature transformation (KFDA)
According to the method of Section 4.1, we used KFDA to reduce dimension of features of 3 types of substrates. The feature distribution of an experiment is shown in Figures 4-8.
In the process of feature reduction, the optimal Gaussian kernel function parameters of LPC (��=0.005), LPCC (��=0.05), modulus maxima (��=0.007), sub-band energy (��=0.001), and singular spectral entropy (��=0.001) are determined in a range separately at first, and then a lot of experiments are conducted to find the optimal parameter.
It can be seen from the figures that the three types of samples with different features have overlapping regions, and the coordinate values of different features are also different. In order to verify the recognition performance of features, each transformed feature is identified by the k-nearest neighbors, and the number of neighboring points is 5. The recognition results transformed by KFDA are shown in Table 1.

Figure 4 Feature distribution of LPC:

Figure 5 Feature distribution of LPCC:

Figure 6 Feature distribution of wavelet transform modulus maxima:

Figure 7 Feature distribution of wavelet packet transform sub-band energy:
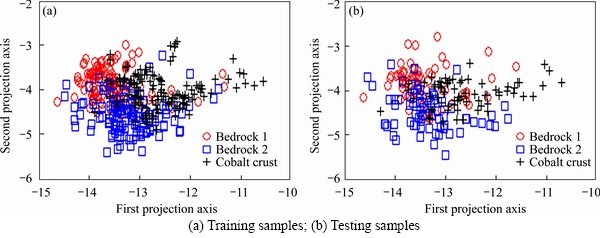
Figure 8 Feature distribution of singular spectral entropy:
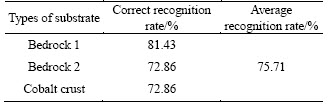
The features transformed by KFDA are combined in order of LPC, LPCC, modulus maxima, sub-band energy, and singular spectral entropy to obtain a combined feature with a dimension of 10, which is also identified by the k-nearest neighbors classifier. The number of neighboring points is 5, and the classification results are shown in Table 2.
It can be seen from Tables 1 and 2 that compared with single feature recognition, the average recognition rate of combined feature is higher than that of all single feature, reaching 75.71%, the highest increase is 12.85%, and the recognition rates of the three types of substrates are improved. It can be seen that the multi-feature combination recognition has a better performance than single feature recognition. However, because of different recognition performances of various features, different feature combinations will produce different recognition results. Therefore, in order to obtain the optimal combination mode, the feature set needs to be selected.
Table 1 Recognition results of single feature

Table 2 Recognition results of combined feature
5.3 Experiment results of feature transformation-subset selection (KFDA-GA)
The bottom echo in three experiments was obtained by experimental measurement. Firstly, the amplitude of the received echo is normalized, and the echo starting point is calculated by the cross-correlation method, and 700 points of the signal are intercepted as echoes. Each type of substrate contains 210 samples. Considering the randomness and differences of the samples, 140 samples are selected for training and 70 samples are used for test identification effect. In the final experiment, cobalt crust is used as a kind of substrate alone, and bedrocks 1 and 2 are used as a kind of substrate to evaluate the recognition performance of cobalt crust. The recognition results include the correct recognition rate and false positive rate of cobalt crust. KFDA is used to transform the features at first; KNN, PNN, and SVDD are used as classifiers to classify and identify the substrate echoes before and after the feature selection of the GA. The recognition results are listed in Tables 3 and 4.
Table 3 Cobalt crust recognition results using KFDA with or without GA in mining environment
It can be concluded from the above tables that the recognition rate of cobalt crusts with multiple features in clear water is more than 90%. At this time, after the genetic algorithm performs feature selection, the recognition rate of cobalt crust is not significantly improved. And the false positive rate of cobalt crust slightly decreases, the slight decline is mainly due to the fact that many types of features have been able to describe the characteristics of the underlying signal, which contains only a small amount of redundant information.
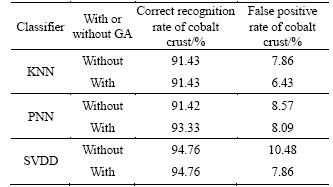
Similarly, the cobalt crusts in the mining environment are recognized, while after feature selection by genetic algorithm, the best gene string of KNN classifier is [01001111111]; the best gene string of PNN is [0010010111]; the best gene string of SVDD is [1111010111]. Features corresponding to position 1 in gene string are selected for combination, and the results of the genetic algorithm before and after the feature selection are shown in Table 4.
Table 4 Cobalt crust recognition results using KFDA with or without GA in mining environment

It can be concluded from the above tables that after the GA performs feature selection, the recognition rate of cobalt crusts has been significantly improved, and the highest increase is 11.43%. The main reason is that the features of the direct combination include the information of the reverberation environment, and the classification information of the substrate is weakened. After the feature selection, the features which contain the reverberation information are removed, so the recognition rate of the cobalt crust is significantly improved, which proves that the recognition performance of KFDA-GA is better than the direct combination of features after dimension reduction using KFDA.
In Ref. [28], only GA is used for feature selection in the dimensionality reduction process of the feature. To compare the effectiveness of the KFDA-GA algorithm, the original 49-dimensional features are selected by GA without feature transformation, and KNN, PNN, and SVDD are used as classifiers, respectively. The classifier and GA parameters are set in the same way as before. The cobalt crust in the simulated mining environment is recognized. The average of the three experimental results is obtained, and the recognition results are shown in Table 5.
Compared with the results of the KFDA-GA method in Table 4, the correct recognition rate of cobalt crusts in Table 5 is lower than the correct recognition rate of KFDA-GA method, especially the correct recognition rate of SVDD classifier, which is reduced by 17.14%. The correct recognition rate of KNN classifier is reduced by 14.29% and the correct recognition rate of PNN classifier is reduced by 2.85%. Although the false positive rate of cobalt crust in Table 5 is also slightly decreased, in general, the dimensionality reduction method combining feature transformation and feature selection is better than only feature selection.
Table 5 Cobalt crust recognition results only using feature selection (GA) but not feature transformation (KFDA) in mining environment

5.4 Discussion
The sediment echo in the reverberation environment is collected in the laboratory, and the multi-class features of the echo are extracted. The features are transformed by KFDA and the combined features are selected by GA. However, whether other types of signal feature extraction methods can be applied to cobalt crusts, and the features of signals can be further extracted to select a better subset of features will be the next step.
In the real mining environment, the degree of reverberation in water is different. Due to the limitations of experimental conditions, only one reverberation environment can be simulated, which means that the degree of reverberation is only one and only one type of echo data is processed. The experimental device should be improved to collect signals of different reverberation degrees in subsequent studies. A corresponding classification model is established for each signal within the reverberation range to establish a cobalt crust identification system in a real mining environment.
6 Conclusions
In order to solve the problem of identifying cobalt crust in deep sea, features are extracted, including LPC, LPCC, characteristic matrices of wavelet transform modulus maxima, sub-band energy of wavelet packet transform and multi-resolution singular spectrum entropy of stationary wavelet transform. Each characteristic matrix is projected to a lower-dimensional space by KFDA. Then, we can obtain five new matrices, and they are integrated into one matrix. GA is used to select better feature subsets. KNN, PNN and SVDD are applied to identify the materials through the feature subsets. The results confirmed that the method proposed to classify the seafloor materials located in mining area has the following advantages: 1) It is better than KFDA feature transformation or GA feature selection in the recognition of sediment in reverberation environment. Compared with the dimension reduction method using KFDA feature transformation only, the recognition rate of cobalt crust is increased by 11.43%. Compared with GA feature selection only, the recognition rate of cobalt crust is increased by 17.14%. 2) Echo features are extracted to describe the signals more comprehensively. However, other types of feature extraction methods still need to be studied in order to further improve the recognition rate of cobalt crusts in reverberation environment. This test is currently under study.
Contributors
The overarching research goals were developed by ZHAO Hai-ming, HAN Feng-lin, and WANG Yan-li. WANG Yan-li and ZHAO Xiang provided the measured Cobalt-rich crust echo data, and analyzed the measured data. ZHAO Hai-ming, WANG Yan-li and ZHAO Xiang established the models and calculated the predicted displacement. WANG Yan-li and ZHAO Xiang analyzed the calculated results. The initial draft of the manuscript was written by ZHAO Xiang, ZHAO Hai-ming and HAN Feng-lin. All authors replied to reviewers�� comments and revised the final version.
Conflict of interest
ZHAO Hai-ming, ZHAO Xiang, HAN Feng-lin and WANG Yan-li declare that they have no conflict of interest.
References
[1] JAVIER R J, KIM Y. Application of linear predictive coding for human activity classification based on micro-doppler signatures [J]. IEEE Geoscience & Remote Sensing Letters, 2014, 11(10): 1831-1834.
[2] YANG San-wei, CAO Jiu-wen, WANG Jian-zhong. Acoustics recognition of construction equipments based on LPCC features and SVM [C]// Proceedings of the Control Conference. IEEE, 2015: 3987-3991.
[3] MA Yan, LI Zhi-shun. On improving feature extraction and identification of underwater wideband echo with orthogonal wavelet packet [J]. Journal of Northwestern Polytechnical University, 2003, 21(1): 54-57. (in Chinese)
[4] ZHAO Jian-ping, HUANG Jian-guo, XIE Yi-qing, ZHANG Hua-feng. Transient feature extraction and discrimination of wideband echos based on wavlet transform [J]. Acta Acustica, 1998, 23(1): 31-38. 10.15949/j.cnki.0371-0025. 1998.01.004. (in Chinese)
[5] LIU Jian-guo, LI Zhi-shun, LIU Dong. Features of underwater echo extraction based on SWT and SVD [J]. ACTA ACUSTICA-PEKING-, 2006, 31(2): 167-172. (in Chinese)
[6] BU Ying-yong, ZHANG Chao, NIE Shuang-shuang. Tail-wave envelop feature extraction of an underwater echo based on discrete wavelet transform [J]. Journal of Zhengzhou University (Engineering Science), 2007, 28(4): 80-83. (in Chinese)
[7] LIU Huan, HIROSHI M. Feature transformation and subset selection [J]. IEEE Intelligent Systems, 1998, 13(2): 26-28.
[8] ZHOU Mu-rong. Research on recognition of deep-sea cobalt crust based on acoustic fractal features [D]. Changsha: College of Mechanical and Electrical Engineering, Central South University, 2009: 41-54. (in Chinese)
[9] XU Xiao-na, MU Zhi-chun , LI Yuan. Feature-level fusion method based on KFDA for multimodal recognition fusing ear and profile face [C]// Proceedings of the International Conference on Wavelet Analysis and Pattern Recognition. Piscataway, USA: IEEE, 2007, 3: 1306-1310.
[10] ZHAO Hai-ming, JI Ya-qian, HONG Yu-jiu, QI Hao, MA Li-yong. A Volterra series-based method for extracting target echoes in the seafloor mining environment [J]. Ultrasonics, 2016, 71: 29-39.
[11] QI Hao, ZHAO Hai-ming, JI Ya-qian, WANG Yan-li. Experimental device for simulating reverberation environment in deep sea mining [J]. Chinese Journal of Engineering, 2017, 39(5): 655-662.
[12] ZHAO Hai-ming, WANG Yan-li, HAN Feng-ling, JI Ya-qian, LUO Bo-wen. Acoustic pressure simulation and experiment design in seafloor mining environment [J]. Journal of Central South University, 2018, 25(6): 1409- 1417.
[13] ZHU Wei, JIN Pin, TAO Liang-xiao, TANG Yun-kai. The seismic signal based target recognition of moving vehicles [C]// National Safety Geophysics Series (VII)-Geophysical and Nuclear Exploration. China, Xi��an: Xi��an Map Publishing House, 2011: 394-400. (in Chinese)
[14] CAO Ding. Research on human pulse signals recognition algorithm based on cepstrum features [D]. Chongqing: Chongqing University. College of Communication Engineering, 2009: 19-35. (in Chinese)
[15] GE Xin-min, FAN Zhuo-ying, FAN Yi-ren, LI Run-ze, XU Yong-jun. Oil/water contact prediction of complex reservoir using kernel principal component analysis and wavelet power spectrum analysis [J]. Journal of Central South University, 2015, 46(5): 1747-1753. (in Chinese)
[16] WANG Zong-liang, CHANG Jun, ZHANG Sa-sa, LUO Sha, JIA Cuan-wu, SUN Bo-ning, JIANG Shuo, LIU Yong-ning, LIU Xiao-hui, LV Guang-ping, LIU Zhi. Application of wavelet transform modulus maxima in raman distributed temperature sensors [J]. Photonic Sensors, 2014, 4(2): 142-146.
[17] EKICI S, YILDIRIM S, POYRAZ M. Energy and entropy-based feature extraction for locating fault on transmission lines by using neural network and wavelet packet decomposition [J]. Expert Systems with Applications, 2008, 34(4): 2937-2944.
[18] NASON G P, SILVERMAN B W. The stationary wavelet transform and some statistical applications [J]. Science, 1995, 346(6212): 918-919.
[19] GALIANA-MERINO J J, ROSA-HERRANZ J L, PAROLAI S. Seismic phase picking using a kurtosis-based criterion in the stationary wavelet domain [J]. IEEE Transactions on Geoscience & Remote Sensing, 2008, 46(11): 3815-3826.
[20] ZHU Yan-wei, SHI Xin-chun, LI Peng. Classification of islanding and grid disturbance based on multi-resolution singular spectrum entropy and SVM [J]. Proceedings of the Csee, 2011, 31(7): 64-70.
[21] NASON G P, SILVERMAN B W. The stationary wavelet transform and some statistical applications [M]. New York: Springer, 1995: 281-299.
[22] KODIPAKA S, VEMURI B C, RANGARAJAN A, LEONARD C M, SCHMALLFUSS I, EISENSCHENK S. Kernel fisher discriminant for shape-based classification in epilepsy [J]. Medical Image Analysis, 2007, 11(1): 79-90.
[23] MIKA S, RATSCH G, WESTON J, SCHOLKOPF B, MULLER K R. Fisher discriminant analysis with kernels [C]// Proceedings of the Neural networks for signal processing IX: Proceedings of the 1999 IEEE Signal Processing Society Workshop (cat. no. 98th8468). Piscataway, USA: IEEE, 1999: 41-48.
[24] TAN Feng, FU Xue-zheng, ZHANG Yan-qing, Anu G Bourgeois. A genetic algorithm-based method for feature subset selection [J]. Soft Computing, 2008, 12(2): 111-120.
[25] ZHOU Yong, LI You-wen, XIA Shi-xiong. An improved knn text classification algorithm based on clustering [J]. Journal of Computers, 2009, 4(3): 230-237.
[26] WANG Shu-lin, LI Xue-ling, Zhang Shan-wen, GUI jie. Tumor classification by combining PNN classifier ensemble with neighborhood rough set based gene reduction [J]. Computers in Biology and Medicine, 2010, 40(2): 179-189.
[27] FENG Guo-yu, XIAO Huai-tie, FU Qiang, HUANG Meng-jun. Method of radar target classification based on adaptive SVDD [J]. Systems Engineering and Electronics, 2011, 33(2): 253-258. (in Chinese)
[28] AZIMI-SADJADI M R, YAO De, HUANG Qiang, DOBECK G J. Underwater target classification using wavelet packets and neural networks [J]. IEEE Transactions on Neural Networks, 2000, 11(3): 177-182.
(Edited by ZHENG Yu-tong)
���ĵ���
���ں�Fisher�б�������Ŵ��㷨�Ļ��컷�����ܽ��ʶ��
ժҪ���ܽ�Dzɿ������ʵ�ʶ���ܹ���߲ɿ�Ч�ʡ���Ե�һ����ʶ���ܽ�Dzɿ�������Ч���ϲ�����⣬�����һ�ֻ��ڶ����������ܽ�Dzɿ�������ʶ�����÷�����������Ԥ���С��������ȡ��Ŀ��ز�������Ԥ��ϵ��������Ԥ���ϵ�����ֱ�õ���ģ����ֵ���Ӵ������Ͷ�ֱ����������ص���������Ȼ���ú�Fisher�б����(KFDA)�Եõ�����������ѹ������������Ŵ��㷨(GA)�������������ѡ�õ����������Ӽ���������������ʶ������Ϊ�Ŵ���Ӧ�Ⱥ������÷������ŵ����ܹ���ȫ��������ź�������ѡ����������������ȵ�ȥ������������ʵ����֤�����뵥��ʹ��KFDA��GA��ȣ�ʶ���ʵõ�����ߡ�
�ؼ��ʣ�������ȡ��KFDA���Ŵ��㷨�������������ܽ��ʶ��
Foundation item: Project(51874353) supported by the National Natural Science Foundation of China; Project(GCX20190898Y) supported by Mittal Student Innovation Project, China
Received date: 2020-01-10; Accepted date: 2020-06-02
Corresponding author: HAN Feng-lin, PhD, Associate Professor; Tel: +86-15116280987; E-mail: hanfl@csu.edu.cn; ORCID: https:// orcid.org/0000-0003-4392-9752
Abstract: Recognition of substrates in cobalt crust mining areas can improve mining efficiency. Aiming at the problem of unsatisfactory performance of using single feature to recognize the seabed material of the cobalt crust mining area, a method based on multiple-feature sets is proposed. Features of the target echoes are extracted by linear prediction method and wavelet analysis methods, and the linear prediction coefficient and linear prediction cepstrum coefficient are also extracted. Meanwhile, the characteristic matrices of modulus maxima, sub-band energy and multi-resolution singular spectrum entropy are obtained, respectively. The resulting features are subsequently compressed by kernel Fisher discriminant analysis (KFDA), the output features are selected using genetic algorithm (GA) to obtain optimal feature subsets, and recognition results of classifier are chosen as genetic fitness function. The advantages of this method are that it can describe the signal features more comprehensively and select the favorable features and remove the redundant features to the greatest extent. The experimental results show the better performance of the proposed method in comparison with only using KFDA or GA.
