
Trans. Nonferrous Met. Soc. China 23(2013) 1854-1862
Electrochemical noise of copper anode behaviour in industrial electrolyte using wavelet analysis
F. SAFIZADEH, E. GHALI
Department of Mining, Metallurgy and Material Engineering, Laval University,  G1V 0A6, Canada
Received 2 July 2012; accepted 27 November 2012
Abstract:
Electrochemical noise (EN) data were measured during the dissolution and passivation of an Cu-Pb anode at 65 ��C in 1 L industrial electrolyte containing 2 mg of gelatine and 4 mg of thiourea. The EN data corresponding to three stages or regions of active, pre-passive and passive on chronopotentiogram curve were analyzed by wavelet transform technique. The results reveal the pitting type of localized corrosion form during both active and pre-passive stages under a constant current density of 215 mA/cm2. During the passive stage, a general corrosion form accompanied by oxygen evolution was observed.
Key words:
electroctrochemical noise; corrosion; wavelet transform; copper; additives; chronopotentiometry;
1 Introduction
Various organic and inorganic additives are used during copper electrorefining in order to prevent formation of defects such as nodules and dendrites as well as to increase the smoothness of cathodic deposit. Three different additives (gelatine, thiourea and chloride) are typically used in the electrorefining process. Gelatine is a levelling agent, while thiourea acts as a grain refining agent during electrodeposition. However, the presence of additives in the electrolyte can influence copper anodic passivation as well as deposition on cathode surface. Passivation is one of the principal problems of copper electrorefining industry that can lead to a reduced production efficiency and increased power consumption. The influence of additives on passivation of copper alloys and especially passivation time under galvanostatic mode is investigated by many researchers [1-4]. However, the corrosion form of copper alloys has not been adequately studied by researchers under this condition. Many researchers have used electrochemical noise measurements (ENM) to describe the spontaneous fluctuations of the potential and current as a function of time. Using specific electrochemical noise (EN) measurement techniques, those fluctuations are recorded and then analysed through various mathematical treatment methods. The EN measurement technique can be applied to establish a correlation between the results of analyses, the morphology of deposit, the mechanism of electrocrystallization, the preferred orientation of different electrodeposited elements and the crystal growth processes [5-9]. To investigate a wide variety of corrosion processes, the EN analysis has also been applied since 1980s [10]. These analyses of EN can be principally performed employing a statistical method in time domain or spectral in frequency domain. Another almost new technique of EN analysis is called wavelet transform (WT). This technique is used to study the corrosion processes. The wavelet analysis technique is used to establish a correlation between the morphology and different events produced on the metal surface during corrosion process [11-17]. WT technique is well suited to study the signals containing numerous non-stationary or transitory characteristics, such as drift, trends, abrupt changes, beginnings and ends of events [18]. Distribution energy of EN signals can be illustrated in form of an energy distribution plot (EDP) that can be related to form, type or severity of corrosion. The position of maximum relative energy at each crystal vs crystal name on EDPs is representative of the behaviour of the important process of corrosion.
In our previous work [19], the corrosion behaviours of pure copper, Cu-Pb and Cu-Sb alloys in standard electrolyte under galvanostatic condition have been studied by statistical, fast fourier transform (FFT) and wavelet analyses techniques. Wavelet technique is identified as a powerful technique to monitor the copper corrosion and approach of the passive onset during refining. Following previous work, it is interesting to know if wavelet technique is also extensible and applicable in the presence of additives during refining. More information is needed to understand the corrosion behaviour of Cu-Pb anode in a simulated industrial electrolyte during different stages of corrosion of copper anode under galvanostatic condition. This is necessary to confirm the high efficiency of wavelet technique as a promoting tool in order to monitor corrosion phenomenon and approach of the passive onset during copper electrorefining. Gelatine and thiourea are considered the most important additives currently used in copper electrorefining or electrowinning industry. These additives have been introduced in standard electrolyte to simulate an industrial bath. Moreover, in previous work [19], surface morphology has been verified only by scanning electron microscopy (SEM) analyses. In the current work, in addition to SEM, more critical techniques were used such as profilometry (DekTak) and atomic force microscopy (AFM) to carry out a profound study on the surface morphology and corrosion form in each stage of galvanostatic tests. This should be useful to confirm exactitude and accuracy of the results obtained by wavelet technique about different forms of corrosion. It should be noted that concentration ratios of additives were chosen based on previous published work [20]. The optimum combination of additives was found to be equal to 2 mg/L of gelatine and 4 mg/L of thiourea (G2T4) which resulted in best copper cathodic morphology in laboratory conditions.
2 Experimental
2.1 Materials and methods of investigation
An industrial Cu-Pb alloy containing 0.37% lead [19] was employed as anode for corrosion tests. The standard (STD) electrolyte was composed of 42 g of Cu2+, 18 g of Ni2+, 40 mg of Cl- and 160 g of H2SO4. The additives including 2 mg/L gelatine and 4 mg/L thiourea were added to the standard electrolyte (G2T4). The G2T4 electrolyte was heated and thermostated at (65��1) ��C using a flow of water in a double-wall cell. The electrolyte was stirred very slightly with a magnet (d1 cm��2.5 cm) at a rotation rate of 60 r/min during the experiments. It has already been verified in our previous work that this slow stirring has no defective influence on EN signals recorded during tests [19]. 316L stainless steel was used as cathode and mercurous saturated (MSE or saturated Hg/Hg2SO4=0.64 V(vs SHE) as a reference electrode. The cathode and anode were mounted on a Teflon holder with a distance fixed at 2.5 cm between electrodes. The specimen was embedded in epoxy resin and ground with a silicon carbide paper from 400 to 1000 grit, washed with deionized water, rinsed with ethanol and dried with an electric dryer before each test. All experiments were performed under galvanostatic condition with constant current density of 215 mA/cm2. An industrial Cu-Pb alloy containing 3.7% lead [19] was employed as anode for corrosion tests. This optimum current density was chosen in order to obtain enough blocks of data points for analysis at various stages of dissolution passivation on chronopotentiogram. This was required as an essential condition prior to performing a good analysis of EN data.
For microscopic characterization, the surface of each specimen was mechanically polished with 400-1000 grit SiC papers and diamond powder paste (1-6 ��m) to obtain a mirror surface before starting the test.
EN records and treatment of data points were performed using a GAMRY PC4 750/ESA400 software and analyser v. 2.35. EN measurement records specified 1024 data points were collected at a scan rate of fs=10 Hz.
Scanning electron microscopy (SEM) analyses were performed using a JEOL JSM-25s III microscope equipped with an energy dispersive X-ray analyzer. Atomic force microscopy (AFM) was employed to study the surface roughness of corroded surface. Three roughness parameters of Ra (mean deviation from the measured center line), Rq (the average of root mean square of height deviation taken from the mean center line) and Rt (maximum peak to valley height) were measured using Dektak 3 surface profiler. An AFM digital instrument of Veeco dimension V with a scan rate of 0.7 Hz and scan size of 50 ��m was used to take the surface images of the specimens.
2.2 Fundamentals of wavelet analysis
The EN data were analyzed using wavelet technique. The discrete wavelet analysis (DWT) was also used for the analysis of EN data in this work. ABALLE et al [12] have already explained the basis of this type of analysis in details. In this technique, an original signal that can be expressed as a time series record; xn (n=1, 2, ��, N) on a Cartesian basis passes through two complementary filters called high-pass and low-pass filters. The time record xn is presented using a linear combination of the basis functions  j,n and ��j,n[22]:

 (1)
(1)
where SJ,k, dJ,k,��, d1,k are the so-called wavelet coefficients; j=1, 2, ��, J; J is a small natural number depending mainly on N, the basis function and k=1,2, ��, N/2j. The scale of each crystal is presented by subscript j while J is the maximum scale analyzed. The mentioned basis functions are generated from mother wavelet �� and father wavelet �� via translation and scaling, respectively, as follows:
 (2)
(2)
 (3)
(3)
The mother wavelet function �� is determined by the high-pass filter which also produces the details of the wavelet decomposition. The scaling function of father wavelet is determined by low-pass filter and is associated with the approximation of the wavelet decomposition. In Eqs. (2) and (3), 2j acts as the scale factor and 2jk as the translation parameter. According to Eqs. (2) and (3), the resolution is defined as 2-j and the frequency decreases with increasing J level [23].
During signal decomposition, two sets of wavelet coefficients so-called approximations a and the details d are produced. The set of smooth coefficients S or A contains the information of the general trend of the signal while the set of detail coefficients D gives the information on the local fluctuations and smallest features in the signal. The approximations are high-scale and low frequency components of the signal. The details are the low-scale and high frequency components. Each of these coefficients is called a crystal.
Using the computed coefficients, an energy distribution plot (EDP) can be plotted which presents the accumulated relative energy by each crystal vs crystal name.
The overall energy of the signal is calculated as follows [12]:
 (n = 1, 2, ��, N) (4)
The fraction of energy associated with each crystal can be calculated as:
 (j = 1, 2, ��, J) (5)
 (j = 1, 2, ��, J) (6)
Since the chosen wavelet is orthogonal, the total energy of the signal can be expressed as:
 (7)
(7)
In this research, the decomposition of signals is performed using multi-signal analysis of MatLab wavelet toolbox. The orthogonal db4 wavelet is employed to analyse the recorded signal considering j=8 for the number of scales. The block of sampling data specify 1024 data points during every 102.4 s. The mean value is removed from original signal.
3 Results and discussion
3.1 Chronopotentiometry study
The Cu-Pb is introduced in an industrial simulated electrolyte containing additives and is exposed to a constant current density of 215 mA/cm2. As mentioned in previous work [19], Cu-Pb anode has an inhomogeneous structure including some lead particles in the form of agglomerated precipitates in the bulk of the alloy.
Figure 1 shows the chronopotentiogram of Cu-Pb anode. Three specific regions are observed, active dissolution region (330-700 s), pre-passive (700-835 s) and passive (905-1555 s) regions. These regions could be generally explained as follows.

Fig. 1 Chronopotentiogram of Cu-Pb anode at 215 mA/cm2 during anodic electrodissolution in presence of additives
Region I In the active region, the anodic dissolution of metal under high current density can be observed. The dissolution of copper can be illustrated by the following reaction producing a stable passive layer of cuprous oxide (Cu2O) considering low potential of this reaction [24]:
2Cu+H2O=Cu2O+2H++2e-ECu2O/Cu=-134 mV (vs MSE) (8)
It should be mentioned that contrary to stable appearance of potential in active region, the potential values in the time domain increase slightly during this region.
It should be indicated that applying constant current density (CD) for metal dissolution does not mean that a constant corrosion rate on metal during the test has been established. The corrosion rate can be changed during the experiment because of the following reasons:
1) The presence of different reactions consumes the imposed current as:
Cu��Cu2++2e- (9)
Cu��Cu++e- (10)
The formation of Cu+ dissolves two times more metal than that of Cu2 + for one faraday.
The equilibrium between the concentration (activity) of these two copper species in solution at 25 ��C is expected to be established as a function of time according to the following equation [21]:
 (11)
(11)
The consumption of Cu+ by existing Cl- in solution or impurities in anode such as selenium increases the rate of Cu+ formation, which leads to accelerated copper dissolution;
2) The anode surface is covered by various corrosion products that decrease the active surface, resulting in an increase of current passage through non-covered surface;
3) The presence of different phases in the microstructure of alloys leads to different corrosion rates as compared to that of one phase alloy (solid solution). The presence of impurities causes more consumption of current;
4) The increase of roughness of the anode during corrosion causes an increase of the surface and consequently decreases the current density.
Region II In the pre-passive region, the dissolution and precipitation of corrosion products happen successively, leading to the formation of a passive layer in temporary equilibrium on the anode surface. Considering the gradual increase of potential, the dominant reaction during stage II is expected to be the production of CuO (cupric oxide), as less stable and more soluble product as:
Cu+H2O=CuO+2H ++2e-ECuO/Cu=-34 mV (vs MSE) (12)
The cupric oxide is gradually introduced in the pores of passive layer of Cu2O. The saturation of Cu2+ at the interface of passive metal surface causes the formation of CuSO4. Increasing Cu+ ions at the interface promotes the reaction of 2Cu+=Cu2++Cu, leading to the formation of Cu powder. Copper sulfate and copper powder cover the surface of copper oxides layer, so anodic surface products generally consist of copper powder, copper sulfate and copper oxides (CuO and Cu2O) plus additional species coming from impurities depending on anode composition [24,25].
Figure 2 shows the pourbaix diagram of copper- water system in free corrosion mode at 25 ��C. Different parameters such as temperature, formation of corrosion products on the surface and accumulation of these products near the surface, lack of diffusion because of slow agitation and influence of additives on the surface can change the pH of reaction near the surface (about 10 ��m near the surface). Furthermore, high current density of 215 mA/cm2 conducts the dominant reaction to the trans-passive region of pourbaix diagram while this diagram is generally described for the active-passive region. All these parameters cause the instant change of pH near the surface where different reactants such as Cu2O and Cu+, and impurities such as Sb2O3 and Bi2O3 consume acid at the interface of metal/solution. Consequently, according to the pourbaix diagram, pH increase promotes the stability region of Cu2O.
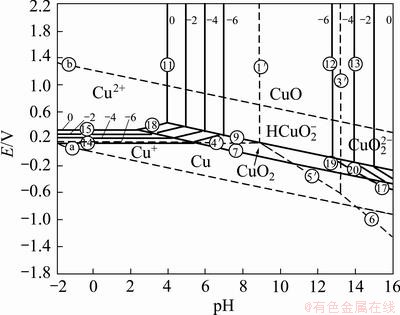
Fig. 2 Potential��pH equilibrium diagram for copper-water system at 25 ��C [20]
Region III During the passive stage, the formation of stable passive layer of Cu2O becomes the dominant reaction. It should be noted that in this region, the reaction of 1/2O2+Cu2O=2CuO is also accelerated in the presence of oxygen. In addition, considering high potential in the passive region, the formation of oxygen from oxidation of water is promoted.
Following stage III, many non-stable transitory active-passive stages appear again probably due to the lack of enough passive products on the metal/solution interface.
Figures 3-5 show the potential variations of chronopotentiogram of the Cu-Pb anode for 20 s after removing the DC drift in all the three regions.
According to Fig. 3, the amplitude of fluctuations is slightly enlarged in the last stage at 675 s comparing to the first sampling stage at 350 s of the active region in electrolytes containing additives G2T4.

Fig. 3 Chronopotentiograms of Cu-Pb anode at 215 mA/cm2 in active region at 350 s (a) and 675 s (b) in G2T4 electrolyte
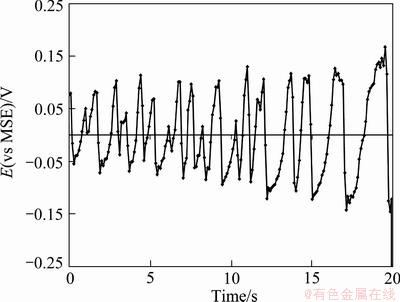
Fig. 4 Chronopotentiogram of Cu-Pb anode at 215 mA/cm2 in pre-passive region (II) at 814 s in G2T4 electrolyte
Figure 4 shows the last stage of the pre-passive region where the fluctuations gradually increase before passivation onset (potential jump to high values). These fluctuations happen because the pores of the anode surface are blocked and unblocked by the formation of CuSO4��5H2O salt. Therefore, the precipitation and dissolution of this salt can manifest as small chaotic oscillations at the first few stages of Region II where synchronization begins [26]. Then, the potential gradually increases and approaches to the required potential level for the formation of cuprous oxide (Cu2O). The surface coverage increases gradually due to slimes, copper sulfate and copper oxide, which can cause the increase of the pre-passive oscillations at the final stages of Region II.

Fig. 5 Chronopotentiogram of Cu-Pb at 215 mA/cm2 in passive region III at 940 and 1160 s (a) and 1460 s (b) in G2T4 electrolyte
Figure 5 illustrates different sampling time of chronopotentiogram in the passive region. Since the fluctuation forms are very irregular and different in Region III, it is not easy to find a representing model. When the potential approaches 1.2 V(vs SHE) (passive stage), depending on the pH at the interface, the following phenomena could be observed: 1) vigorous oxygen evolution leading to formation of a relatively passive film; 2) replacement of the stable passive layer of Cu2O by CuO (cupric oxide).
Unfortunately, the mechanism of reaction on anode is not completely clear. However, it seems from our previous studies [19] that the additives influence the mechanism of passivation through their ability of formation of cuprous ions (Cu+) complex. According to the work by MOATS et al [27], the complexing effect can be beneficial through less generation of copper products within the slimes (resulting from the disproportionation reaction of Cu+ ions) and slow formation of cupric ion concentration at the anode (the precipitation of CuSO4��5H2O in the presence of Cu2+ ions), resulting in a decrease of the stability of Cu2O passive film.
3.2 Wavelet analyses
The overall energy of recorded signals on chronopotentiogram of Cu-Pb in the presence of additives (2 mg/L gelatine and 4 mg/L thiourea) is calculated in active and pre-passive regions as shown in Fig. 6(a).
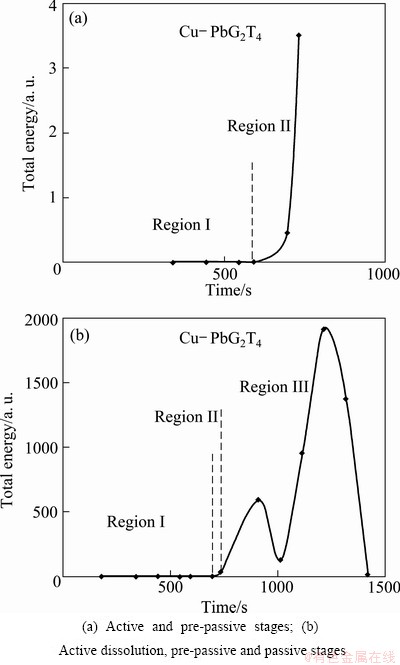
Fig. 6 Total energy of signal obtained from chronopotentiogram presented in Fig. 1
As shown in Fig. 6(b), the total energy of signals stays around zero during dissolution in the active region and then it is suddenly increased before passivation in the pre-passive region. Increasing total energy before passivation stage can be used as an important sign to predict an ultimate passivation in the system. In the passive region, the total energy is changed abruptly and irregularly between values of 13 and 1917 for this alloy.
Figure 7 shows the mean energy distribution plots (EDPs) corresponding to recorded potential noise in Fig. 1. The mean values of the energy accumulated on each crystal in three regions (I, II and IIII) are calculated and illustrated.

Fig. 7 Mean energy distribution plots of Cu-Pb in active, pre-passive and passive regions of chronopotentiogram presented in Fig. 1
It is seen that the contribution of approximation is very large as compared to detailed crystals in regions I and III. This accumulation of large part of energy in A8 is mainly an indication of low frequency part of original signal. Apart from the contribution of smooth crystal (A8), the variation of the relative energy in detailed crystals can be reflected by the dominant process in the electrode surface during the test. Since the contribution of the smooth crystal is too large compared to that of D crystals, the variations of detailed crystals could not be clearly observed. Therefore, the re-plotted mean EDPs are illustrated in Fig. 8 by discounting the contribution of approximation from the total of signal energy. According to Fig. 8, the maximum relative energy is accumulated more and more in short time scale crystals (D1-D3) from active region to the pre-passive region. Since the pit initiation has been widely accepted as a fast process and prior to any localized corrosion [15], the relative energy distribution in detailed crystals of D1-D3 can reflect the presence of this process on metal surface during active region. This phenomenon is confirmed by SEM images, where the existence of a more porous and rougher metallic surface is observed for the anode immersed in G2T4 solution.
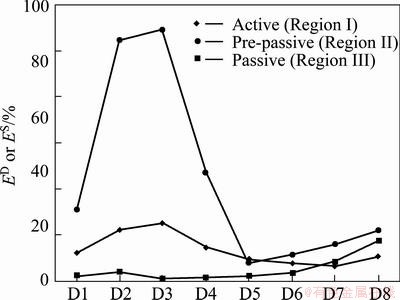
Fig. 8 Re-plotted mean energy distribution plots of Cu-Pb in active, pre-passive and passive regions discounting A8 crystal contribution
More and more energy on finer crystals, especially D2-D3 during pre-passive stage is concentrated due to the localized corrosion of electrode surface as shown in Fig. 9(a). Moreover, the formation of metastable pits is more fortified in this region. However, the autoacceleration of pitting corrosion and the surface fabrication due to thermodynamic effects can lead to a decrease in the number of small pits and formation of larger pits on the surface [28]. This form of localized corrosion can be found in SEM image as illustrated in Fig. 9(b).
In Region III, the domination of the energy in coarse crystals (D7-D8) is promoted. The domination of large time scale crystals can be due to general corrosion and evolution of oxygen bubbles. The SEM images of Cu-Pb specimen in Fig. 9(c) demonstrate that the metal surface seems less rough in Region III as compared to the other previous regions (I and II). In general, arriving to potential values more than 1.2 V/SHE in Region III, the strong oxygen evolution rate influences the overall dissolution rate of metal. This can be the reason for the fact that the anode surface seems generally smoother in Region III as compared to Regions I and II.

Fig. 9 SEM images of Cu-Pb specimen surfaces under constant current density of 215 mA/cm2 during pre-passive (a), active (b) and passive (c) regions with electrolytes containing additives
3.3 Surface morphology characterization
In order to verify the degree of roughness during various stages of anode dissolution and passivation, profilometry and AFM were used as two surface characterization tools. Profilometry technique helps to verify the intensity of corrosion in magnified scale while AFM images give a good estimation of surface roughness in small scales.
Four profilometry measurements were carried out on Cu-Pb electrode surface in each region of chrono- potentiogram (Fig. 1). The mean value of roughness parameters (Ra, Rq and Rt) is presented in Fig. 10. It can be seen that Ra decreases from active to pre-passive region, then increases in the passive region. Since this parameter represents the average roughness of surface, it can be generally deduced that the mean roughness decreases in the mentioned order for the three stages of dissolution and passivation. The root mean square of roughness or Rq indicates the level of significant variations in roughness. Regarding Fig. 10, the presence of large peak to valley is more considerable in the active stage than in the passive and the pre-passive stages. The maximum depth of pores is found for the region of passivation. In total, it can be concluded that the specimens sampled during active stage have rougher surface as compared to those in passive and pre-passive stages, and the samples collected during the passive stage have the smoothest surface, however, they contain some very deep pits. This characterization also confirms the results obtained by scanning electron microscopy technique.

Fig. 10 Profilometry measurements on Cu-Pb anode surface sampled before galvanostatic test for reference and under constant current density of 215 mA/cm2 for active, pre-passive and passive regions after electrolysis in presence of additives
The AFM surface images of the same specimens are shown in Fig. 11. These images clearly illustrate that the roughness starts to decrease from active region, then to the pre-passive and finally the passive regions, which is in accordance with the results obtained using SEM and profilometry techniques.
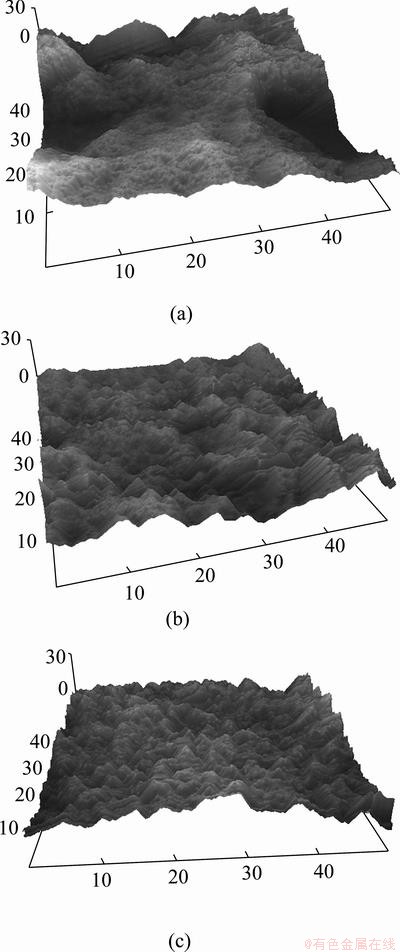
Fig. 11 AFM images of Cu-Pb anode surfaces sampled under constant current density of 215 mA/cm2 for active (a), pre-passive (b), passive regions (c) after electrolysis in presence of additives (Unit: ��m)
4 Conclusions
1) Wavelet analysis technique of electrochemical noise measurements was applied to study Cu-Pb alloy dissolution under galvanostatic mode.
2) During the active dissolution of copper, corrosion form contains pit initiation and growth in presence of additives under galvanostatic condition. During pre-passivation stage, localized corrosion is the dominant form of corrosion. Finally, during passivation, anode is exposed to non-uniform corrosion accompanied with oxygen evolution at specific sites.
3) WT technique of EN was successful to monitor the approach of passivation onset and corrosion behavior of copper anode in simulated industrial electrolyte containing additives during electrorefining. This confirms the utility and importance of wavelet technique as electrochemical tool to study galvanostatic systems under different environments.
Acknowledgments
The authors are grateful to the Electrometallurgical Consortium, Georges Houlachi from Hydro-Quebec Research Institute (LTE) at Shawinigan, Quebec Province, and the Natural Sciences and Engineering Research Council of Canada (NSERC) for their financial support.
References
[1] JIN S, GHALI E. Influence of some bath additives on the passivation of copper anodes in CuSO4�CH2SO4 electrolyte [J]. Canadian Metallurgical Quarterly, 1992, 31(4): 259-267.
[2] BRENT HISKEY J, CHENG X. Fundamental studies of copper anode passivation during electrorefining: Part III. The effect of thiourea [J]. Metallurgical and Materials Transactions B, 1998, 29(1): 53-58.
[3] OJAGHI I M, YOOZBASHIZADEH H, SADEGH S M. The effect of additives on anode passivation in electrorefining of copper [J]. Chemical Engineering and Processing, 2007, 46(8): 757-763.
[4] MOATS M S, BRENT HISKEY J. The role of electrolyte additives on passivation behaviour during copper electrorefining [J]. Canadian Metallurgical Quarterly, 2000, 39(3): 297-306.
[5] BLANC G, GABRIELLI C, KSOURI M, WIART R. Experimental study of the relationships between the electrochemical noise and the structure of the electrodeposits of metals [J]. Electrochimica Acta, 1978, 23(4): 337-340.
[6] YANG Zhong-mian, ZHANG Zhao, LENG Wen-hua, LING Ke, ZHANG Jian-qing. In-situ monitoring of nickel electrodeposit structure using electrochemical noise technique [J]. Transactions of Nonferrous Metals Society of China, 2006, 16(1): 209-216.
[7] ZHANG Z, LENG W H, CAI Q Y, CAO F H, ZHANG J Q. Study of the zinc electroplating process using electrochemical noise technique [J]. Journal of Electroanalytical Chemistry, 2005, 578(2): 357-367.
[8] BUDEVSKI E, OBRETENOV W, BOSTANOV W, STAIKOV G, DONEIT J,  K, LORENZ W J. Noise analysis in metal deposition-expectations and limits [J]. Electrochimica Acta, 1989, 34(8): 1023-1029.
[9] GABRIELLI C, KSOURI M, WIART R. Electrocrystallization noise: A phenomenological model [J]. Journal of Electroanalytical Chemistry, 1978, 86(1): 233-239.
[10] EDEN D A. Electrochemical noise [M]. San Diego: National Association of Corrosion Engineers, 1998: 386/1-386/31.
[11] KIM J J. Electrochemical noise analysis of localized corrosion by wavelet transform [J]. Metals and Materials International, 2010, 16(5): 747-753.
[12] ABALLE A, BETHENCOURT M, BOTANA F J, MARCOS M. Using wavelet transform in the analysis of electrochemical noise data [J]. Electrochemica Acta, 1999, 44: 4805-4816.
[13] SMITH M T, MACDONALD D D. Wavelet analysis of electrochemical noise data [J]. Corrosion, 2009, 65(7): 438-448.
[14] ZHANG Li-jun, ZHU Xu-bei, ZHANG Zhao, ZHANG Jiang-qing. Electrochemical noise characteristics in corrosion process of AZ91D magnesium alloy in neutral chloride solution [J]. Transactions of Nonferrous Metals Society of China, 2009, 19(2): 496-503.
[15] ZHAO B, LI J H, HU R G, DU R G, LIN C J. Study on the corrosion behavior of reinforcing steel in cement mortar by electrochemical noise measurements [J]. Electrochimica Acta, 2007, 52(12): 3976-3984.
[16] ZHANG T, SHAO Y, MENG G, WANG F. Electrochemical noise analysis of the corrosion of AZ91D magnesium alloy in alkaline chloride solution [J]. Electrochimica Acta, 2007, 53(2): 561-568.
[17] SHI Y, ZHANG Z, SU J, CAO F, ZHANG J. Electrochemical noise study on 2024-T3 Aluminum alloy corrosion in simulated acid rain under cyclic wet�Cdry condition [J]. Electrochimica Acta, 2006, 51(23): 4977-4986.
[18] MISITI M, MISITI Y, OPPENHEIM G. Matlab, Wavelet ToolboxTM 4 User's Guide, in Wavelets: A new tool for signal analysis [M]. The Math Work, Inc, 2008: 1-12.
[19] SAFIZADEH F, GHALI E. Monitoring passivation of Cu�CSb and Cu�CPb anodes during electrorefining employing electrochemical noise analyses [J]. Electrochimica Acta, 2010, 56(1): 93-101.
[20] SAFIZADEH F, LAFRONT A M, GHALI E, HOULACHI G. Monitoring the quality of copper deposition by statistical and frequency analyses of electrochemical noise [J]. Hydrometallurgy, 2010, 100(3-4): 87-94.
[21] POURBAIX M. Atlas of electrochemical equilibria in aqueous solutions [M]. Huston, USA: Nace international Cebelcor, 1974: 384-392.
[22] ABALLE A, BETHENCOURT M, BOTANA F J, MARCOS M, OSUNA R M. Wavelet transform-based analysis for electrochemical noise [J]. Electrochemica Acta, 1999, 47(9): 266-270.
[23] DONG Z, GUO X, ZHENG J, XU L. Calculation of noise resistance by use of the discrete wavelet transform [J]. Electrochemistry Communications, 2001, 3: 561-565.
[24] JIN S, GHALI E. Cathodic voltammetric study of copper passivation during electrorefining at 50 and 65 ��C [J]. Canadian Metallurgical Quarterly, 1993, 32(4): 305-319.
[25] JIN S, GHALI E, ADNOT A. XAES study on the passivation of copper anodes [C]//LAKSHMANAN V I, BAUTISTA R G, SOMASUNDARAN P. Emerging Separation Technologies for Metals and Fuels Palm Coast. Florida, USA: The Mineral, Metals & Materials Society, 1993: 169-182.
[26] MOATS M S, BRENT HISKEY J. How anodes passivate in copper electrorefining [C]//Copper 2010 Proceedings. Clausthal-Zellerfeld, Germany, 2010: 1463-1482.
[27] MOATS M, ROBINSON T, DAVENPORT W, KARCAS G, DEMETRIO S. electrolytic copper refining- 2007 world thankhouse opperating data [C]//HOULACHI G E, EDWARDS J D, ROBINSON T G. The Sixth Int Copper-Cobre Conference. Toronto, Canada: Canadian Institute of Mining, Metallurgy & Petroleum, 2007: 195-241.
[28] CAI C, ZHANG Z, CAO F, GAO Z, ZHANG J, CAO C. Analysis of pitting corrosion behavior of pure Al in sodium chloride solution with the wavelet technique [J]. Journal of Electroanalytical Chemistry, 2005, 578(1): 143-150.
ʹ��С��������ҵ�����ͭ������Ϊ�ĵ绯ѧ����
F. SAFIZADEH, E. GHALI
Department of Mining, Metallurgy and Material Engineering, Laval University, G1V 0A6, Canada
ժ Ҫ�����¶�Ϊ65 ��C������2 mg/L�ǽ���4 mg/L����Ĺ�ҵ���Һ�У�����Cu-Pb�Ͻ������ܽ�Ͷۻ��ĵ绯ѧ�������ݡ�ͨ��С���任����������ʱ��λͼ�����������ݷ�Ϊ��Ծ����Ԥ�ۻ����Ͷۻ�����ʵ�����������ں㶨�����ܶ�Ϊ215 mA/cm2�������£���Ծ����Ԥ�ۻ������ֵ�״�ֲ���ʴ�����ڶۻ�������־��ȸ�ʴ����������
�ؼ��ʣ��绯ѧ��������ʴ��С���任��ͭ�����Ӽ�����ʱ��λ������
(Edited by Jing-hua FANG)
Corresponding author: F. SAFIZADEH; Tel: +01-418-656-2131-4871, Fax: +01-418-656-5343; E-mail: Fariba.safizadeh.1@ulaval.ca
DOI: 10.1016/S1003-6326(13)62670-9
Abstract: Electrochemical noise (EN) data were measured during the dissolution and passivation of an Cu-Pb anode at 65 ��C in 1 L industrial electrolyte containing 2 mg of gelatine and 4 mg of thiourea. The EN data corresponding to three stages or regions of active, pre-passive and passive on chronopotentiogram curve were analyzed by wavelet transform technique. The results reveal the pitting type of localized corrosion form during both active and pre-passive stages under a constant current density of 215 mA/cm2. During the passive stage, a general corrosion form accompanied by oxygen evolution was observed.
