
Trans. Nonferrous Met. Soc. China 25(2015) 3664-3677
Effect of pH value and calcination temperature on synthesis and characteristics of Cu-Ni nano-alloys
Mar��a de los A. CANGIANO, Manuel W. OJEDA, Mar��a del C. RUIZ
Research Institute of Chemical Technology (INTEQUI), National University of San Luis-CONICET. Chacabuco y Pedernera, San Luis 5700, Argentine
Received 28 November 2014; accepted 16 July 2015
Abstract:
Cu-Ni nano-alloys were prepared using precursors synthesized by the citrate-gel method. The effects of initial solution pH value and calcination temperature on the composition, crystalline structure, purity, morphology, homogeneity and grain size of Cu-Ni nanoparticles were investigated. Both the parameters significantly affect the crystalline structure, composition and grain size. Cu-Ni alloys prepared at pH value of 1 do not contain impurities, and their compositions are Cu0.42Ni0.58, Cu0.45Ni0.55 and Cu0.52Ni0.48 reduced at 300, 400 and 500 ��C, respectively. The grain size grows with the increase of calcination temperature for the precursor prepared at pH values of 1.6 and 3. The Ni content of the alloys gradually increases with the increase of calcination temperature at pH value of 3.
Key words:
nanostructured Cu-Ni alloys; chemical synthesis; physicochemical characteristics; pH value; calcination temperature;
1 Introduction
Cu-Ni nano-alloys are utilized in a number of technologically important areas. Magnetic and nonmagnetic layered structures, such as Cu and Ni multi-layers, reveal giant magnetoresistance effects (GME). For this reason, they are used in the manufacturing processes of sensors for magnetic data recording and for monitoring the position of machine components [1]. Cu-Ni alloys coatings, which are electrochemically and thermally prepared, are used in the conversion of solar energy into a source of renewable energy, since they have a high solar absorbance and a low thermal emittance [2]. Similarly, Cu-Ni nano- powders present excellent catalytic properties which can be used in the dehydrogenation of cyclohexanol [3] and decomposition of methane [4]. Other applications include the use of Cu-Ni alloy seeds in hyperthermia applications aimed at the treatment of tumors [5] and in health care environments [6].
Recent studies have shown that the properties of materials depend on particle shape, surface area, homogeneity and degree of particle crystallinity. These characteristics are closely related to the preparation technique, therefore, a large number of chemical methods intended for preparing nanoparticles have been developed, such as sol-gel, hydrothermal and precipitation techniques, emulsion method [7,8].
The citric acid assisted sol-gel combustion process has been used for the preparation of nanocrystalline multi-component powders with desirable properties, such as lower crystallite size, controlled stoichiometry, narrow particle size distribution. In this process, citric acid is generally used as a chelating agent of metal cations. The polymerizing ability of the citric acid is effectively utilized for the formation of a colloidal solution, in which metal ions are uniformly distributed [9,10].
Combustion reactions are frequently applied for the preparation of different oxides. However, there are a limited number of publications referring to the effects of pH value and calcination temperature on the synthesis of Cu-Ni nano-alloys using precursors prepared by the citrate-gel method [11].
Different studies on the synthesis of materials using the citrate-gel method have been aimed at testing the influence of certain variables, such as the ratio between metallic ions, the ratio of acid citric to metallic ions, the pH value of the initial solution and the calcination temperature of the precursors, on the final products.
Cannas et al [12,13] studied the influence of various parameters which included the initial solution composition, the solution pH value, the gel formation method and the combustion temperature on the formation reaction of precursors prepared by the citrate-gel method. LIU et al [14] showed that the initial solution pH value and the molar ratio between the citric acid and metallic ions affected the homogeneity of the metal-citrate complexes, thus affecting the behavior during gel combustion and synthesized phases composition.
The solution pH value exerts a significant influence on citric acid ionization and on the type of complexes formed between citric acid and metal [15]. It has also been proved that the solution pH value of precursors significantly affected the gel morphology and porosity when the latter underwent a drying process [16]. In addition, the pH value has been proved to have an effect on the size of the material grain [8,17] and on the formation temperature of the materials [18].
Different authors have studied the effect of the calcination temperature on the characteristics of oxides and metallic oxides mixtures synthesized by the citrate-gel method. These authors have also observed that the calcination temperature significantly affected the grain size which growed as the calcination temperature increased [19-21]. Chen et al [22] prepared cerium oxide nano-powders, and observed that the rise of calcination temperature (473-1273 K) and the length of thermal treatment increased the crystallinity and the average crystallite size of the nanocrystallites ranging from 12 nm to more than 47 nm. Oh et al [23] demonstrated that the crystallite sizes and morphologies of Co3O4, CuO and NiO were influenced by calcination temperature. Based on the nano-thermodynamic theory, Guisbiers et al [24] confirmed that mixed Cu-Ni nanoparticles were difficult to be synthesized at room temperature and required a substantial heat treatment. In addition, they concluded that it is possible to control the structure of the alloy by adjusting the synthesis temperature. The melting behavior of Cu-Ni nanoparticles was modeled with a thermodynamic approach reported by Shirinyan et al [25] and Sopousek et al [26]. They predicted a depression of the solidus temperature, which was reported as size dependent.
This work focused on the systematic study of the influence exerted by pH value and calcination temperatures on the composition, crystalline structure, purity, morphology, homogeneity and grain size of Cu-Ni nanostructured alloys. These nano-alloys were prepared using precursors synthesized by the citrate-gel method, using solutions with different pH values. These precursors were later calcined at three different temperatures and reduced with H2 diluted in N2 to obtain Cu-Ni nano-powder alloys.
2 Calculation of species at equilibrium based on pH value
The acidity of the initial solution used to prepare the precursor of Cu and Ni oxides mixtures is very important due to the effect of this variable on the speciation and the complexing ability of citric acid. For this reason, and with the purpose of establishing the most appropriate working pH value for the synthesis of the Cu-Ni alloy, the theoretical calculation of equilibrium molar concentrations was performed on all species in the solution. Maple V  12 was the software used in the study, and the species considered for the analysis were the following:
1) Species of citric acid: H3L, H2L-, HL2- and L3-.
2) Complexes of citric acid formed with Cu(II): Cu(L)-, Cu(HL), Cu(H3L)2+ and Cu(OH)+.
3) Complexes of citric acid formed with Ni(II): Ni(L)-, Ni(HL), Ni(H2L)+ and Ni(OH)+.
where L is the citrate anion (C6H5O7)3-.
The concentrations used were n(Cu2+)=0.315 mol/L, n(Ni2+)=0.341 mol/L and n(H3L)=0.48 mol/L. The equilibrium constants used in the calculations were taken from bibliographic sources [27,28]. These theoretical results show that Cu2+ and Ni2+ mainly form Cu(L)- and Ni(L)-, which are stable in the pH value range of 1-14. The rest of the complexes also formed but in very low concentrations. The previous experiments have shown that when NH4OH was added to increase the pH value above 3, the solution precipitation took place, and thus the citrate-gel could not be obtained. In agreement with these theoretical and experimental results, the pH value influence was studied in the range of 1-3.
3 Experimental
3.1 Materials
Nickel nitrate (Ni(NO3)2��6H2O) (Fluka), copper nitrate (Cu(NO3)2��2.5H2O) (Rieldel�Cde  ), ammonium hydroxide (Biopack), and citric acid (Anedra) were used. The gases employed were 99.999% pure N2, a mixture of H2 (5%) and N2 and a mixture of O2 (10%) and N2. The gases were purified using adequate traps to retain water and oxygen.
3.2 Synthesis procedure
3.2.1 Preparation of precursor
Three precursors were prepared from solutions with the pH values of 1, 1.6 and 3, and with the molar ratio of Cu(II) ion to Ni(II) ion of 1:1. In all the cases, the molar ratio between citric acid and the sum of Cu(II) and Ni(II) ions (C/M) was 0.73. The solutions with pH values of 1.6 and 3 were obtained by adding NH4OH. The solution with pH value of 1 was obtained without adding NH4OH. The resulted solutions were heated at 50 ��C for 30 min and continuously stirred. In the case of the precursors prepared with pH values of 1 and 1.6, the solvent was later removed at 60 ��C under vacuum condition using a B��chi 461 vacuum rotavapor until a viscous gel was obtained. For the precursor prepared at pH value of 3, the solvent was eliminated at 50 ��C in order to avoid the precipitation of the solution. The dehydration of three samples was completed by gradual heating to 100 ��C and keeping for 15 h in a vacuum oven.
3.2.2 Decomposition
The decomposition of precursors was carried out under non-isothermal conditions by heating the precursors from room temperature to 280 ��C in a N2 flow of 100 mL/min. The heating program was 1 ��C/min for the precursor prepared with the pH value of 1, and 0.5 ��C/min for those obtained at pH values of 1.6 and 3. The precursor prepared at pH value of 1 was kept at 280 ��C for 1 h and 45 min, and the precursors prepared at pH values of 1.6 and 3 were kept at the same temperature for 1 h. Different heating programs were used to avoid the violent sample combustion that would take place at high heating rates when the precursors were prepared at a pH value higher than 1.
3.2.3 Calcination
Calcination was performed with a current of O2 (10%) in N2 and a flow of 100 mL/min and at a heating rate of 1 ��C/min, until reaching the selected temperature (300, 400 and 500 ��C). The system was kept at this temperature for 1 h.
3.2.4 Reduction
The previously performed temperature-programmed reduction (TPR) assays [29] showed that, when Cu and Ni oxides were mixed, the reduction temperature was lower than that when each oxide was in pure state. Then, the final reduction temperature was set at 300 ��C according to these results.
After the calcination stage, the solid obtained was reduced using a heating program of 5 ��C/min from room temperature to 300 ��C with a current of H2 (5%) in N2 and a flow of 100 mL/min. The system was kept at this temperature for 30 min, and then cooled in a N2 gas flow.
3.3 Equipment
A fixed bed reactor, heated by an electric furnace, was used for the decomposition, calcination and reduction stages.
Different techniques were used for solid characterization, such as thermogravimetric analysis (TG: Shimatzu TG50, run with 50 mL/min of N2), X-ray diffraction (XRD: Rigaku D-MAX IIIC, run at 30 kV and 20 mA, using Cu K�� radiation, l= 0.1542 nm with Ni filter, registered between 30�� and 90�� at rates of 3 (��)/min and 0.5 (��)/min), infrared spectroscopy (FT-IR: Nicolet Proteg�� 460, with a resolution of 4 cm-1, using compressed KBr pellets containing 1% (mass fraction) sample employed), scanning electron microscopy (SEM: LEO 1450VP), field emission gun-scanning electron microscopy (FEG-SEM: JEOL 6330F), electron probe microanalysis (EPMA: EDAX Genesis 2000, particles of each sample were randomly selected, and their chemical compositions were determined by processing the corresponding K-line spectra obtained with an incident beam of 20 keV), and transmission electron microscopy (TEM: JEOL 100 CX II operated at 100 kV and Philips EM 301 operated at 60 kV with the samples suspended in ethanol).
4 Results and discussion
4.1 Characterization of precursors and decomposition products
M1 (pH=1), M2 (pH=1.6) and M3 (pH=3) were the names assigned to the samples according to the initial solution pH value. The thermograms, IR spectra and XRD patterns corresponding to these precursors and their decomposition products are shown in Fig. 1.
Figure 1(a) shows the TG curves of precursors, in which the mass loss of precursors prepared with pH values of 1 and 1.6 takes place slowly in three stages: the first 21.5% and 28.60% mass loss, respectively (from room temperature to 175 ��C), are produced by the loss of water in gel; the second 24.70% and 23.20% mass loss, respectively (from 175 to 230 ��C), are due to both nitrate ions and the carboxyl groups; the third 22.48% and 26.48% mass loss, respectively (from 230 to 300 ��C), correspond to the remaining carboxyl groups. The thermogram of the sample prepared at pH value of 3 shows that the mass loss occurs rapidly and takes place in two stages. The first mass loss of 46.96%, which occurs from room temperature to 230 ��C, is the result of water loss, carboxyl groups and ammonium nitrate decomposition. The latter compound forms as a consequence of adding NH4OH to the solution in order to regulate the pH value, and its presence is evident in the XRD pattern shown in Fig. 1(c). The second mass loss of approximately 15.69% (from 230 to 300 ��C) corresponds to the decomposition of the remaining carboxyl groups. No mass loss is observed in any of the samples at temperatures higher than 300 ��C.
The IR spectra of precursors and the decomposition products, called M1-D, M2-D and M3-D, respectively, are shown in Fig. 1(b).

Fig. 1 Characterization of precursors and products of decomposition
The absorption bands at 3500, 1728, 1612 and 1380 cm-1 corresponding to vibrations of hydroxyl, free carboxyl groups, carboxylates from metal carboxylates and nitrate ions, respectively, are observed in M1, M2 and M3 spectra. A wide band attributed to the vibrations caused by hydrogen bonds is also observed at 3125 cm-1.
The comparison among M1-D, M2-D and M3-D spectra indicates that the solids prepared at pH values of 1 and 1.6 are similar. Three bands are more visible. The first one, at 1550 cm-1, is produced by the asymmetric vibrations of carboxylates from metal carboxylates. The second one, at 1380 cm-1, indicates that nitrate ions have not been completely removed at 280 ��C. The third one, in the 450 cm-1 zone, corresponds to the metal-oxygen vibration of metallic oxides. The band at 1728 cm-1, which corresponds to the vibrations of free carboxyl groups, also disappears in these figures due to the fact that all carboxyl ions are bound to metallic ions [15]. Two bands are observed in the spectrum corresponding to the sample prepared at pH value of 3, a wide one at 1500 cm-1 and the other one in the 450 cm-1 zone, corresponding to carboxylates from metal carboxylates and metallic oxides, respectively. The band at 1380 cm-1 is not observed, indicating that total decomposition of nitrate ions is produced at this stage.
The XRD patterns corresponding to the precursors (Fig. 1(c)) indicate that M1 and M2 solids are amorphous and M3 is a mixture of amorphous matrix and crystalline NH4NO3. The presence of NH4NO3 in M3 is in agreement with the results obtained by YUE et al [17], who synthesized nanocrystalline ferrites by the sol-gel combustion method, and studied the effect of pH value on the precursor. The authors set the pH values from 2 to 7 with NH4OH solution, and observed the formation of NH4NO3 at low pH values by XRD. They found that the decomposition of NH4NO3 within the gel accelerated the auto-combustion process, and the mass loss of the precursor was rapidly produced according to the results of characterizations using DTA and TG.
Figure 1(c) also shows the XRD patterns corresponding to M1-D, M2-D and M3-D. The XRD patterns of M1-D and M2-D present three peaks around 2q of 36.5��, 42.9�� and 49.27��, resulting in a mixture of Cu and Ni oxides. The peaks in positions 2q of 41.78��, 48.65��, 71.40�� and 81.50�� in the XRD pattern of M3-D reveal the presence of Ni4N when compared with the JCPDS 36-1300 file. The results reported by other authors about the formation and decomposition of NH4NO3 [30,31] and the formation of Ni4N when the amount of NH3 increases [32], suggest the following mechanism for the formation of Ni4N:
NO3-+NH4+��NH4NO3 (1)
NH4NO3��NH3(g)+HNO3 (2)
NiO+CO(g)��Ni+CO2(g) (3)
NH3(g)+4Ni��Ni4N+(3/2)H2 (4)
The XRD pattern of the precursor prepared at pH value of 3 shows the presence of NH4NO3, which forms from the species in the initial solution, according to Reaction (1), and its decomposition may occur mainly by Reaction (2). The IR spectrum of M3-D indicates the formation of metallic oxides. However, according to Reaction (3), part of NiO would be reduced to metallic state in the presence of a reducing agent (CO and/or C) coming from the decomposition of the citric acid. Ni would then react with NH3 to form Ni4N, according to Reaction (4).
4.2 Effect of pH value and calcination temperature
M1-D, M2-D��and M3-D were calcined at different temperatures (300, 400 and 500 ��C), and then reduced at 300 ��C. The characterizations of the products obtained for both stages are shown in the following sections.
4.2.1 Calcination at 300 ��C and reduction
The products of calcination at 300 ��C were called M1-300, M2-300 and M3-300, and their reduction products were labeled as M1-300R, M2-300R and M3-300R, respectively.
4.2.1.1 Chemical bonding and functional groups
Figure 2(a) shows the IR spectra of the calcined solids. The spectrum of the solid coming from the precursor prepared at pH value of 1 has a single band in the 450 cm-1 zone, which belongs to the metal-oxygen vibration of Ni and Cu oxides. When comparing this spectrum with that of M1-D (Fig. 1(b)), the complete removal of carboxylates from metal carboxylates and nitrate ions is observed during thermal treatment at 300 ��C. The spectra of M2-300 and M3-300 show two bands, one at about 1500 cm-1 belongs to carboxylates from metal carboxylates, and the other in the 450 cm-1 zone belongs to the metal-oxygen vibration of Cu and Ni oxides. These results indicate that, when the precursors are prepared at pH values of 1.6 and 3, the calcination at 300 ��C produces the partial decomposition of the metal carboxylates.
The IR spectra of the reduced samples are shown in Fig. 2(b). The spectrum of M1-300R sample indicates that the final product obtained at this stage does not contain impurities. Two bands appear in the spectra corresponding to M2-300R and M3-300R. A wide band at 1500 cm-1 is a result of carboxylates from metal carboxylates, and the other one around 450 cm-1 corresponds to the metal-oxygen vibration of Cu and Ni oxides, indicating the presence of impurities in the final products and an incomplete oxides reduction.
4.2.1.2 Crystalline structure
The XRD patterns shown in Fig. 3(a) indicate that the calcined solids are not crystalline enough. The comparison between NiO and CuO files with three peaks at 2q of 36.57��, 42.87�� and 62.31�� observed in M1-300 sample and the peaks at 2q of 42.57�� and 49.24�� in the M2-300 sample shows that the peaks belong to the mixture of Cu and Ni oxides. Although the XRD pattern of M3-300 solid indicates a low crystallinity, the comparison with files JCPDS 89-5881, 89-2530 and 36-1300 suggests that the peak at 2q of 43.29�� corresponds to NiO, and the peaks at 2q of 41.78�� and 48.65�� belong to Ni4N.

Fig. 2 IR spectra of solids obtained at 300 ��C
The comparison between Figs. 1(c) and 3(a) reveals the structural changes produced in the calcination stages of the precursors. The calcination of the precursor prepared at pH value of 1 at 300 ��C modifies the crystalline structure of the initial solid, and favors the formation of the oxides mixture. The structure of M2-D sample is not affected by calcination, instead, there is a slight increase of solid crystallinity. A phase corresponding to NiO appears after M3-D calcination, and Ni4N is still present.
Figure 3(b) shows the XRD patterns of the reduction products. Three peaks can be observed in sample M1-300R, each of which is in an intermediate position between the peaks corresponding to each pure metal due to the formation of Cu-Ni solid solution. The XRD pattern of M2-300R shows one peak at 2q of 43.11��, and the other one at 50.11��, both correspond to Cu. The presence of NiO is not neglected due to the overlapping between Cu (111) and NiO (400) peaks and the presence of a band corresponding to metallic oxides in the IR spectrum of this sample (Fig. 2(b)). In the case of the sample M3-300R, the peak observed at 2q of 43.53�� suggests the incipient formation of Cu-Ni solid solution. The low-intensity peak at about 2q of 41.78�� corresponds to Ni4N.
When the precursor is prepared at pH value of 1 and calcined at 300 ��C, the data from the characterization performed by IR and XRD suggest that it is possible to obtain a Cu-Ni alloy as a result of reduction at 300 ��C with a current of H2 (5%) in N2. The reduction of sample M3-300 leads to the incipient formation of a solid solution, whereas the sample M2-300R does not produce the alloy.
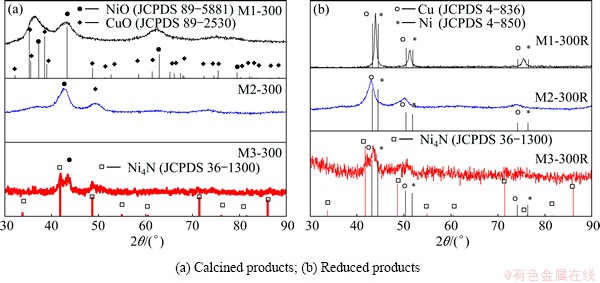
Fig. 3 XRD patterns of solids obtained at 300 ��C
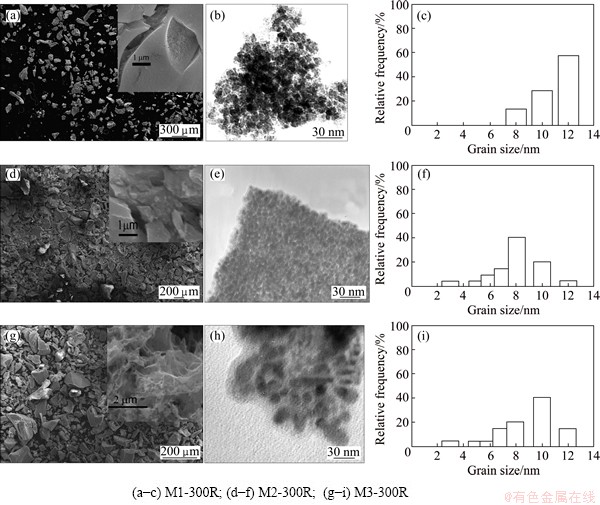
Fig. 4 SEM (a, d, g) and TEM (b, e, h) images and grain size distribution (c, f, i) of reduced solids
4.2.1.3 Morphology
The results of SEM and TEM characterization are presented in Fig. 4. The SEM image corresponding to sample M1-300R shows that the particles are plane, irregular in shape and with a fine granulometry. The particles corresponding to M2-300R are irregular in shape and have many cracks on their surface. In the case of sample M3-300R, the particles have a sponge-like morphology. The TEM images of the reduction products show that all three solids have agglomerates formed by a large number of spherical grains. Figure 4(c) shows that the sample contains particles in the range of 8-12 nm. When the pH value is higher (Figs. 4(f) and (i)) the particle size distribution is in the range of 3-12 nm. These results indicate that the pH value does not significantly affect the crystallite size at this calcination temperature.
4.2.1.4 Chemical composition
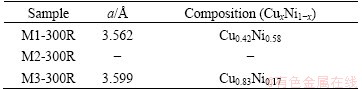
Tables 1 and 2 show the values of the lattice parameter a and the alloy composition (both of them were calculated from data obtained by XRD, using the Vegard law), and the quantification values of the reduced solids obtained using EPMA, respectively. The results in Table 1 indicate that the rise of pH value from 1 to 3 modifies the value of x (the composition refers to Cu). The quantification data in Table 2 show that the elements in sample M1-300R are Ni, Cu and a small amount of O. The presence of oxygen may be attributed to a partial re-oxidation of the alloy during sample handling [33,34]. Carbon and oxygen levels are high after the reduction stage in samples M2-300R and M3-300R due to the fact that carboxylates from metal carboxylates are not completely removed during the calcination stage, which is in line with the results reported in the corresponding IR spectra (Fig. 2(b)). The presence of N is also detected in sample M3-300R, which confirms the existence of Ni4N observed by XRD (Fig. 3(b)). The dispersion of the data obtained by EPMA shows that the rise of pH value in the original solution produces an increase of compositional heterogeneity of the final products.
The results of solids characterization indicate that the pH value has a marked effect on the products formed during the synthesis of Cu-Ni alloy. A Cu-Ni alloy with the mole ratio of Cu to Ni closer to 1:1 was obtained when the precursor was prepared at pH value of 1, whereas the alloy did not form when the precursor was prepared at pH value of 1.6, and a Cu-rich alloy was obtained when working at pH value of 3.
Table 1 Lattice parameter and alloy composition of reduced solids obtained at 300 ��C
4.2.2 Calcination at 400 ��C and reduction
4.2.2.1 Chemical bonding and functional groups
The solids calcined at 400 ��C were identified as M1-400, M2-400 and M3-400. Figure 5(a) shows the IR spectra of these samples. The spectrum corresponding to M1-400 shows a single band in the 450 cm-1 zone, which belongs to the metal-oxygen vibration of Ni and Cu oxides. The spectra of M2-400 and M3-400 show two low-intensity bands: a wide one at 1500 cm-1, and the other one in the 450 cm-1 zone, which correspond to carboxylates from metal carboxylates and metal-oxygen vibration of oxides, respectively.
Figure 5(b) corresponds to the IR spectra of reduction products. The spectrum corresponding to M1-400R indicates that the final product does not contain impurities. The results obtained for M2-400R and M3-400R are almost identical to those of the calcined samples (Fig. 5(a)), suggesting that the total combustion of organic matter is not attained.
4.2.2.2 Crystalline structure
The XRD patterns of the solids presented in Fig. 6(a) show that the products with thermal treatment at 400 ��C have a low crystallinity. However, the comparison of NiO and CuO files in the XRD pattern of sample M1-400 leads to the conclusion that the three peaks correspond to the mixture of Cu and Ni oxides. The XRD pattern of sample M2-400 shows peaks around at 2q of 42.93�� and 49.58��, which may belong to NiO and CuO, respectively. The peaks at 2q of 43.29�� corresponding to NiO, and at 2q of 41.78�� and 48.65�� corresponding to Ni4N, are observed in the XRD pattern of sample M3-400.
Table 2 Chemical composition of reduced solids obtained at 300 ��C (mass fraction, %)
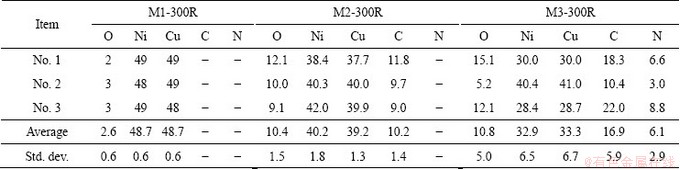
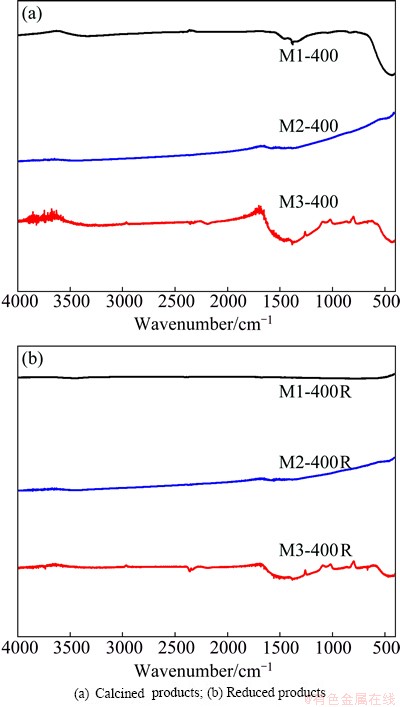
Fig. 5 IR spectra of solids obtained at 400 ��C
Figure 6(b) shows the XRD patterns of the reduction products. The Cu, Ni and Ni4N files are also presented. The XRD pattern of M1-400R solid has three peaks, and each of them is in an intermediate position between the two peaks corresponding to each pure metal, which means that the Cu-Ni solid solution forms. In the case of sample M2-400R, the peak observed at 2q of 43.29�� may belong to either the Cu (111) peak, or the NiO (400) peak, since both diffraction peaks overlap. Furthermore, the presence of NiO is possible due to the fact that the band corresponding to the metallic oxides appears in the IR spectra of this sample. The XRD pattern of sample M3-400R shows two peaks at 2q of 43.78�� and 51.03��, which are slightly displaced to an intermediate position between those corresponding to each pure metal. Two peaks located at 2q of 41.78�� and 48.65��, which belong to Ni4N, are also observed in this XRD pattern.
4.2.2.3 Morphology
The SEM and TEM images of the reduced solids are presented in Fig. 7. Figures 7(a), (d) and (g) show that the morphology of each solid is similar to those of the samples described in Section 4.2.1.3. The TEM images (Figs. 7(b), (e) and (h)) reveal that the three samples prepared at different pH values are formed by small spherical grains. The histograms corresponding to samples M1-400R and M2-400R (Figs. 7(b) and (e)) indicate that the solids are formed by grains whose sizes range from 5 to 12 nm. An increase of particle size from 5 to 20 nm is observed in the sample prepared at pH value of 3 (Fig. 7(h)). These experimental results indicate that crystallite sizes slightly grow as the pH value increases.
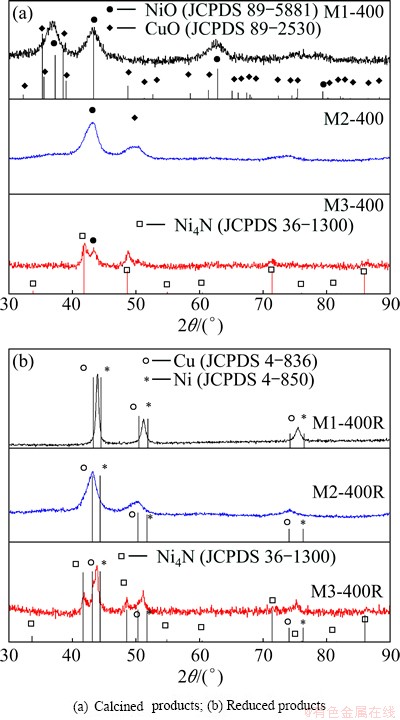
Fig. 6 XRD patterns of solids obtained at 400 ��C
4.2.2.4 Chemical composition
Tables 3 and 4 show the values of the lattice parameter a and the alloy compositions (both of them were calculated from data obtained by XRD), and the quantification values of the reduced solids obtained using EPMA, respectively.
These results indicate that a solid solution with a composition close to 1:1 forms from a solution with pH value of 1. When the pH value used in the precursor preparation is 1.6, the Cu-Ni alloy is not obtained, and a Cu-rich alloy is produced at pH value of 3.
4.2.3 Calcination at 500 ��C and reduction
4.2.3.1 Chemical bonding and functional groups
The precursors M1-D, M2-D and M3-D were calcined at 500 ��C, and the corresponding products were called M1-500, M2-500 and M3-500. These solids were later reduced under the same conditions as indicated in Section 3.2.4. The resulting solids were called M1-500R, M2-500R and M3-500R, respectively.

Fig. 7 SEM (a, d, g) and TEM (b, e, h) images and grain size distribution (c, f, i) of reduced solids
Table 3 Lattice parameter and alloy composition of reduced solids obtained at 400 ��C
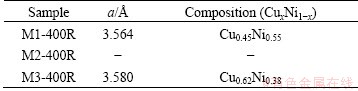
Figure 8(a) shows the IR spectra of the calcination products. A single band, which belongs to the metal- oxygen vibration of Cu and Ni oxides, is observed in the spectrum of sample M1-500, and no bands are observed in the spectra of M2-500 and M3-500. These results suggest that the oxides form at pH value of 1, and the calcination products could be Cu and Ni in metallic state or an alloy between both elements when the pH values are 1.6 and 3. This hypothesis is supported by the XRD results, which are reported in the following sections.
Figure 8(b) shows the IR spectra of the reduction products corresponding to the solids previously calcined at 500 ��C. No bands are observed in these spectra.
4.2.3.2 Crystalline structure
Figure 9(a) presents the XRD patterns of calcined solids. The peaks at 2q of 35.53��, 37.27��, 38.73��, 43.29��, 48.74�� and 62.91��, which correspond to a mixture of Cu and Ni oxides, are seen in the XRD pattern of M1-500. The peaks at 2q of 44.06��, 51.28�� and 75.46�� and at 2q of 43.85��, 51.11�� and 75.25�� are seen in the XRD patterns of M2-500 and M3-500, respectively. These peaks are located in an intermediate position in relation to those for pure Cu and Ni. The results show that the alloy of Cu and Ni is formed during the calcination of solids M2-D and M3-D at 500 ��C. This phenomenon is attributed to the presence of a reducing agent, probably CO and/or C which is generated by the incomplete combustion of Cu and Ni citrates. These results are in agreement with those shown in Fig. 8(a), and suggest that the calcination of the sample prepared at pH value of 1 at 500 ��C results in a mixture of CuO and NiO. Conversely, when the samples are prepared at pH values of 1.6 and 3 and calcined at 500 ��C, a solid solution of Cu-Ni is obtained.
Table 4 Chemical composition of reduced solids obtained from precursors calcined at 400 ��C (mass fraction, %)
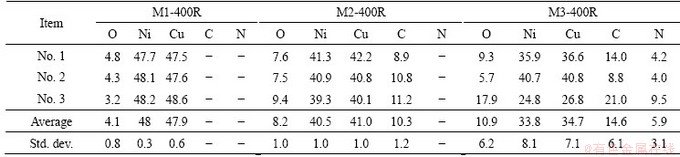
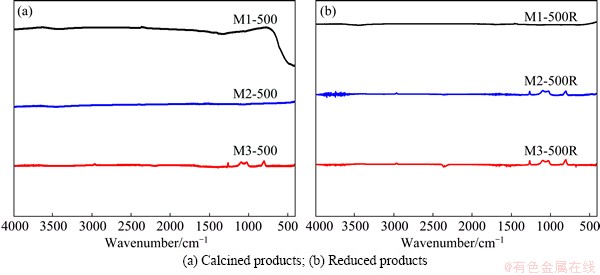
Fig. 8 IR spectra of solids obtained at 500 ��C

Fig. 9 XRD patterns of solids obtained at 500 ��C
The XRD patterns of the reduced solids (Fig. 9(b)) show three peaks for the studied pH values, and each of them is in an intermediate position between those corresponding to the peaks of each pure metal. These results indicate that, when calcination is performed at 500 ��C, the Cu-Ni alloy is formed after the reduction stage, independently of the pH value at which the precursors were prepared.
By comparing Figs. 9(a) and (b), it is inferred that almost no structural changes produce between the samples M2-500 and M3-500 and these samples after reduction (M2-500R and M3-500R). This supports the previous hypothesis about the presence of a reducing agent, since the formation of a Cu-Ni alloy is obtained during the calcination stage.
4.2.3.3 Morphology
The SEM images of the products derived from the reduction process (Figs. 10(a), (d) and (g)) show the morphologies of these solids, which are similar to those observed in Figs. 7(a), (d) and (g).
The TEM images (Figs. 10(b), (e) and (h)) show that the three solids are formed by spherical grains, with a grain size distribution of 12-14 nm for M1-500R, 5-45 nm for M2-500R and 25-35 nm for M3-500R. The grain size grows as the original solution pH value increases.

Fig. 10 SEM (a, d, g) and TEM (b, e, h) images and grain size distribution (c, f, i) of reduced solids
4.2.3.4 Chemical composition
Tables 5 and 6 report the values of the lattice parameter a, the alloy composition (both obtained by XRD), and the quantification values obtained using EPMA, respectively. The elements in sample M1-500R are Cu, Ni and a small amount of O coming from the partial re-oxidation of the alloy. The elements in samples M2-500R and M3-500R are Ni, Cu, C and O. The presence of C is due to the fact that this element was not completely removed during the calcination stage.
Table 5 Lattice parameter and alloy composition of reduced solids obtained at 500 ��C

The experimental results indicate that a Cu-Ni solid solution forms after the reduction of the samples calcined at 500 ��C. The increase of pH value slightly modifies the composition of the alloys, and the Cu-Ni alloy with a composition close to 1:1 is attained at pH value of 1.
4.3 Summary of pH value effects and calcination temperature
The results indicate that the characteristics of Cu-Ni nanoalloys synthesized by the citrate-gel method depend on the initial solution pH value and the calcination temperature.
4.3.1 Morphology
4.3.1.1 Particles
The surface morphology of the particles in the reduced sample changes with increasing the pH value. A flat surface is observed at low pH value, a surface with more pores and cracks is observed at an intermediate pH value, and a rougher surface is visible at a high pH values. These results indicate that NH4NO3 formed during the preparation stage of the precursors, when starting from solutions with pH values of 1.6 and 3, accelerates the process of self-combustion.
Consequently, a larger and more rapid evolution of gasses occurs, and an increase of the number and size of pores is produced [17].
No morphology changes in the alloy particles are observed in the calcination temperature range.
4.3.1.2 Grains
The geometry of grains is roughly spherical, and the size distribution of grains is heterogeneous in all the cases. The calcination temperature and pH value of the initial solution do not affect these features, which suggests that they depend on the preparation conditions of the gel (the stirring of solution, the formation stage of gel and the drying conditions), which are similar in all the cases.
Table 6 Chemical composition of reduced solids obtained at 500 ��C (mass fraction, %)

4.3.2 Grain size
The increase of grain size with the rise of pH value at a calcination temperature of 500 ��C can be attributed to the fact that a solid solution forms during the calcination stage of the solids prepared at pH values of 1.6 and 3. Consequently, a subsequent heating during reduction can produce the increase of crystallite size [19-21]. The production of the solid solution in the calcination stage is a consequence of the presence of reducing species, which are generated by the incomplete combustion of Cu and Ni citrates.
4.3.3 Composition and structure
The differences in the composition and crystalline structure among the alloys obtained from samples prepared at different calcination temperatures and pH value are attributed to the fact that the solids obtained have a heterogeneous chemical composition. This heterogeneity is produced because other chemical species besides Cu and Ni, such as NH4NO3, Ni4N and carbonous residues, are present, since they are generated during the synthesis stage of the alloys at pH values higher than 1.
The previous studies based on the experimental evidence and theoretical thermodynamic calculations have made it possible to propose the following reaction mechanism for the formation of Cu-Ni alloy [29]:
Stage 1
CuO+H2��Cu+H2O (5)
Stage 2
2Cu+NiO��CuO+Cu-Ni (6)
The CuO presenting in the oxide mixture is reduced by H2 according to Reaction (5). Cu diffuses towards the unreduced NiO, and then is incorporated into the Ni lattice to form Cu�CNi alloys. The CuO formed in stage 2 is later reduced according to Reaction (5).
The proposed mechanism is thermodynamically supported by the value of calculated electronic energy change (-256.0 kJ/mol), obtained for the reaction of 7Ni+7Cu��Cu7Ni7 [29]. These authors reported that the Cu-Ni alloy with a 1:1 molar ratio formed according to this mechanism when the mixture of Cu and Ni oxides was homogeneous.
In the particular case of this study, the chemical heterogeneity of the solid mixtures hinders the diffusion of Cu formed in the first stage of the proposed mechanism. This would explain the presence of unreacted NiO in some of the final products, pure Cu-Ni alloys, and Cu-Ni alloys unpurified with carbon, oxygen and nitrogen, according to Tables 1-6.
5 Conclusions
1) Cu-Ni nano-alloys with different compositions were prepared using precursors synthesized by the citrate-gel method, varying the initial solution pH value and the calcination temperature. Both the parameters significantly affect the structural characteristics of the alloys, their composition and grain size.
2) The calcination of the precursor prepared at pH value of 1 at different temperatures allows the formation of Cu and Ni oxides in all the cases. The crystallinity of the oxide mixtures increases as the calcination temperature increases. The reduction of these oxide mixtures allows the formation of Cu-Ni alloys whose composition gradually approaches molar ratio of 1:1 as the calcination temperature increases. Thus, the alloys have no impurities coming from carbon residues, and show similar morphological characteristics with small differences in grain size.
3) A Cu-Ni alloy with carbonous residues forms at pH value of 1.6 during the reduction stage of the solid previously calcined at 500 ��C. However, the alloy is not obtained at other calcination temperatures of 300 and 400 ��C.
4) The formation of Ni4N is observed in the decomposition stage of the precursor, when the initial solution pH value is 3. This compound is present in the alloys formed in the reduction stage, except when the calcination was performed at 500 ��C. The Ni content of the alloys gradually increases when the calcination temperature rises. The morphologies of the solids are similar, and the size of the grains grows as the calcination temperature increases.
Acknowledgments
The authors wish to thank Universidad Nacional de San Luis, Consejo Nacional de Investigaciones Cient��ficas y T��cnicas (CONICET) and Fondo para la Investigaci��n Cient��fica y T��cnol��gica (FONCyT), Argentina, for their financial support.
References
[1] EBRAHIMI F, KONG D. Efect of microstructure on strength and fracture of electrodeposited Cu/Ni layered nano-composites [J]. Scripta Materialia, 1999, 40(5): 609-616.
[2] ARAVINDA C L, PARTHASARATHI B, JAYARAM V, SHARMA A K, MAYANNA S M. Characterization of electrochemically deposited Cu-Ni black coatings [J]. Materials Research Bulletin, 2002, 37(3): 397-405.
[3] RAO G R, MEHER S K, MISHRA B G, CHARAN P H K. Nature and catalytic activity of bimetallic CuNi particles on CeO2 support [J]. Catalysis Today, 2012, 198(1): 140-147.
[4] CHATTERJEE J, BETTGE M, HAIK Y, CHEN C J. Synthesis and characterization of polymer encapsulated Cu�CNi magnetic nanoparticles for hyperthermia applications [J]. Journal of Magnetism and Magnetic Materials, 2005, 293(1): 303-309.
[5] LUA A C, WANG H Y. Decomposition of methane over unsupported porous nickel and alloy [J]. Applied Catalysis B: Environmental, 2013, 132-133: 469-478.
[6] ZHANG X, HUANG X, MA Y, LIN N, FAN A, TANG B. Bactericidal behavior of Cu-containing stainless steel surfaces [J]. Applied Surface Science, 2012, 258(24): 10058-10063.
[7] SHOBE A, GILL S, HOPE-WEEKS L. Monolithic CuO-Ni aerogels via an epoxide addition route [J]. Journal of Non-Crystalline Solids, 2010, 356(25-27): 1337-1343.
[8] WU Y, HE Y, WU T, CHEN T, WENG W, WAN H. Influence of some parameters on the synthesis of nanosized NiO material by modified sol�Cgel method [J]. Materials Letters, 2007, 61(14-15): 3174-3178.
[9] HAO Y J, LAI Q Y, LIU D Q, XU Z U, JI X Y. Synthesis by citric acid sol�Cgel method and electrochemical properties of Li4Ti5O12 anode material for lithium-ion battery [J]. Materials Chemistry and Physics, 2005, 94(2-3): 382-387.
[10] WU Z J, ZHAO X B, TU J, CAO G S, TU J P, ZHU T J. Synthesis of Li1+xV3O8 by citrate sol�Cgel route at low temperature [J]. Journal of Alloys and Compounds, 2005, 403(1-2): 345-348.
[11]  V, LEHMHUS D, BUSSE M. Synthesis of Cu0.55Ni0.44Mn0.01 alloy nanoparticles by solution combustion method and their application in aerosol printing [J]. Colloids and Surfaces A: Physicochemical and Engineering Aspects, 2011, 384(1-3): 661-667.
[12] CANNAS C, MUSINI A, PEDDIS D, PICCALUGA G. New synthesis of ferrite silica nanocomposites by a sol-gel autocombustion [J]. Journal of Nanoparticle Research, 2004, 6(2-3): 223-232.
[13] CANNAS C, FALQUI A, MUSINI A, PEDDIS D, PICCALUGA G. CoFe2O4 nanocrystalline powders prepared by citrate-gel methods: Synthesis, structure and magnetic properties [J]. Journal of Nanoparticle Research, 2006, 8: 255-267.
[14] LIU J L, ZHANG W, GUO C J, ZENG Y W. Synthesis and magnetic properties of quasi-ingle domain M-type barium hexaferrite powders via sol-gel auto-combustion: Effects of pH and the ratio citric acid to metals ions (CA/M) [J]. Journal of Alloys and Compounds, 2009, 479(1): 863-869.
[15] XU H M, YAN H G, CHEN Z H. Low-temperature combustion synthesis and sintering of nanosised Ce0.8Y0.2O1.9 powders [J]. Material Characterization, 2008, 59(3): 301-305.
[16] PATHAK L C, SINGH T B, DAS S, VERMA A K, RAMACHANDRARAO P. Effect of pH on the combustion synthesis of nano-crystalline alumina powder [J]. Materials Letters, 2002, 57(2): 380-385.
[17] YUE Z, GUO W, ZHOU J, GUI Z, LI L. Synthesis of nanocrystalline ferrites by sol-gel combustion process: the influence of pH value of solution [J]. Journal of Magnetism and Magnetic Materials, 2004, 270(1-2): 216-223.
[18] LEE W J, FANG T T. The effect of the molar ratio of cations and citric acid on the synthesis of barium ferrite using a citrate process [J]. Journal of Materials Science, 1995, 30(17): 4349-4354.
[19] SUCIU C, HOFFMANN A C, VIK A, GOGA F. Effect of calcination conditions and precursor proportions on the properties of YSZ nanoparticles obtained by modified sol�Cgel route [J]. Chemical Engineering Journal, 2008, 138(1-3): 608-615.
[20] LI W, LI J, GUO J. Synthesis and characterization of nanocrystalline CoAl2O4 spinel powder by low temperature combustion [J]. Journal of the European Ceramic Society, 2003, 23(13): 2289-2295.
[21] HUANG Y, TANG Y, WANG J, CHEN Q. Synthesis of MgFe2O4 nanocrystallites under mild conditions [J]. Materials Chemistry and Physics, 2006, 97(2-3): 394-397.
[22] CHEN J C, CHEN W C, TIEN Y C, SHIH C J. Effect of calcinations temperature on the crystalline growth of cerium oxide nano-powders prepared by the co-precipitation process [J]. Journal of Alloys and Compounds, 2010, 496(1-2): 364-369.
[23] OH S W, BANG H J, BAE Y C, SUN Y K. Effect of calcination temperature on morphology, crystallinity and electrochemical properties of nano-crystalline metal oxides (Co3O4, CuO, and NiO) prepared via ultrasonic spray pyrolysis [J]. Journal of Power Sources, 2007, 173(1): 502-509.
[24] GUISBIERS G, KHANAL S, RUIZ-ZEPEDA F, de la PUENTE J R,  M. Cu-Ni nano-alloy: Mixed, core�Cshell or Janus nano-particle? [J]. Nanoscale, 2014, 6(24): 14630-14635.
[25] SHIRINYAN A, WAUTELET M, BELOGORODSKY Y. Solubility diagram of the Cu-Ni nanosystem [J]. Journal of Physics: Condensed Matter, 2006, 18: 2537-2551.
[26] Sopousek J, Vrestal J, Pinkas J, Broz P, Bursik J, Styskalik A, Skoda D, Zobac O, Lee J. Cu-Ni nanoalloy phase diagram�CPrediction and experiment [J]. Calphad: Computer Coupling of Phase Diagrams and Thermochemistry, 2014, 45: 33-39.
[27] BUTLER J N, COGLEY D R. Ionic equilibrium solubility and pH calculations [M]. Canada: John Wiley & Sons, 1998.
[28]  J. Analytical applications of complex equilibria [M]. Budapest:
  , 1976.
[29] CANGIANO M A, OJEDA M W, CARRERAS A C,  J A, RUIZ M C. A study of the composition and microstructure of nanodispersed Cu-Ni alloys obtained by different routes from copper and nickel oxides [J]. Material Characterization, 2010, 61(11): 1135-1146.
[30] OOMMEN C, JAIN S R. Ammonium nitrate: A promising rocket propellant oxidizer [J]. Journal of Hazardous Materials A, 1999, 67(3): 253-281.
[31] BIAMINO S, BADINI C. Combustion synthesis of lanthanum chromite starting from water solutions: Investigation of process mechanism by DTA-TGA-MS [J]. Journal of the European Ceramic Society, 2004, 24(10-11): 3021-3034.
[32] PODYACHEVA O Y, ISMAGILOV Z R, SHALAGINA A E, USHAKOV V A, SHMAKOV A N, TSYBULYA S V, KRIVENTSOV V V, ISCHENKO A V. Structural changes in a niquel-copper catalyst during growth of nitrogen-containing carbon nanofibers by ethylene/ammonia decomposition [J]. Carbon, 2010, 48(10): 2792-2801.
[33] DAVAR F, FERESHTEH Z, SALAVATI-NIASARI M. Nanoparticles Ni and NiO: Synthesis, characterization and magnetic properties [J]. Journal of Alloys and Compounds, 2009, 476(1-2): 797-801.
[34] PALZA H, PILLEUX M, PENNAROLI J.  de
de  2003 [EB/OL]. [2012-12-1]. http://cabierta.uchile.cl/revista/21/articulos/ pdf/edu1. doc.
pHֵ�������¶ȶ�Cu-Ni���Ͻ�ĺϳɺ����Ե�Ӱ��
Mar��a de los A. CANGIANO, Manuel W. OJEDA, Mar��a del C. RUIZ
Research Institute of Chemical Technology (INTEQUI), National University of San Luis-CONICET. Chacabuco y Pedernera, San Luis 5700, Argentine
ժ Ҫ����������-�������ϳɵ�ǰ�����Ʊ�Cu-Ni���Ͻ��о���Һ��ʼpHֵ�������¶ȶ�Cu-Ni�������ijɷ֡������ṹ�����ȡ���ò�������Ժ;����ߴ��Ӱ�졣�����ֲ����Ժϳɵ��������ľ����ṹ���ɷֺ;����ߴ綼�кܴ��Ӱ�졣��Һ��ʼpHֵΪ1ʱ�Ʊ���Cu-Ni���Ͻ����ʣ���300��400��500 ��C���շֱ�õ�Cu0.42Ni0.58��Cu0.45Ni0.55�� Cu0.52Ni0.48����Һ��ʼpHֵΪ1.6��3ʱ������Cu-Ni���Ͻ�ľ����ߴ����������¶ȵ����߶�����pHֵΪ3ʱ����Cu-Ni���Ͻ��Ni�������������¶ȵ����߶������ӡ�
�ؼ��ʣ����ṹCu-Ni�Ͻ𣻻�ѧ�ϳɣ�������ѧ���ԣ�pHֵ�������¶�
(Edited by Mu-lan QIN)
Corresponding author: Mar��a de los A. CANGIANO; Tel/Fax: +54-2652-426711; E-mail: mcangiano@unsl.edu.ar
DOI: 10.1016/S1003-6326(15)64008-0
Abstract: Cu-Ni nano-alloys were prepared using precursors synthesized by the citrate-gel method. The effects of initial solution pH value and calcination temperature on the composition, crystalline structure, purity, morphology, homogeneity and grain size of Cu-Ni nanoparticles were investigated. Both the parameters significantly affect the crystalline structure, composition and grain size. Cu-Ni alloys prepared at pH value of 1 do not contain impurities, and their compositions are Cu0.42Ni0.58, Cu0.45Ni0.55 and Cu0.52Ni0.48 reduced at 300, 400 and 500 ��C, respectively. The grain size grows with the increase of calcination temperature for the precursor prepared at pH values of 1.6 and 3. The Ni content of the alloys gradually increases with the increase of calcination temperature at pH value of 3.
