
J. Cent. South Univ. (2012) 19: 1-8
DOI: 10.1007/s11771-012-0964-y![]()
Prediction and optimization of process parameter of friction stir welded AA5083- H111 aluminum alloy using response surface methodology
R. Palanivel1, P. Koshy Mathews2
1. Department of Mechanical Engineering, Kalaivani College of Technology, Coimbatore, India;
2. Research and Development, Department of Mechanical Engineering,Kalaivani College of Technology, Coimbatore, India
? Central South University Press and Springer-Verlag Berlin Heidelberg 2012
Abstract:
A systematic approach was presented to develop the empirical model for predicting the ultimate tensile strength of AA5083-H111 aluminum alloy which is widely used in ship building industry by incorporating friction stir welding (FSW) process parameters such as tool rotational speed, welding speed, and axial force. FSW was carried out considering three-factor five-level central composite rotatable design with full replications technique. Response surface methodology (RSM) was applied to developing linear regression model for establishing the relationship between the FSW process parameters and ultimate tensile strength. Analysis of variance (ANOVA) technique was used to check the adequacy of the developed model. The FSW process parameters were also optimized using response surface methodology (RSM) to maximize the ultimate tensile strength. The joint welded at a tool rotational speed of 1 000 r/min, a welding speed of 69 mm/min and an axial force of 1.33 t exhibits higher tensile strength compared with other joints.
Key words:
1 Introduction
Friction stir welding (FSW) has recently caught great attention of the welding community to fabricating high-quality butt and lap joints of aluminum alloys. Quite a lot of welding methods are accessible to fabricate aluminum ship structures, namely, gas metal arc welding (GMAW), laser welding and friction stir welding (FSW). Among them, FSW has also been recognized as a very well-groomed joining method for aluminum structures because of its many advanced features, such as tremendous joint performance, small degree of initial imperfections, low level of energy consumption and lack of detrimental emissions [1]. FSW uses a rotating tool that consists of a shoulder and a pin. The shoulder is pressed against the surface of the materials being welded, while the pin is forced between the two plates by an axial force. The rotation of the tool under this force generates a frictional heat that decreases the resistance to plastic deformation of the material. The softened material then easily moves behind the tool and forms a solid state weld. COLLIGAN et al [2] presented FSW applications for ship design and construction, together with a discussion of the use of FSW technology, and indicated that it is capable of reducing construction costs and welding distortion and improving durability in comparison with fusion welding. PEEL et al [3] investigated the mechanical properties and residual stresses of FSW aluminum 5083, and concluded that these properties are governed by the thermal input rather than by the mechanical deformation caused by the FSW tool. HAN et al [4] investigated the optimum conditions for FSW of AA5083-O aluminum alloy by evaluating the mechanical characteristics. LEAL and LOUREIRO [5] studied the effect of the weld travel speed on the defect formation, on the changes in the microstructures and on the mechanical properties of welds in aluminium alloys. It was verified that friction stir welded joint defects are mainly cracks or voids and are originated by large plastic deformation and hardening of the material. CHEN et al [6] determined that the formation of defect-free friction stir processed zone is affected by the material flow behavior under the action of rotating nonconsumable tool. Though various aluminum joints produced by FSW were studied by several researchers, optimization of FSW process parameter for aluminum alloy AA5083-H111 which is used typically in the marine, automotive, structural and construction industries, has not yet studied with help of response surface methodology (RSM). The RSM is helpful in developing a suitable ballpark figure for the well-designed relationship between the independent variables and the response variable that may exemplify the nature of the joints [7]. This has been proved by several researchers [8-12]. Hence, in this work, an attempt has been made to optimize the FSW process parameters to attain the maximum ultimate tensile strength for friction stir (FS) welded aluminum alloy AA5083-H111.
2 Experimental
2.1 Selecting important FSW process parameters
Based on preliminary trials, the independent process parameters affecting the ultimate tensile strength (UTS) were identified as tool rotational speed (N), welding speed (S) and axial force (F).
2.2 Manufacture of FSW tools
Tool made of high-carbon high-chromium steel (HCHCr) has configuration of pin profile of straight square (SS) without draft, shoulder diameter of 18 mm, pin diameter of 6 mm and pin length of 5.6 mm. And between shoulder and work piece interference surface there are three concentric circular equally-spaced slots of 2 mm in depth on tool. The FSW tool was manufactured using CNC turning center and wire cut EDM (WEDM) machine to get accurate profile. The tool was oil hardened. The manufactured tool is shown in Figure 1.
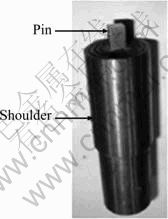
Fig. 1 Manufactured FSW tool
2.3 Selecting limits of FSW process variable
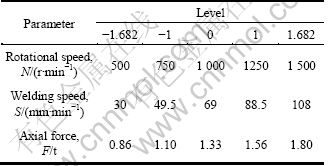
Trial runs were conducted to find the upper and lower limit of process parameters for AA5083 aluminum alloy, by varying one of the parameters and keeping the rest of them at constant values. The chemical composition and mechanical properties of the materials AA5083-H111 are presented in Tables 1 and 2, respectively. Feasible limits of the parameters were chosen in such a way that the joint should be free from visible defects. The upper limit of a factor was coded as 1.682 and lower limit as -1.682. The intermediate coded values are calculated from the following relationship:
Xi=1.682[2X-(Xmax +Xmin )]/(Xmax-Xmin) (1)
where Xi is the required coded value of a variable X; X is any value of the variable from Xmin to Xmax.; Xmin is the lower limit of the variable; Xmax is the upper limit of the variable. The selected process parameters with their limits, units and notations are given in Table 3.
Table 1 Chemical composition of AA5083-H111 alloy (mass fraction, %)
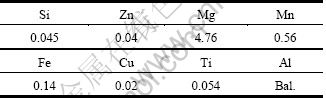
Table 2 Mechanical properties of AA5083-H111 alloy
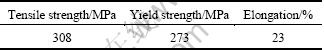
Table 3 FSW process parameters and their levels
2.4 Development of design matrix
The selected design matrix is shown in Table 4. It is a three-factor five-level central composite rotatable design consisting of 20 sets of coded conditions composed of a full factorial 23 = 8, plus 6 centre points and 6 star points.
2.5 Conducting experiment as per design matrix
The experiments were conducted as per the design matrix with the help of friction stir welding machine made by R.V.S machine tool, as shown in Figure 2. The plates to be welded and FSW tool were fixed on the table and spindle, respectively, as shown in Figure 3. Samples of the welded plates are shown in Figure 4. Specimens of required size were cut from the welded plate to carry out metallurgical studies. The specimens were polished using standard metallographic technique and observed using a scanning electron microscope (SEM). evaluated using computerized universal testing machine. For each welded plate, three specimens were prepared and tested. The average values of the results obtained from those specimens are tabulated and presented in Table 4 as experimental value. Direction of extraction of tensile specimen from the welded plate is shown in Figure 5. Tensile specimens before and after finding the ultimate tensile strength are shown in Figure 6.
Table 4 Design matrix and experimental value with predicted value of ultimate tensile strength
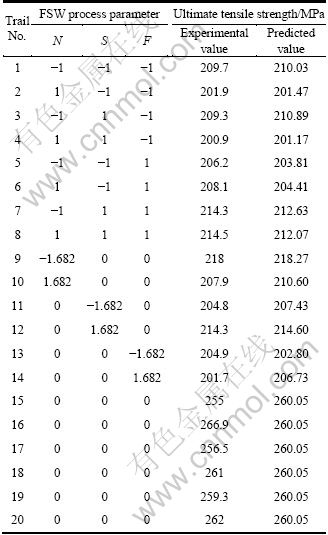
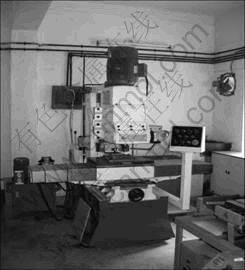
Fig. 2 FSW machine
2.6 Recording of responses
Tensile test specimens were prepared as per American Society for Testing of Materials (ASTM E8) standard and transverse tensile properties such as ultimate tensile strength of the FS welded joints were
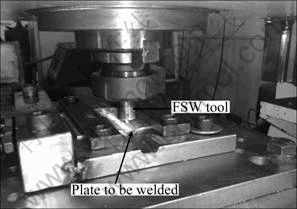
Fig. 3 Experimental setup showing arrangements of weld plate and FSW tool attachment
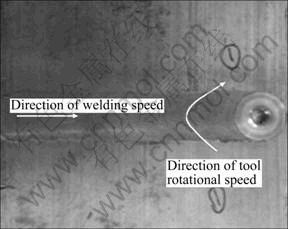
Fig. 4 Sample of FS welded plate (750 r/min, 49.5 mm/min, 1.10 t)
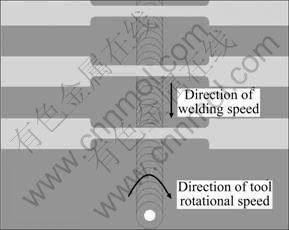
Fig. 5 Preparation of tensile specimen from FS welded plate
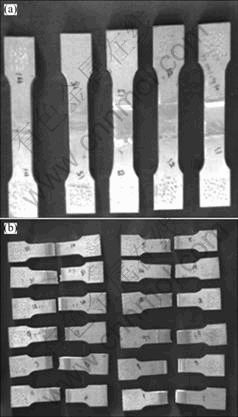
Fig. 6 Tensile specimens before (a) and after (b) fracture
2.7 Development of mathematical model
Ultimate tensile strength of the FSW joints is function of rotational speed, welding speed and axial force, and it can be expressed as
Y = f (N, S, F) (2)
where Y is the response; N is the rotational speed, r/min; S is the welding speed, mm/s; F is the axial force, t.
For the three factors, the selected polynomial could be expressed as
Y =b0+b1N+b2S+b3F++b11N2+b22S2+b33F2++b12NS+
b13NF+ b23SF (3)
where b0 is the free term of the regression equation; the coefficients b1, b2 and b3 are linear terms; the coefficients b11, b22 and b33 are quadratic terms; the coefficients, b12, b13 and b23, are interaction terms. The values of the coefficient of the polynomial are calculated by regression analysis with the help of following equations [12]:
b0 = 0.166 3��(Y)- 0.056 8�ơ�(Xii Y) (4)
bj = 0.073 2(Xi Y) (5)
bii =0.062 5 ��(XiiY)+0.006 89�ơ�(XiiY)-0.056 8��(Y) (6)
bij= 0.125 0��(XijY) (7)
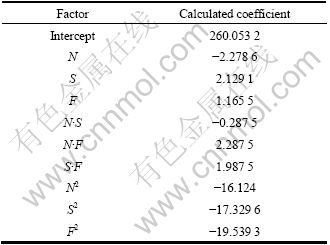
DESIGN EXPERT 8.0.4 software packages were used to calculate the values of those coefficients for different responses and the results are presented in Table 5. The final mathematical models determined by the above analysis in the coded form are represented:
��b/MPa=260.05-2.28N+2.13S+1.17F-16.12N2-17.33S2-
19.54F2-0.29 N��S+2.29N��F+1.99S��F (8)
Table 5 Calculated regression coefficients of mathematical models
2.8 Checking adequacy of model
The adequacy of the model developed was then tested by using the analysis of variance technique (ANOVA). The results of the ANOVA are given in Table 6. The Model F-value of 77.53 implies the model is significant. There is only a 0.01% chance that a Model F-value could occur due to noise. Values of "Prob > F" less than 0.050 0 indicate that model terms are significant. In this case, N2, S2 and F2 are significant model terms. Values greater than 0.100 0 indicate that the model terms are not significant. The lack of Fit F-value of 0.83 implies that the lack of fit is not significant. There is 57% chance that a lackof Fit F-value could occur due to noise. The coeficent of determination R2 values gives the goodness of fitness of the model. The determined values of the developed model are presented in Table 7. The R2 value is always between 0 and 1, and its value indicates the accuracy of the model. For a good model, R2 value should be close to 1. In this model, the calculated R2 is 0.985 87. This implies that 98.5% of experimental data confirms the compatibility with the data predicted by the developed model. The value of the adjusted R2 of 0.973 15 is also high to adherent for a high significance of the model. The predicted R2 of 0.940 2 is in reasonable agreement with the adjusted R2 of 0.973 2. Adequate precision measures the signal-to-noise ratio. A ratio greater than 4 is desirable [13]. In this study, the ratio is 20.439, which indicates an adequate signal. This model can be used to navigate the design space. The normal probability plot for tensile strength shown in Figure 7 reveals that the residuals are falling on the straight line, which means the errors are distributed normally. A typical scatter diagram of the model is presented in Figure 8. The observed values and predicted values of the responses are scattered close to the 45�� line, indicating an almost perfect fit of the developed empirical models.
Table 6 ANOVA test results
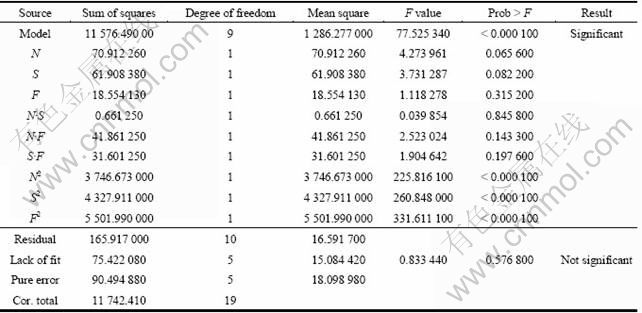
Table 7 Coefficient of determination values
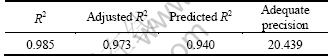
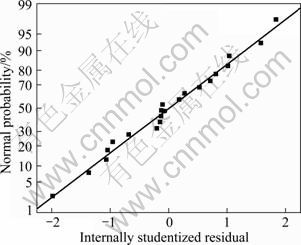
Fig. 7 Normal probability plot
2.9 Confirmation experiments
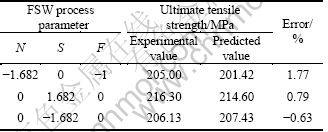
Experiments are conducted to verify the regression equation (8). Three weld runs are made using different values of rotational speed, welding speed and axial force other than those used in the design matrix. The results obtained are quite satisfactory and the details are presented in Table 8.
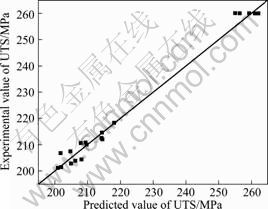
Fig. 8 Scatter diagram of ultimate tensile strength (UTS)
Table 8 Results of confirmation experiment
3 Effect of FSW process parameter
The effects of the different process parameters on the ultimate tensile strength of FS welded aluminum alloy AA5083 were predicted by the mathematical models using the experimental observations presented in Figures 9-14, showing the general trends between cause and effect. From Figures 9 and 11, it is seen that as the rotational speed increases the tensile strength of FS welded aluminum alloy AA5083 increases and then it decreases. It is clear that in FSW as the rotational speed increases, the heat input also increases. More amount of heat input affects the regular flow behavior of the material. At the same time, low rotational speed produces low heat input, which results in the lack of stirring action, hence the strength is low. From Figures 9 and 13, it is evident that as welding speed increases from 30 mm/min to 108 mm/min, the tensile strength of the FS welded aluminum alloy AA5083 increases and then decreases. At the lowest welding speed (30 mm/min) and highest welding speed (108 mm/min), lower tensile strength is observed. This is due to the increased frictional heat and insufficient frictional heat generated respectively [14]. From Figures 11 and 13, it is observed that when the axial force increases from 0.8 to 1.8 t the ultimate tensile strength of the FS weld of AA5083 increases and then decreases. This may be due to insufficient coalescence of transferred material. At the highest axial force, the plunge depth of the tool into the work pieces is higher, which results in lower tensile strength [15].
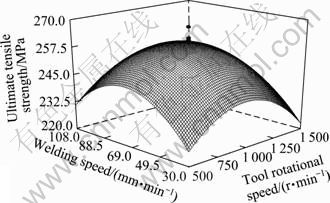
Fig. 9 Response surface graphs of tool rotational speed and welding speed on UTS
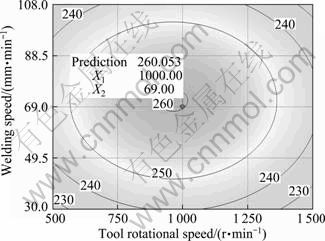
Fig. 10 Contour plots of tool rotational speed and welding speed on UTS
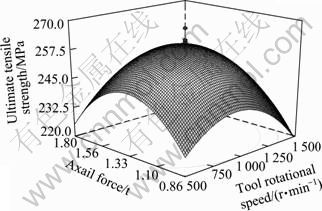
Fig. 11 Response surface graphs of tool rotational speed and axial force on UTS
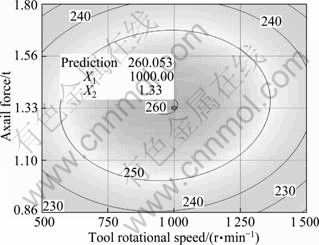
Fig. 12 Contour plots of tool rotational speed and axial force on UTS
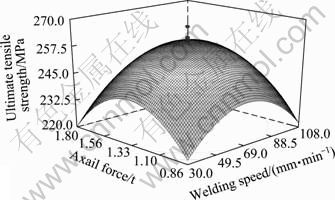
Fig. 13 Response surface graphs of tool welding speed and axial force on UTS
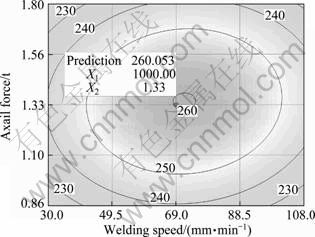
Fig. 14 Contour plots of tool welding speed and axial force on UTS
Also, it is observed from the SEM analysis shown in Figure 15 that, the weld region of the joint fabricated at 1 000 r/min, 69 mm/min, 1.33 t contains finer grains compared with other joints (750 r/min, 49.5 mm/min, 1.10 t; 1 250 r/min, 88.5 mm/min, 1.56 t) and in turn yields higher tensile strength.
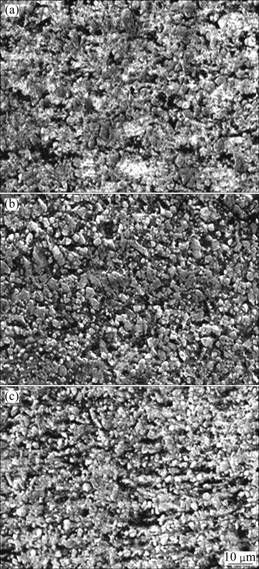
Fig. 15 SEM micrographs: (a) 750 r/min, 49.5 mm/min, 1.10 t; (b) 1 000 r/min, 69 mm/min, 1.33 t; (c) 1 250 r/m, 88.5 mm/min, 1.56 t
4 Optimizing FSW process parameters
In this work, FSW process parameters were optimized using response surface methodology (RSM). For designing a set of experiments, developing a mathematical model, analyzing the optimum combination of input parameters and expressing the values graphically, RSM is most successful method [8]. To achieve the influencing temperament and optimized condition of the process parameter on UTS, the surface plots and contour plots which are the indications of possible independence of factors have been developed for the proposed empirical relation by considering one parameter in the middle level and two parameters in the x- and y-axis as shown in Figures 10, 12, and 14. These response contours can help in the prophecy of the response (UTS) for any region of the experimental domain [16]. Figures 9, 11 and 13 show three-dimensional response surface plots for the response tensile strength obtained from the regression model.
The maximum achievable UTS values have been taken from the apex of the response plot. A contour plot is created which plays a most important role in displaying the region of the optimal process visually. Creating contour plot can be more complex for second-order responses compared to the simple series of parallel lines that can occur with first-order models. Once the immobile point is found, it is usually required to characterize the response surface in the immediate vicinity of the point. Characterization involves identifying whether the immobile point is a minimum response or a maximum response or a saddle point. To categorize this, it is most undemanding to examine it through a contour plot. Influences of process parameters on UTS can be ranked [13, 17] from their respective F ratio values presented in Table 6, and provided that the degrees of freedom are same for all the input parameters. The higher F ratio value indicates that the respective term is more significant. From the F ratio values, it is concluded that rotational speed contributes more on UTS and it is followed by welding speed and axial force, for the range considered in this model. By analyzing the response surfaces and contour plots, the maximum achievable UTS value is found to be 260.53 MPa. The corresponding FSW parameters that yield this maximum value are tool rotational speed of 1 000 r/min, welding speed of 69 mm/min and axial force of 1.33 t.
5 Conclusions
1) The relationships between process parameters for FS welding of AA5083-H111 aluminum alloy have been established using response surface methodology, which were checked for their adequacy using ANOVA test, and scatter diagrams, and found to be satisfactory.
2) Response graphs and contour plots were drawn to study the effect of FSW parameters on the tensile strength of friction stir welded joints of AA5083-H111 aluminium alloy.
3) The working range of optimized welding parameters for good quality FS welded joints of aluminium alloy AA5083-H111 is found.
Acknowledgements
The authors sincerely express their heartfelt profound gratitude to Dr. N. Murugan, Professor, Head, Welding Research Cell, Department of Mechanical Engineering, Coimbatore Institute of Technology, Coimbatore, India for extending his valuable suggestion and providing the facilities in Welding Research Laboratory to carry out this investigation. The authors would like to thank DRDO-Naval Re-search Board, India, for providing financial support to procure the FSW machine for Welding Research Cell, CIT, Coimbatore, India.
References
[1] DAWES C J, THOMAS W M. Friction stir joining of aluminum alloys [C]// TWI Bulletin. The Welding Institute, 1995: 124.
[2] COLLIGAN K J. Frictions stir welding for ship construction [M]. Harrisburg, PA: Concurrent Technologies Corporation, 2004: 1-6.
[3] PEEL M, STEUWER A, PREUSS M, WITHERS P J. Microstructure mechanical properties and residual stresses as a function of welding speed in aluminum AA5083 friction stir welds [J]. Acta Materialia, 2003, 51(16): 4791-4801.
[4] HAN M S, LEE S J, PARK J C, KO S C, WOO Y B, KIM S J. Optimum condition by mechanical characteristic evaluation in friction stir welding for 5083-O Al alloy [J]. Transaction of Nonferrous Metals Society of China, 2009, 19(1): 17-22.
[5] LEAL R, LOUREIRO A. Defects formation in friction stir welding of aluminium alloys [J]. Advanced Material Forum II, 2004, 455/456: 299-302.
[6] CHEN Y C, LIU H, FENG J. Friction stir welding characteristics of different heat-treated-state 2219 aluminium alloy plates [J]. Material Science Engineering A, 2006, 420(1/2): 21-25.
[7] GRUM J, SLABE J M. The use of factorial design and response surface methodology for fast determination of optimal heat treatment conditions of different Ni-Co-Mo surfaced layers [J]. Journal of Materials Processing Technology, 2004, 155(30): 2026-2032.
[8] GUNARAJ V, MURUGAN N. Application of response surface methodology for predicting weld bead quality in submerged arc welding of pipes [J]. Journal of Material Processing Technology, 1999, 88: 266-275.
[9] MANONMANI K, MURUGAN N, BUVANASEKARAN G. Effect of process parameters on the weld bead geometry of laser beam welded stainless steel sheets [J]. International Journal of Joining Materials, 2005, 17(4): 103-109.
[10] BALASUBRAMANIAN M, JAYABALAN V, BALASUBRAMANIAN V. Developing mathematical models to predict tensile properties of pulsed current gas tungsten arc welded Ti-6Al-4V alloy [J]. Materials and Design, 2008, 29(1): 92-97.
[11] PALANI P K, MURUGAN N. Optimization of weld bead geometry for stainless steel claddings deposited by FCAW [J]. Journal of Materials Processing Technology, 2007, 190(1): 291-299.
[12] PALANI P K, MURUGAN N. Sensitivity analysis for process parameters in cladding of stainless steel by flux cored arc welding [J]. Journal of Manufacturing Processes, 2006, 8(2): 90-100.
[13] KARTHIKEYAN R, BALASUBRAMANIAN V. Predictions of the optimized friction stir spot welding process parameters for joining AA2024 aluminum alloy using RSM [J]. International Journal of Advanced Manufacturing Technology, 2010, 51: 173-183.
[14] COLLIGAN J, PAUL J, KONKOL, JAMES J, FISHER P, JOSEPH R. Friction stir welding demonstrated for combat vehicle construction [J]. Welding Journal, 2003, 82(3): 1-6.
[15] ELANGOVAN K, BALASUBRAMANIAN V, VALLIAPPAN M. Influences of tool pin profile and axial force on the formation of friction stir processing zone in AA6061 aluminium alloy [J]. International Journal of Advanced Manufacturing Technology, 2008, 38: 285-295.
[16] TIEN C L, LIN S W. Optimization of process parameters of titanium dioxide films by response surfaces methodology [J]. Optics Communication, 2006, 266(2): 574-581.
[17] PHILLIP J R. Taguchi techniques for quality engineering [M]. New York: Mc Graw-Hill, 1988: 114.
(Edited by YANG Bing)
Received date: 2011-05-24; Accepted date: 2011-07-06
Corresponding author: R. Palanivel, Assistant Professor; Tel: +91-9943707552; E-mail: rpelmech@yahoo.co.in
Abstract: A systematic approach was presented to develop the empirical model for predicting the ultimate tensile strength of AA5083-H111 aluminum alloy which is widely used in ship building industry by incorporating friction stir welding (FSW) process parameters such as tool rotational speed, welding speed, and axial force. FSW was carried out considering three-factor five-level central composite rotatable design with full replications technique. Response surface methodology (RSM) was applied to developing linear regression model for establishing the relationship between the FSW process parameters and ultimate tensile strength. Analysis of variance (ANOVA) technique was used to check the adequacy of the developed model. The FSW process parameters were also optimized using response surface methodology (RSM) to maximize the ultimate tensile strength. The joint welded at a tool rotational speed of 1 000 r/min, a welding speed of 69 mm/min and an axial force of 1.33 t exhibits higher tensile strength compared with other joints.
