
J. Cent. South Univ. (2016) 23: 1427-1438
DOI: 10.1007/s11771-016-3195-9

Astronomical forcing of sedimentary cycles of Late Eocene Liushagang Formation in the Bailian Sag, Fushan Depression, Beibuwan Basin, South China Sea
CAO Hai-yang(�ܺ���)1, 2, JIN Si-ding(��˼��)1, 2, SUN Ming(����)3, WANG Hua(����)1
1. Key Laboratory of Tectonics and Petroleum Resources, China University of Geosciences, Wuhan 430074, China;
2. Department of Geodynamics and Sedimentology, University of Vienna, Althanstrasse 14, 1090 Wien, Austria;
3. Guangzhou Marine Geological Survey, Guangzhou 510760, China
 Central South University Press and Springer-Verlag Berlin Heidelberg 2016
Abstract:
Sediments in the Liushagang Formation of Late Eocene form a group of key hydrocarbon play fairways in the Beibuwan Basin, South China Sea. As an important reservoir-forming combination, the Liushagang Formation consists of deltaic siliciclastic and show clear sedimentary cyclicity. According to paleontology research and stratigraphic correlation, the boundary between Liushagang Formation (Els) and Weizhou Formation (Ewz) is regarded as the Eocene-Oligocene boundary. The oxygen isotope dating for well cores from the top of the first Member of Liushagang Formation (Els1) and the bottom of the third Member of Weizhou Formation (Ewz3) give an isochron age of 35.2 Ma. Here, we use GR logging data as a paleoenvironmental proxy to conduct a detailed cyclostratigraphic study of the Els1 in the Bailian Sag, Fushan Depression. Power spectra, evolutionary fast Fourier transformation and wavelet analysis all reveal significant sedimentary cycles in Els1. The ratios of cycle wavelengths in these stratigraphic units are 21:5:2.8:1.2:1, and are interpreted as Milankovitch cycles of 400 ka and 96 ka eccentricity, 52 ka obliquity, 22 ka and 19 ka precession cycles, respectively. An astronomical time scale is established by tuning filtered 96 ka eccentricity cycles to a target curve of Well L2 in the Bailian Sag. Based on regional stratigraphic framework, combined with seismic, cores and logging data, the HST of the first member of the Liushagang Formation (Els1) delta in Well L2 was divided into six parasequence sets named Ps1-Ps6. According to the spectrum analysis by Simple Lomb periodogram from PAST program packages, the sediment accumulation rate of each parasequence sets first increased and then decreased as time went by. The sediment accumulation rate of Ps4 reached the maximum (0.127 m/ka) during the most prosperous period of delta prograding. Finally, the duration of each period of parasequence sets and more accurate geological age were calculated on the basis of sediment accumulation rate. The ages of each depth are precisely estimated and provide new constraints on the Late Eocene.
Key words:
Fushan Depression; Liushagang Formation; Milankovitch cycles; astronomical tuning��
1 Introduction
The Beibuwan Basin is a petroliferous basin situated at the northern continental shelf of the South China Sea. Lithospheric thinning processes and extension in the northern continental margin of the South China Sea formed several continental marginal basins since Late Cretaceous [1-4]. The sandstone-mudstone rhythmic successions were deposited during the Late Eocene period in the Bailian Sag, Fushan Depression. Recently, the astronomical calibration of high-resolution sedimentary records have been used to construct astronomical time scales in the Cenozoic for many basins [5-10], and the astronomical time scale [11] was based on the correlation of characteristic patterns of sedimentary cycles to the precessional time series of the astronomical solutions [12]. Cyclostratigraphic analysis is powerful in reconstructing chronostratigraphic framework especially in fossil-barren strata like the Fushan Depression, with the low quality 3-D seismic data and lack of outcrop exposures.
For a better understanding of sequence stratigraphy, sedimentation, sediment accumulation rate, climatic, and paleontological processes in the Bailian Sag, Fushan Depression, cyclostratigraphy is a very useful method throughout the geological record for correlation of sedimentary strata to a numerical timescale at a high resolution of 10-100 ka [13-15]. Consequently, here we use the spectral analysis of a high-resolution natural gamma-ray well-logging record from the first member of the Liushagang Formation (Els1) in the Bailian Sag to confirm whether the Milankovitch cycles existed in the sedimentary record. If the sedimentary record is astronomically driven, the records were tuned to the calculated astronomical solution [16] to construct a high-resolution astronomically tuned time scale. The improved astronomically tuned time scale enables us to determine temporal variations in sediment accumulation rates and to date accurately geological events and bioevents recorded of the Late Eocene. This approach provides an operational method to improve the stratigraphic resolution and, ultimately, to enhance the success rate in hydrocarbon exploration in the Bailian Sag, Fushan Depression, Beibuwan Basin, South China Sea.
2 Regional geological setting
The South China Sea is the largest and deepest marginal sea in the western Pacific regions (Fig. 1) [1]. Located in the northern continental shelf of the South China Sea and in the southeast margin of Eurasian plate, the Beibuwan Basin, with mostly Cenozoic deposits, is one of the basins with significant hydrocarbon accumulation in the South China Sea [17-19]. The Fushan Depression is located in the south margin of Beibuwan Basin, with a total area of about 2920 km2 and a maximum deposition thickness of about 9000 m in Cenozoic [20]. Bounded by the Lingao Fault to the northwest, the Dingan Fault to the south and Changliu Fault to the northeast, accumulating sediment is supplied from three positive geomorphic units: the western Lingao Uplift, eastern Yunlong Uplift and the southern Hainan Basement. The Depression forms a half-graben faulted in the south and overstepping in the north. Previous researches [3-4, 21-22] interpreted the Fushan Depression as an east-west trending transfer zone (Huachang Transfer Zone) which separated two independent sags (Huangtong Sag and Bailian Sag see in Fig. 1), resulting in different tectonic styles and sedimentary patterns between the western and eastern areas.
The Paleogene strata in the Fushan Depression comprises three formations: the Changliu (Ech), Liushagang (Els), and Weizhou (Ewz) Formations. In early Cenozoic, a rifting phase resulted in the formation of the Fushan Depression and an alluvial fan developed in the Changliu Formation (Ech). After the development of an Early Eocene (Els3) braided delta, maximum lake transgression occurred during the Middle Eocene (Els2) and a deep lacustrine facies was mostly developed. In Late Eocene time (Els1), the area covered by sediments decreased. The Early Oligocene sequence (Ewz) is mainly composed of a fluvial facies, followed by a Late Oligocene angular unconformity [2, 23-24] (Fig. 2). The lake level change is very close to the global sea level change which shows a rapid sea level falling after Middle Eocene and then rising with multi-phase fluctuation [25]. From recent studies on microfacies, biostratigraphy, paleoclimate and sedimentary environment [26-27], the boundary between Liushagang Formation (Els) and Weizhou Formation (Ewz) is regarded as the Eocene-Oligocene boundary. The oxygen isotope dating for well cores from the top of the first Member of Liushagang Formation (Els1) and the bottom of the third Member of Weizhou Formation (Ewz3) give an isochron age of 35.2 Ma [26].
Bailian Sag located in the eastern of the Fushan Depression, and the siliciclastic sediments are mainly supplied from the Yunlong Uplift which controlled by the Changliu Fault. As a continental basin, plenty of climate and environment change records should be kept, although they were affected by lacustrine delta on some degree. We select target wells in the deep water which are far away from both the Huachang transfer zone and the boundary fault to minimize the influence of tectonic factors. The lithology of Well L4 and L5 (the location is shown in Fig. 1) of Els1 in the Bailian Sag has been described as dark grey mudstones intercalated with silt mudstone, grey siltstone with black muddy laminated beds and fine sandstone with horizontal bedding (Fig. 3). They developed in the semi-lacustrine environment without obviously erosion and overlap strata, which indicated they should represent an ideal record of Milankovitch cycles.
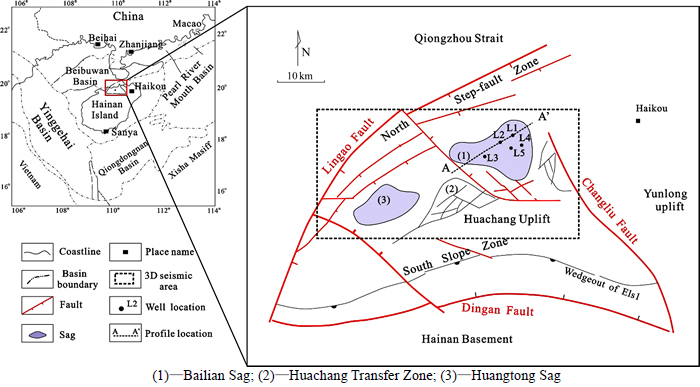
Fig. 1 Outline map of Fushan Depression:
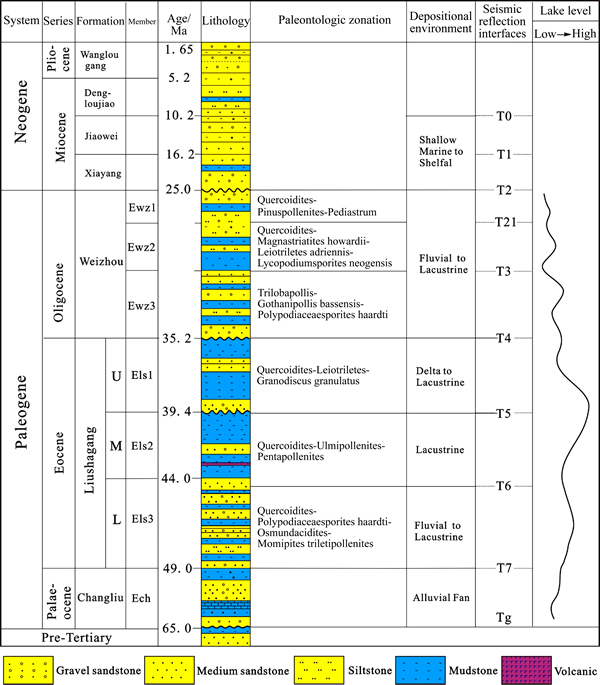
Fig. 2 Schematic stratigraphic column of Fushan Depression, Beibuwan Basin (Paleontological assemblages from Ref. [26] and curve of sea level variations according to Ref. [2])
3 Data and methods
3.1 Natural gamma-ray logging data
Proxy data from both outcrop and well log that sensitive to climate and environment changes could be used to cyclostratigraphic analysis. Geochemistry proxy data (carbon and oxygen isotope, strontium isotope, carbonate content, P/Ti) and geophysical proxy data (natural gamma-ray, magnetic susceptibility) with a high-resolution dataset need be provided [28-29]. Currently, the most intensive high-resolution dataset are from logging curves in petroleum drilling of which sampling were obtained by the same interval and at the same scale. By measuring the gamma ray intensity in the radioactive element decay process, natural gamma-ray (GR) log curves have a good response to clay and organic content variation of which are sensitive to precipitation-evaporation ratios and sea level fluctuations induced by climate changes [30].
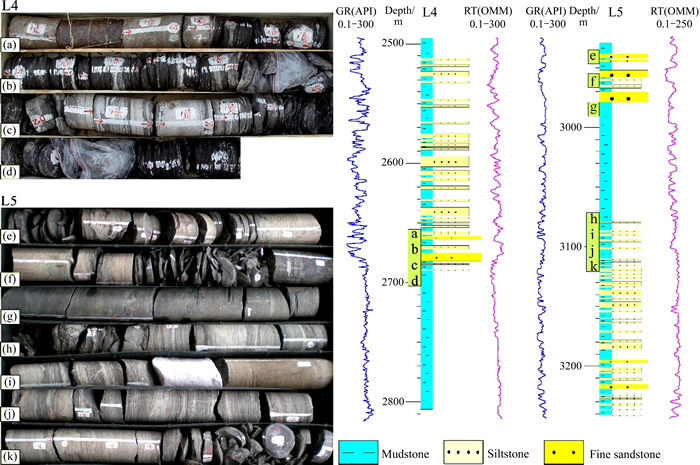
Fig. 3 Typical lithologic cores in the first member of Liushagang Formation (Els1) of wells L4 and L5, Bailian Sag, Fushan Depression
In this study, the GR curves from three boreholes located in the Bailian Sag are presented for cyclostratigraphy analysis in the Member 1 of the Liushagang Formation (Els1): Well L1, L2 and L3 (Fig. 4, see Fig. 1 for the location of wells) and the depth range of each well are 2730 to 3470 m in Well L1, 2738 to 3402 m in Well L2, and 2882 to 3409 m in Well L3 with a 0.1 m thick sampling interval in all three wells.
3.2 Orbital cyclicity and astronomical calibration
To detect and describe cyclicities, the MTM-SSA toolkit generated by the MATLAB compiler for REDFIT analysis [31] and the Morlet wavelet software given by Torrence and Compo, 1998 were utilized [32]. REDFIT includes an option for ��Welch overlapped segment averaging��, which implies splitting the time series into a number of segments, overlapping by 50%, and averaging their spectrum. Only peaks above the 95% confidence interval in the REDFIT spectrum were used, and the peaks between 90% to 95% confidence interval were selective considered. The results are shown in Fig. 4. Simple Lomb periodogram [33] from PAST program packages is also used for spectrum analysis (Fig. 8), it is a less advanced version of REDFIT spectral analysis introduced above but increases spectrum resolution.
3.3 Well-seismic calibration
A synthetic seismogram provides connections between borehole and seismic reflection data at the same location. Precise Time-Depth relationship, the base of sequence stratigraphic correlation, is derived from synthetic seismogram calibration, which is based on Geoframe software package. Time-Depth Chart, sonic and density logs, reference logs, a positive Ricker wavelet and a reference seismic trace along the borehole are take into calculating synthetic seismograms (Fig. 7). The 3D seismic profiles was acquired by PetroChina Fushan Oilfield Company in 2006 and was loaded onto a Geoframe 4.0 workstation for interactive interpretation.
4 Result
4.1 Orbital cycles
In principle, the elliptical elements of the earth��s orbit are slowly changing in time and the exact duration of Eocene orbital cycles is not identical with recent cycle durations, because of the gravitational planetary perturbations [9, 34]. This article calculated the earth��s insolation parameters during 35-40 Ma in 20�� N (the Fushan Depression latitude) with the La2004 solution [16]. Based on the parameters, the method of spectral and wavelet analysis has been used to calculate the eccentricity, obliquity and precession cycles. The results show that: the eccentricity periods are mainly of 400 ka,125 ka and 96 ka, the obliquity cycles mainly appear in 52 ka, 40 ka, 29 ka and the precession cycles are mainly dominated by 23 ka, 22 ka and 19 ka periodicity in 35-40 Ma.
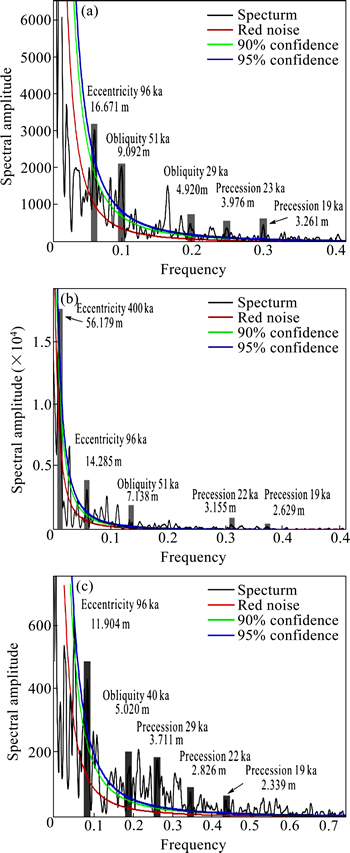
Fig. 4 Spectral analysis of natural GR logging of the first member of the Liushagang Formation (Els1) in wells L1 (a),L2 (b) and L3 (c), Bailian Sag, Fushan Depression (The power spectrum estimated using the MTM-SSA toolkit generated by the MATLAB compiler. Red curves are the red noise spectrum; The upper 90% and 95% confidence levels are shown as green and blue curves respectively; Significant peaks are labeled in meters and their corresponding orbital periods)
4.2 Spectral analysis
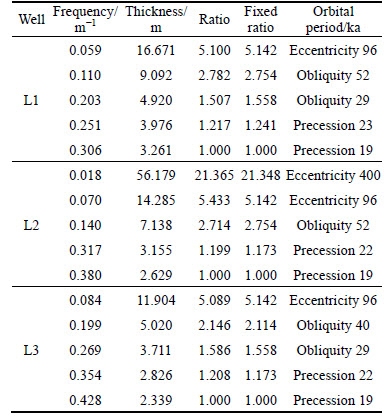
As can be seen in Fig. 4, power spectral analysis of GR data series shows a hierarchy of cycles throughout the first member of the Liushagang Formation (Els1) in three wells. The most common way to determine whether the observed thicknesses cycles in sedimentary records were orbital forcing cycles, is to compare the relative ratio of the thickness cycles with the fixed ratio of Milankovitch cycles [35-36] (Table 1). According to calculation (Fig. 4(b)), there are periodicities at frequencies of 0.018, 0.070, 0.140, 0.317 and 0.380, the corresponding thicknesses cycles of Well L2 are 56.179, 14.285, 7.138, 3.155 and 2.629 m (thickness is the reciprocal of frequency), and the ratio is 21.365:5.433: 2.714:1.199:1 which is very closed to the orbital cycle ratio: 21.348:5.142:2.754:1.173:1 (400 ka, 96 ka, 52 ka, 22 ka and 19 ka). The sedimentary cyclicities in Well L2 were likely generated due to the orbital forcing, the major cycle periods of 56.179 m, 14.285 m, 7.138 m, 3.155 m, and 2.629 m were formed by long eccentricity (400 ka), short eccentricity (96 ka), obliquity (52 ka), precession (22 ka and 19 ka) respectively. Similar to Well L2, the cycle periods of 16.671 m, 9.092 m, 4.920 m, 3.976 m, and 3.261 m were formed by short eccentricity (96 ka), obliquity (52 ka and 29 ka),precession (23 ka and 19 ka) respectively in Well L1 (Fig. 4(a)), and the cycle periods of 11.904 m, 5.020 m, 3.711 m, 2.826 m and 2.339 m were formed by short eccentricity (96 ka), obliquity (40 ka) and precession (22 ka and 19 ka) respectively in Well L3 (Fig. 4(c)).
Table 1 Sepectral analysis of natural GR logging of the first member of the Liushagang Formation (Els1) in wells L1, L2 and L3, Bailian Sag, Fushan Depression
4.3 Astronomical tuning
Spectral analysis results suggest that the GR cycles in the late Eocene Liushagang Formation (Els1) are astronomically controlled, thus, the stratigraphic cycles based on astronomical cycles are identified in Els1 of Well L2 in the Bailian Sag, Fushan Depression. As the Beibuwan Basin was adjacent to the present position (20�� N) during the late Eocene, we selected the 20�� N eccentricity curves (long eccentricity 400ka and short eccentricity 96 ka) from La2004 as target curve to provide the time constraint. The GR filter records with a frequency of 0.018 and with a frequency of 0.070 for the depth interval 2738-3402 m have the same cycle number as the long and short eccentricity of the La2004 astronomical solution from 35 Ma to 40 Ma respectively. To be easy compared between GR filter records and the eccentricity, cycles from 1 to 44 have been numbered in Fig. 5, and the tuning lines have been interpolated between them to establish the astronomical timescale for the first member of the Liushagang Formation (Els1). We used the isochron age 35.2 Ma of the well cores oxygen isotope dating at the top of Els1 [26] as the initial age control the boundary between Ewz3 and Els1, the ages of every depth in Els1 could be determined from the absolute age of 35.2 Ma (Fig. 5), the duration of Els1 is estimated as ~4.2 Ma and the average sedimentation rate in Els1 is about 0.140 m/ka. An astronomical time scale is established by tuning filtered short eccentricity cycles (96 ka) to a target curve of Well L2.
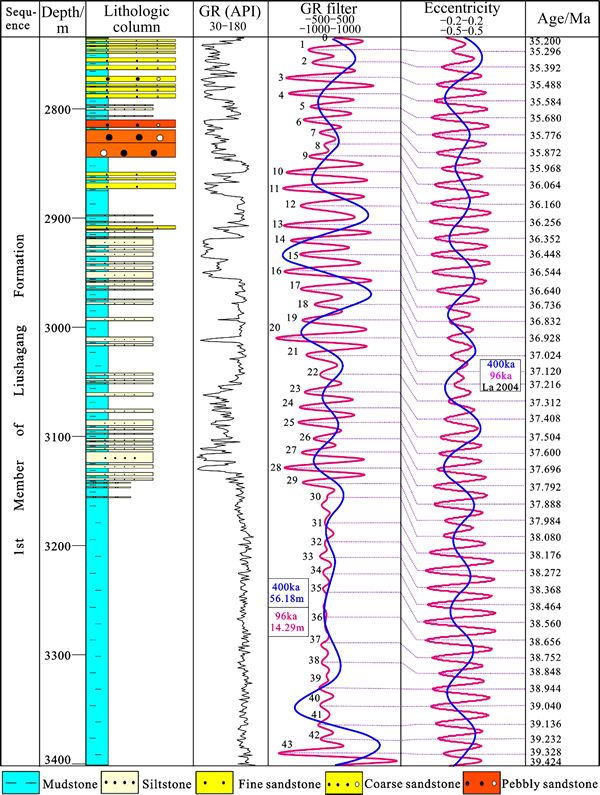
Fig. 5 Cycle counting of GR record from Well L2 for the first member of the Liushagang Formation (Els1) in Bailian Sag, Fushan Depression (The ��Eccentricity�� curves denote the long eccentricity of 400 ka (blue curve) and the short eccentricity of 96 ka (pink curve) of La2004, respectively. The GR filter curves denote the filtering results of GR in depth domain with frequency of 0.018 (blue curve) and 0.070 (pink curve) respectively)
5 Discussion
5.1 Interpretation from seismic section
Identification of sequence boundaries in the Fushan Depression is based on analysis of 3D seismic profiles complemented by well logs and core data. Seven isochronous stratigraphic interfaces in the Paleogene section which are T2, T3, T4, T5, T6, T7 and Tg (Fig. 2), T4 and T5 comprise one third order sequence: the first member of the Liushagang Formation (Els1) (Fig. 6).
During Els1 in the Bailian Sag, the lowstand system tract (LST) is not developed, the transgressive system tract (TST) is dominated by a lacustrine sedimentary system, fan delta deposits with progradation is developed in the highstand system tract (HST) [2]. According to the features of seismic reflection termination, individual units are divided into six parasequence sets with sigmoid (S-shaped) progradational stacking patterns of ascending order in HST strata (Fig. 6). The reflections with good continuity exhibiting high amplitudes show the progradational configuration of the fan delta in Els1.
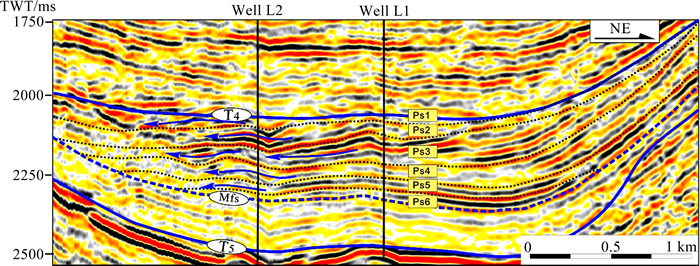
Fig. 6 NE oriented seismic profile AA�� crossing wells L1 and L2 of the first member of the Liushagang Formation (Els1) in the Bailian Sag, Fushan Depression (Blue lines show the third order sequence boundary of Els1 and the blue dashed line shows the maximum flooding surfaces in Els1. Parasequence sets are characterized by progradation and aggradation by arrows. Ps = parasequence set. See dashed line AA�� in Fig. 1 to locate this survey line)
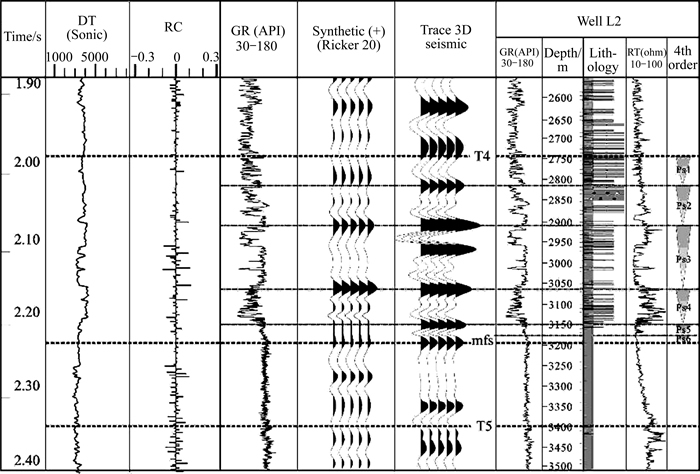
Fig. 7 Synthetic seismogram for Well L2 (Black dashed line noted the good match in reflection character. Ps = parasequence set)
5.2 Synthetic seismogram
Synthetic seismogram is used in combination with well-log and lithofacies data to more accurately identify the positions of sequence boundaries and it provides a means of determining which event relates to a sequence of interfaces [37]. The lithologic column was plotted next to the prominent reflections from the synthetic seismic trace, calculating from log velocity and density (Fig. 7). Five high-amplitude reflections, at 2.03, 2.09, 2.16, 2.21 and 2.22 s TWT are identified as the bottoms of each parasequence sets, corresponding to the depths at 2810, 2980, 3070, 3150 and 3190 m in lithologic column of Well L2 respectively (Table 2). The sixth parasequence set (Ps6) is the only questionable stratum in sequence division, it is difficult to identify in seismic with small thickness and poor continuity of reflection. The bottom of the Ps6 is bounded by the maximum flooding surface which can be identified and tracked in whole basin.
5.3 Sediment accumulation rate calibration
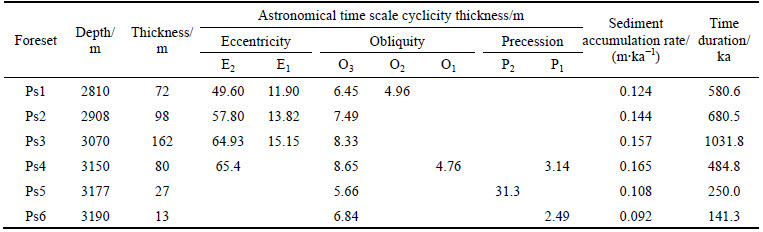
The sediment accumulation rate is calculated as sediment thickness divided by duration between two estimated ages that are estimated by the supposed orbital forcing. The sediment thickness of each parasequence set stratum in HST of Els1 of Well L2 has been determined by seismic interpretation and synthetic seismogram, which are 72, 98, 162, 80, 27 and 13 m in Ps1-Ps6 respectively (Table 2). Power spectral analysis based on Simple Lomb periodogram of PAST software package for every parasequence set show strong peak close to significance that corresponds to orbital periods (Fig. 8). The relative orbital periods for every parasequence set are different, but they are basically as same as the orbital cycles that recognized in the first member of the Liushagang Formation(400 ka,96 ka,52 ka, 22 ka and 18 ka). As can be seen in Table 2, the main factor controlling the variability of the sediment accumulation rate in Els1 is likely to be 400 ka period long eccentricity and 52 ka period obliquity, the precession period is not obvious. The fifth (Ps5) and sixth parasequence set (Ps6) strata are questionable not only in sequence division but also individual power spectral analysis. The power spectrum of Ps5 and Ps6 only reveal cycles with wavelengths of 5.66 m, 3.13 m and 4.84 m, 1.72 m, most part of the peaks in Figs. 8(e), (f) are not significant due to the limited GR data with the small thickness.
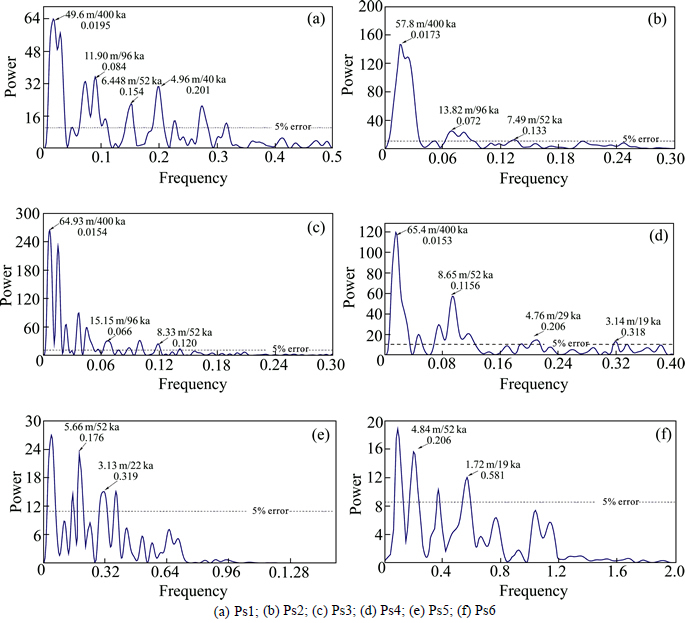
Fig. 8 Power spectrum based on Lomb periodogram algorithm of each parasequence sets in Well L2 (Significant peaks are labeled in thickness, frequency and their corresponding orbital periods, the 0.05 significance levels are shown as black dashed lines):
Table 2 Power spectrum analysis of GR logging of the first member of the Liushagang Formation in the Bailian Sag, Fushan Depression
The sediment accumulation rate is assumed to be internally consistent within each parasequence set stratum, thus, according to the thickness cycle and the corresponding astronomical period, the sediment accumulation rate within each parasequence set can be calculated (Fig. 9). The sediment accumulation rate during the highstand tract system of Els1 in Well L2 first increased obviously and then gradually decreased. Furthermore, the duration of each parasequence set is calculated as sediment thickness divided by sediment accumulation rate.
5.4 High frequency sequence stratigraphy and Inter- well correlation
Cycles and sequences can be classified in ��orders�� of growing rank from lower to higher frequencies [38]. High frequency sequences are regarded as Milankovitch cyclicity depositional sequences, which are controlled by astronomically-induced climate change and generally spanning thousands of years (Table 3). Milankovitch cycles typically produce 4th and 5th order sequences, spanning 400 ka and 100 ka intervals respectively [38-39] that indicate two main cycles with different controlling factors (long and short eccentricity). Using the well drilling data, paleontology data and the interpretation of 3D seismic data as a starting point, the sequence stratigraphy framework in Els1 of the Bailian Sag, Fushan Depression can be divided into highstand tract system (HST)and transgression system(TST),and the HST can be divided into six fourth order sequences (Ps1-Ps6) (Figs. 6 and 7). For the correlation, we attempted to compare the GR variations with astronomical cycles in the sequence stratigraphic framework.
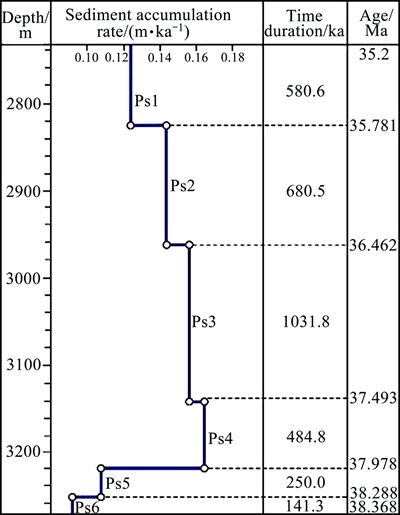
Fig. 9 Sediment accumulation rate of highstand tract system (HST) of the first member of the Liushagang Formation (Els1) in Well L2, Bailian Sag, Fushan Depression
The Inter-well correlation section crosses Well L1, L2 and L3 in the Bailian Sag (Fig. 10). All three wells contain orbital cycles known by power spectral analysis (Table 1, Fig. 4). The high frequency fluctuations in GR loggings of Well L1, L2 and L3 were identified as short eccentricity cycles (96 ka) and the GR filter records obtained in three wells show the same variation that is characterized by the same number of short eccentricity cycles,which allowed us to build the Inter-well fifth order isochronous sequence stratigraphy framework.
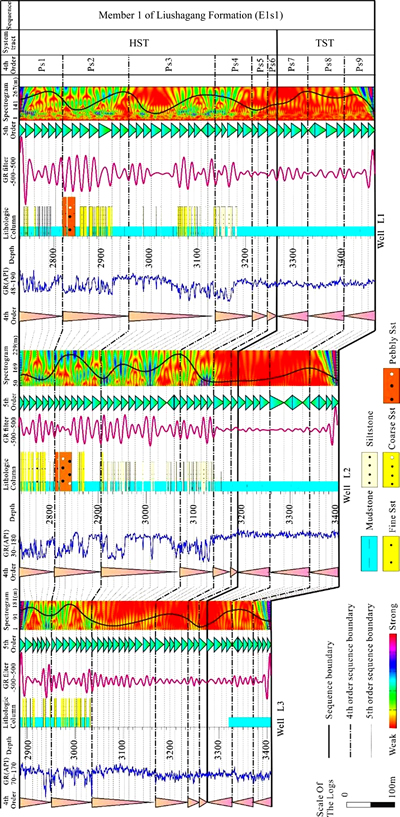
Fig. 10 Regional stratigraphic well cross-section of wells L1, L2 and L3 (The GR filter curves (pink curves) denote the filtering results of GR with frequency of 0.059 in Well L1, 0.070 in Well L2 and 0.084 in Well L3 respectively. The black lines on the wavelet spectrogram indicate the variation of the fifth order sequence thickness. See Fig. 1 for the location of three wells)
6 Conclusions
1) Cyclostratigraphic analysis of the first member of Liushagang Formation in the Late Eocene reveals significant 400 ka and 96 ka eccentricity, obliquity (52 ka, 40 ka, 29 ka) and precession (23 ka, 22 ka, 19 ka) cycles, indicating astronomically controlled sedimentation in the Bailian Sag, Fushan Depression.
2) An astronomical time scale for the sedimentary record of Well L2 is established by tuning the extracted 96 ka cycles to La2004 astronomical solution based on the sequence stratigraphic framework. The astronomical time scale provides a high resolution constraints on the ages and an independent time scale for the sequence and sea-level changes.
3) The detailed variations of sediment accumulation rates were calculated based on the high resolution astronomical timescale. The sediment accumulation rate during the highstand tract system of Els1 in Well L2 first increased obviously and then gradually decreased.
Acknowledgements
The authors would like to express their sincere gratitude to Research Institute Exploration and Development, Petro China Fushan Oilfield Company for their abundant valuable data supports.
References
[1] ZHU Wei-lin, HUANG Bao-jia, MI Li-jun, WILKINS R W T, FU Ning, XIAO Xian-ming. Geochemistry, origin, and deep-water exploration potential of natural gases in the Pearl River Mouth and Qiongdongnan basins, South China Sea [J]. AAPG Bulletin, 2009, 93(6): 741-761.
[2] JIN Si-ding, WANG Hua, CAO Hai-yang, CHEN Si, LIN Zheng-liang, YU Jiang-hao, PAN Song-qi. Sedimentation of the Paleogene Liushagang Formation and the response to regional tectonics in the Fushan Sag, Beibuwan Basin, South China Sea [J]. Austrian Journal of Earth Sciences, 2014, 107(2): 112-130.
[3] LIU En-tao, WANG Hua, LI Yuan, ZHOU Wei, LEONARD N D, LIN Zheng-liang. Sedimentary characteristic and tectonic setting of sublacustrine fans in a half-graben rift depression, Beibuwan Basin, South China Sea [J]. Marine and Petroleum Geology, 2014, 52: 9-21.
[4] LIN Zheng-liang. Research on the tectonic characteristics of Paleogene in Fushan Sag, Beibuwan Basin [D]. Wuhan: China University of Geosciences, 2011. (in Chinese)
[5] XU Wei, XIE Xi-nong. A new method to calculate sedimentary rates based on Milankovitch Cycles [J]. Petroleum geology & Experiment, 2012, 34(2): 207-214. (in Chinese)
[6] YAO Yi-ming, XU Xu-hui, LIU Cuirong, TAN Cai-ping, LUO Jia-qun, ZHU Jing-xiu. Calculation of denudation amount with Milankovitch cycle method: A case study in Biyang Sag [J]. Petroluem Geology & Experiment, 2011, 33(5): 460-467. (in Chinese)
[7] YAO Yi-min, XU Dao-yi, ZHANG Hai-feng, HAN Yan-ben, ZHANG Shou-peng, YIN Zhi-qiang, HE Qing-fang, BIAN Xue-mei. The Pliocene-Holocene astrostratigraphic study of Well Dongxin 2-4 in the Dongying Depression [J]. Journal of Stratigraphy, 2007, 31(2): 458-469. (in Chinese)
[8] TIAN Jun, WANG Pin-xian, CHENG Xin-rong, LI Qian-yu. Establishment of the Plio-Pleistocene astronomical timescale of ODP Site 1143, Southern South China Sea [J]. Earth Science-Journal of China University of Geosciences, 2005, 30(1): 31-39. (in Chinese)
[9] BERGER A, LOUTRE M F, LASKAR J. Stability of the astronomical frequencies over the earth��s history for paleoclimate studies [J]. Science New Series, 1992, 255(5044): 560-566.
[10] ABELS H A, AZIZ H A, KRIJGSMAN W, SMEETS S J B, HILGEN F J. Long-period eccentricity control on sedimentary sequences in the continental Madrid Basin (middle Miocene, Spain) [J]. Earth and Planetary, Science Letters, 2010, 289(1/2): 220-231.
[11] HILGEN F J. Extension of the astronomically calibrated (polarity) time scale to the MiocenePliocene boundary [J]. Earth and Planetary Science Letters, 1991, 107(2): 349-368.
[12] LASKAR J. The chaotic motion of the solar system: A numerical of the size of the chaotic zones [J]. Icarus, 1990, 88(2): 266-291.
[13] RIO D, SILVA L P, CAPRARP L. The geological time scale and the Italian stratigraphic record [J]. Episodes, 2003, 26(3): 259-263.
[14] GRADSTEIN F M, OGG J G, SMITH A G. A geologic time scale 2004 [M]. 3rd ed. Cambridge: Cambridge University Press, 2004: 440.
[15] LAURIN J, SAGEMAN B. Cenomanian-Turonian coastal record in SW Utah, U.S.A: Orbital-scale transgressiveregressive events during Oceanic Anoxic Event II [J]. Journal of Sedimentary Research, 2007, 77(9): 731-756.
[16] LASKAR J, ROBULET P, JOUTEL F, GASTINEAU M, CORREIA A C M, LEVRARD B. A long-term numerical solution for the insolation quantities of the earth [J]. Astronomy and Astrophysics, 2004, 428(1): 261-285.
[17] KANG Xi-dong, ZHAO Wen-cui, PAN Zhi-gui, ZHANG Qi-ming, CHEN Zhi-yong. Study on architecture of sequence stratigraphic framework of Beibuwan Basin [J]. Journal of Earth Science, 1994, 19(4): 493-502. (in Chinese)
[18] DU Zheng-chuan. Structural features and the controlling function of sedimentary from Tertiary in Beibuwan Basin, the South China Sea [J]. Journal of Hebei Mining and Civil Engineering Institute, 1997, 1(1): 55-59. (in Chinese)
[19] ZHU Wei-lin, WU Guo, LI Ming-bi. Palaeolimology and hydrocarbon potential in Beibu Gulf Basin if South China Sea [J]. Oceanologia et Limnologia Sinica, 2004, 35(1): 8-14. (in Chinese)
[20] SHI Yan-min, LIU Ju, ZHANG Mei-zhu, CHEN Da-xian, MA Qing-lin. Experience and understand in oil and gas exploration in Fushan Sag, Hainan Province [J]. South China Journal of Seismology, 2007, 27(3): 57-68. (in Chinese)
[21] LIU En-tao, WANG Hua, LIN Zheng-liang, LI Yuan, MA Qing-lin. Characteristics and hydrocarbon enrichment rules of transfer zone in Fushan Sag, Beibuwan Basin [J]. Journal of Central South University: Science and Technology, 2012, 43(10): 3947-3965. (in Chinese)
[22] LIU En-tao, WANG Hua, LIAO Yuan-tao, MA Qing-lin, LIN Zheng-liang. Constraints by transfer zone on sequences and depositional system in Fushan Sag, Beibuwan Basin [J]. Journal of China University of Petroleum: Edition of Natural Science, 2013, 37(4): 17-22. (in Chinese)
[23] HE You-bin, GAO Zheng-zhong. Sedimentary facies of the Liushagang Fomation of Paleogene in Fushan Sag of Hainan Island [J]. Palaeogeography, 2006, 8(3): 365-376. (in Chinese)
[24] SHI Xiao-bin, KOHN B, SPENCER S, GUO Xing-wei, LI Ya-min, YANG, Xiao-qiu, SHI Hong-cai, GLEADOW A. Cenozoic denudation history of souther Hainan Island, South China Sea: Constaints from low temperature thermochronology [J]. Tectonophysics, 2011, 504(1/2/3/4): 100-115.
[25] HAQ B U, HARDENBOL J, VAIL P R. Mesozoic and Cenozoic chronostratigraphy and eustatic cycles [J]. Society of Economic Paleontologist and Special Publication U. S. A., 1988, 42: 71-108.
[26] XIE Jin-you, LI Jun, MAI Wen, ZHANG Huo-lan, CAI Kan-lu, LIU Xin-yu. Palynofloras and age of the Liushagnag and Weizhou Formation in the Beibuwan Basin, South China Sea [J]. Acta Palaeontologica Sinica, 2012, 51(3): 385-394. (in Chinese)
[27] LUO Wei, XIE Jin-you, LIU Xin-yu, HU Wen-yan, ZHANG Jian-xin, ZHOU Wei. The study of paleogene climate in the Haizhong Depression, Beibuwan Basin, Northern South China Sea [J]. Acta Micropalaeontologica Sinica, 2013, 30(3): 288-296. (in Chinese)
[28] HINNOV, L A. New perspectives on orbitally forced stratigraphy [J]. Annual Review of Earth and Planetary Sciences, 2000, 28(1): 419-475.
[29] PROKOPH A, VILLENEUVE M, AGTERBERG F P. Geochronology and calibration of global Milankovitch cyclicity at the Cenomanian-Turonian boundary [J]. Geology, 2001, 29(6): 523-526.
[30] HINNOV L. Earth��s orbital parameters and cycle stratigraphy [C]// GRADSTEIN F M, OGG J G, SMITH A G. A Geologic Time Scale 2004 (third edition). Cambridge: Cambridge University Press, 2004: 55-62.
[31] SCHULZ M, MUDELSEE M. REDFIT: estimatingred-noise spectra directly from unevenly spaced Paleoclimatic time series [J]. Computers & Geoseiences, 2002, 28(3): 421-426.
[32] TORRENCE C, COMPO P G. A practical guide to wavelet analysis [J]. Bulletin of the American Meteorological Society, 1998, 79(1): 61-78.
[33] PRESS W H, TEUKOLSKY S A, VETTERLING W T, FLANNERY B P. Numerical Recipes in C [M]. 2nd ed. Cambridge: Cambridge Univ Press, 1992.
[34] LASKAR J, FIENGA A, GATINEAU M, MANCHE H. La2010: A new orbital solution for the long-term motion of the Earth [J]. Astronomy and Astrophysics, 2011, 532: A89.
[35] WEEDON G P. Time-series analysis and cyclostratigraphy [M]. Cambridge: Cambridge University Press, 2003.
[36] HILGEN F J, KRIJGAMAN W, LANGEREIS C G, LOURENS L J. Breakthrough made in dating of the geological records [J]. EOS, 1997, 78(28): 288-289.
[37] SHERIFF R E. Limitations on resolution of seismic reflections and geological detail derivable from them [J]. PAYTON C E. Seismic Stratigraphy-Applications to Hydrocarbon Exploration AAPG (Tulsa), Memoir, 1977, 26: 3-14.
[38] MITCHUM R M J, VAN W J C. High-frequency sequences and their stacking patterns: Sequence-stratigraphic evidence of high frequency eustatic cycles [J]. Sedimentary Geology, 1991, 70(2/3/4): 131-160.
[39] VAIL P R, MITCHUM R M, SANGREE J B. Concepts of depositional sequences [C]// Sequence Stratigraphic Models for Exploration and Production: Evolving Methodology, Emerging Models, and Application Histories: 22nd Annual. GCSSEPM Foundation Annual Bob F. Perkins Research Conference Proceedings. Houston, USA: GCSSEPM, 2002: 19-32.
(Edited by DENG L��-xiang)
Foundation item: Projects(41472084, 41172123) supported by the National Natural Science Foundation of China
Received date: 2015-02-09; Accepted date: 2015-06-11
Corresponding author: WANG Hua, PhD; Tel: +86-27-67883064; E-mail: wanghua@cug.edu.cn
Abstract: Sediments in the Liushagang Formation of Late Eocene form a group of key hydrocarbon play fairways in the Beibuwan Basin, South China Sea. As an important reservoir-forming combination, the Liushagang Formation consists of deltaic siliciclastic and show clear sedimentary cyclicity. According to paleontology research and stratigraphic correlation, the boundary between Liushagang Formation (Els) and Weizhou Formation (Ewz) is regarded as the Eocene-Oligocene boundary. The oxygen isotope dating for well cores from the top of the first Member of Liushagang Formation (Els1) and the bottom of the third Member of Weizhou Formation (Ewz3) give an isochron age of 35.2 Ma. Here, we use GR logging data as a paleoenvironmental proxy to conduct a detailed cyclostratigraphic study of the Els1 in the Bailian Sag, Fushan Depression. Power spectra, evolutionary fast Fourier transformation and wavelet analysis all reveal significant sedimentary cycles in Els1. The ratios of cycle wavelengths in these stratigraphic units are 21:5:2.8:1.2:1, and are interpreted as Milankovitch cycles of 400 ka and 96 ka eccentricity, 52 ka obliquity, 22 ka and 19 ka precession cycles, respectively. An astronomical time scale is established by tuning filtered 96 ka eccentricity cycles to a target curve of Well L2 in the Bailian Sag. Based on regional stratigraphic framework, combined with seismic, cores and logging data, the HST of the first member of the Liushagang Formation (Els1) delta in Well L2 was divided into six parasequence sets named Ps1-Ps6. According to the spectrum analysis by Simple Lomb periodogram from PAST program packages, the sediment accumulation rate of each parasequence sets first increased and then decreased as time went by. The sediment accumulation rate of Ps4 reached the maximum (0.127 m/ka) during the most prosperous period of delta prograding. Finally, the duration of each period of parasequence sets and more accurate geological age were calculated on the basis of sediment accumulation rate. The ages of each depth are precisely estimated and provide new constraints on the Late Eocene.
