
J. Cent. South Univ. (2017) 24: 1676-1683
DOI: 10.1007/s11771-017-3574-x

CHANG Hong(����)1, 2, XIA Jun-wu(�ľ���)1, 2
1. Mechanics and Civil Engineering, China University of Mining & Technology, Xuzhou 221116, China;
2. Key Laboratory of Deep Coal Resources Mining of Ministry of Education (China University of
 Central South University Press and Springer-Verlag Berlin Heidelberg 2017
Abstract:
The characteristics of a disturbed soil-structure interface were studied based on the variation regularities of the disturbed soil within its mining subsidence area using direct shear tests. The effects of the initial moisture content on the shear strength parameters of the soil-structure interfaces were analyzed. The results indicate that the cohesion of the interface initially increased and then decreased as the initial moisture content increased. In addition, the friction angle of the interface decreased as the initial moisture content increased. A constitutive model of the disturbed soil-structure interface, a rigid-plastic model based on the initial void ratio and saturability (VSRP) model, was established based on the results. In order to validate this model, a finite element analysis of DRS-1 direct shear tests was conducted. The finite element model calculations coincided with the results of the DRS-1 direct shear tests. The proposed model also reflected the nonlinear features of the soil-structure interface.
Key words:
mining subsidence areas; soil-structure interface; rigid-plastic model; finite element method��
1 Introduction
Soil-structure interface models are the foundation of soil-structure interaction studies. Accurate and practical constitutive models allow for the simulation of soil-structure interactions. Various constitutive models have been developed, such as the hyperbolic model proposed by CLOUGH and DUNCAN [1], the elastic- plastic model proposed by BRANDT [2] and CHEN [3], the rigid-plastic model proposed by YIN et al [4], the contact model for mobile overburden-masonry structures proposed by YUAN et al [5] the nonlinear elastic-ideal plastic model proposed by LUAN and WU [6], the shear slip model proposed by GAO et al [7], and the damage model [8-11]. In previous work, BRANDT [2] determined that the rigid-plastic model was most similar to the real interface failure model. In addition, YIN et al [4] developed a rigid-plastic model after observing the deformation exhibited by bodies of soil in a contact face using a micro ��periscope��. HU et al [12] conducted a finite element numerical simulation on the direct shear test results of an indoor contact face using the rigid- plastic model, nonlinear elastic model, and ideal elastoplastic model. The simulation results indicated that these different constitutive models did not vary significantly. WANG et al [13] conducted soil-rock contact face tests at various moisture contents and compared the results to data obtained from a soil brick contact face. Furthermore, WANG et al [13] developed a contact face (��-��) composite exponential model in order to identify the rigidifying and softening properties of the faces. DURIEZ and VINCENS [14] applied constitutive modeling to cohesionless soils and interfaces likely to exhibit significant changes throughout the loading process. LASHKARI [15-17] developed critical state compatible models for sand�Cstructure interfaces. These models were used to simulate the behavior of interfaces with a wide range of density and stress values using a unique set of parameters. Although the original elasto-plastic model proposed by LASHKARI [17] can only be applied to dry and saturated interfaces, it has been extended to simulate the mechanical behavior of unsaturated interfaces without the multiple calibrations commonly associated with changes in matric suction [18].
OLIVIER and HARLAKA [19] developed a soil-structure body model using finite element software. The six-node interface element of this model was used to simulate the probability of slippage and separation between a soil body and structure. Based on the surface deformation rules and stress and deformation characteristics of the frame structure of a strip foundation, XIA et al [20] developed a theoretical model for subsoil-strap footing-framework interactions in mining subsidence areas. This model can be used to calculate the mobile deformation and other internal forces of buildings caused by mining within mining subsidence areas.
However, the existing soil-structure interface constitutive model does not consider the effects of mining disturbances, and the combined action model does not account for the differences among interfaces. Therefore, these two models cannot be universally applied. In this work, a soil-structure interface model that accounts for mining disturbances was developed. According to the results, the disturbed soil primarily exhibited void ratio and saturability changes. Therefore, direct shear tests were conducted at various initial void ratios and saturabilities. Based on the results of the direct shear tests and the relationships among the initial moisture content, initial void ratio, and saturability of the soil-structure interface, an interfacial shear strength equation and soil-structure interface VSRP model were developed. The results of this work could be used as a resource in future studies concerning soil-structure interactions resulting from mining disturbances in order to improve the structural integrity of buildings within mining subsidence areas.
2 Disturbed soil-structure interface shear tests
2.1 Testing system
The DRS-1 high-pressure direct shear testing system used in this work consists of a mainframe, measuring system, control system, and data collection system. The mainframe is comprised of a horizontal loading device, normal loading device, shear box, counter-force frame, and base, as shown in Fig. 1. Worm- gear and ball-screw driving modes were adopted during the horizontal and normal loading processes. Both the maximum normal load and maximum shear load were equal to 60 kN.
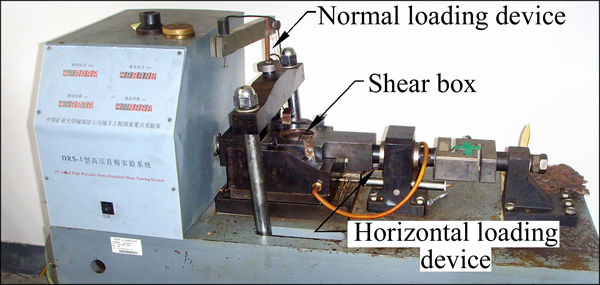
Fig. 1 DRS-1 high-pressure direct shear testing system mainframe
First, the concrete portion of each sample was placed face-down into the shear cell. Filter paper and porous stone were placed on the top and bottom of each sample, respectively. Then, the normal stress loading device was installed. The normal stress value, shearing rate, loading series, and shear displacement values of each sample were determined using a data collection system. Next, the shear tests were conducted. Initial normal stress was imposed by the normal stress loading device. Once the desired normal stress value was achieved, the horizontal loading device acted upon the upper shear box, and the interface of each sample engendered relative shear displacement.
The tests were concluded when the shear stress became constant or the relative shear displacement of the interface reached 6 mm.
2.2 Sample
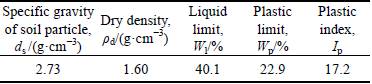
Clay samples were used for the purposes of this test. The physico-mechanical indices of the clay are shown in Table 1. The samples were prepared according to the designated void ratio and saturability values. The prepared samples were sealed in a plastic bag for approximately 1-2 d to ensure even moisture distribution.
Table 1 Physico-mechanical indices of soil
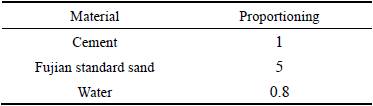
Due to its small size (61.8 mm), ordinary cement mortar was used to construct the structure block. The cement mortar was prepared according to M10 guidelines using 325 ordinary Portland cement and Fujian standard sand. The proportions of the cement mortar are shown in Table 2.
Table 2 Proportions of cement mortar
2.3 Sample preparation
The dimensions of the standard samples were �ա�h= 61.8 mm��20 mm. The cement mortar was poured into a self-made mold in order to obtain these sample sizes. The dimensions of the samples were strictly controlled. The samples were prepared in specially designed compression mold using the pre-stressing method. The compression mold consisted of a canister, upper pressure head, and lower pressure head, as shown in Fig. 2. The inner wall of the canister and surfaces of the upper and lower pressure heads were ground and subjected to heat treatments in order to improve the finish and hardness of the compression mold.
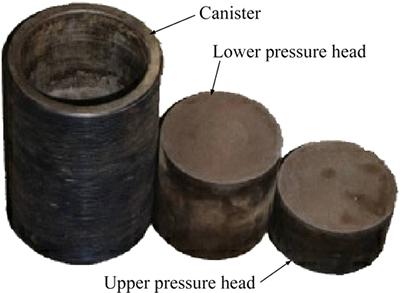
Fig. 2 Compression mold
First, the soil samples were subjected to oven drying at 105-110 ��C for no less than 8 h. The oven-dried soil samples were then pulverized with a crusher until the soil was fine enough to pass through a 0.2-mm sieve. Then, the pulverized samples were weighed. Next, the soil particles were mixed with preset amounts of water, which was obtained from a spray bottle. The resulting mixtures were then sealed in plastic bags and stored in a sealed cylinder for over 24 h in order to ensure even moisture distribution.
The prepared structure block was placed in the canister. Then, a precisely-weighed soil sample was placed in the prepared structure block. The two pressure heads were installed flush with the top and bottom of the canister. After pressure was applied and maintained for approximately 1-2 min, the samples were removed from the mold. The structure block was then combined with each soil sample according to the designed initial void ratio and saturability, as shown in Fig. 3.
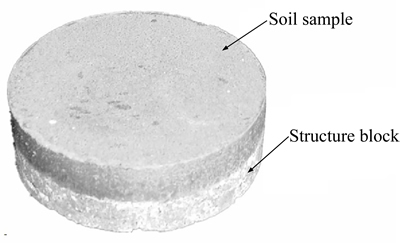
Fig. 3 Standardized soil-structure interface sample
2.4 Interface testing program
The void ratios of the disturbed soil within the mining subsidence areas initially increased, but eventually decreased. The soil in these areas exhibited relatively high void ratios during the mining process. However, the void ratios gradually decreased in the late stages of the mining process. Over time, the void ratios became approximate to the void ratios before mining. The saturability of the soil also changed. Thus, direct shear tests were conducted while accounting for the normal stress values, initial void ratios, and saturability values of the clay samples. Fifteen samples were used in these tests. The soil samples exhibited initial void ratios (e0) of 0.3, 0.4, 0.5, 0.6, and 0.7; initial saturability values (Sr0) of 50%, 75%, and 100%; normal stress values of 100, 200, 400, and 800 kPa.
In order to reduce the influence of normal stress on the initial void ratio and initial saturability of each soil sample, a fast shear rate was used in the tests. In addition, parallel tests were conducted in order to ensure the replicability of the test results. Since the contact face between the structure block and each soil sample was a naturally-cast smooth face, the effects of surface roughness were not considered.
2.5 Direct shear test results
Sixty direct shear tests were conducted at different normal stress values, initial void ratios, and initial saturability values [21]. The direct shear testing system was used to collect various data, such as normal stress, shear stress, normal displacement, and tangential displacement values. The relationship between the shear strength and normal stress at e0=0.6 is shown in Fig. 4. The selected shear strength yielded the peak shear stress. According to the results of the linear regression obtained using the least square method, the interfacial shear strength and normal stress exhibited a linear relationship. This relationship was described using the Mohr-Columb strength equation.
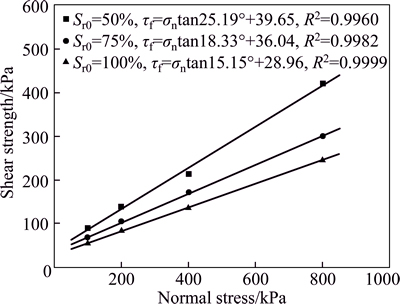
Fig. 4 Shear strength-normal stress fitting curve of soil- structure interface at e0=0.6
Based on Mohr-Columb strength equation, the shear strength parameters (i.e., the cohesion and frictional angle) of the fifteen soil samples were calculated, as shown in Table 3.
2.6 Effects of initial moisture content on interfacial shear strength
As shown in Fig. 5, the relationships between the initial void ratio and the cohesion and frictional angle of the soil-surface interface at different initial saturability values were determined based on the data presented in Table 3.
Table 3 Shear strength parameters of soil-structure interface
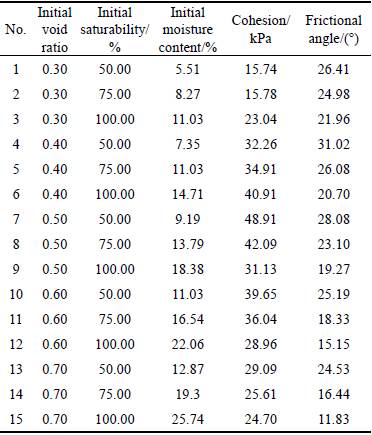
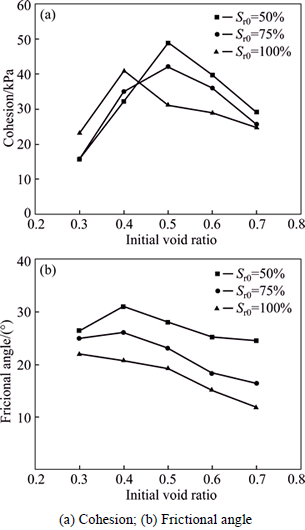
Fig. 5 c-e0 and f-e0 curves of soil-structure interface
As shown in Fig. 5(a), the cohesion of the soil- structure interface initially increased, but then decreased as a function of the initial void ratio. When the initial void ratio (e0) was equal to 0.3 and 0.4 and the initial saturability remained constant, the cohesion of the soil-structure interface increased as a function of the initial saturability. When the initial void ratio (e0) ranged from approximately 0.5 to 0.7 and the initial saturability remained constant, the cohesion of the soil-structure interface decreased as a function of the initial saturability. Due to the hydrophilic properties of concrete, the free water in the soil near the interface permeated towards the structure, enhancing the water bonds between the soil particles and structural particles at the interface. At low void ratios, the moisture content of the soil increased as a function of the saturability, and the water bonds between the soil particles and structural particles at the interface were enhanced. This manifested as an increase in the interface cohesion as a function of the saturability. At high void ratios, the water film between the soil particles and structural particles increased as a function of the moisture content, weakening the water bonds. This manifested as a decrease in the interface cohesion as a function of the saturability.
As shown in Fig. 5(b), the frictional angle of the soil-structure interface decreased as a function of the initial void ratio as the initial saturability remained constant and decreased as a function of the initial saturability as the initial void ratio remained constant. When the initial saturability remained constant, the increase in the void ratio caused the number of soil particles per unit area to decrease. According to the principle of effective stress, a decrease in the effective contact area of a soil-structure interface manifests as a decrease in the frictional angle. When the initial void ratio remained constant, the increase in the moisture content as a function of the initial saturability thickened the water film between the soil particles and structural particles. This thickening lubricated the interface and reduced the amount of effective contact area between the soil particles and structural particles, reducing the amount of frictional force. This manifested as a decrease in the frictional angle.
The initial moisture content was calculated based on the initial void ratio and initial saturability of each soil sample using Eq. (1). The results are shown in Table 3.
 (1)
(1)
where w0 represents the initial moisture content; e0 represents the initial void ratio; Sr0 represents the initial saturability; and Gs represents the specific gravity of the soil. Since Gs of clay ranges from approximately 2.71 to 2.73, it was assumed to be constant.
Furthermore, the relationships between the initial moisture content and the cohesion and frictional angle of the soil-surface interface were determined.
As shown in Fig. 6(a), the cohesion of the soil-structure interface initially increased, but then decreased as a function of the initial moisture content. At high initial moisture contents (14.71%~25.74%), the cohesion decreased as a function of the initial moisture content, and at low initial moisture contents (5.51%~ 13.79%), the cohesion fluctuated significantly, but increased overall.
As shown in Fig. 6(b), the frictional angle of the soil-structure interface decreased linearly as a function of the initial moisture content. However, minor fluctuations were observed at low initial moisture contents (5.51%-11.03%).
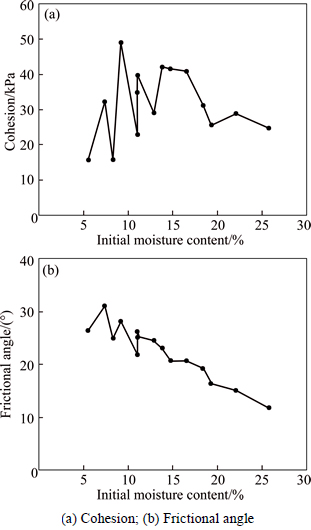
Fig. 6 c-w0 and f-w0 curves of soil-structure interface
3 Constitutive model of disturbed soil- structure interface
3.1 Rigid-plastic model based on initial void ratio and saturability
In order to further investigate the relationships among the shear strength parameters, initial void ratio, and saturabilitiy indices, the initial moisture content of each soil sample was expressed as a percentage. The cohesion and frictional angle values of the soil-structure interface were processed via normalization; i.e., the cohesion and frictional angle values were divided by their respective initial moisture contents. The data, expressed as processed initial void ratios ranging from approximately 0.4 to 0.7, was used to establish the normalized curves of the relationships between the initial moisture content and the cohesion and frictional angle of the soil-surface interface, as shown in Fig. 7.

Fig. 7 c/W-W and f/W-W fitting curves of soil-structure interface
The resulting data was nonlinearly fit using Origin software. The results are shown in Fig. 7. The fitting equations of the initial void ratio and saturability were calculated as
 (2)
(2)
 (3)
(3)
where ci and fi represent the cohesion and frictional angle of the soil-structure interface, respectively; W represents the initial moisture content; Cc and Dc represent the cohesion fitting parameters, with values of 13.93559 and 0.89102, respectively; and Cf and Df represent the frictional angle fitting parameters, with values of 8.83644 and 0.88804, respectively.
By substituting Eq. (1) into Eqs. (2) and (3), the cohesion and frictional angle equations, in terms of the initial void ratio and saturability, can be expressed as
 (4)
(4)
 (5)
(5)
Since the rigid-plastic model accurately describes the nonlinear characteristics of shear stress-shear displacement, some of the parameters in this model were easily determined. Consequently, the rigid-plastic model, which was based on the initial void ratio and saturability (VSRP) model, was established using the results of the direct shear tests. In this model, relative displacement did not occur when the interfacial shear stress was less than the interfacial shear strength. In addition, plastic slips occurred when the interfacial shear stress was equal to the interfacial shear strength and the amount of displacement was unlimited. The VSRP model can be expressed mathematically as
 (6)
(6)
3.2 Numerical implementation of VSRP model
Although interface elements are essential to the finite element analysis of contact issues, no interface element can be used to simulate all contact statuses. Since commonly used interface elements are based on different hypotheses, they are used to simulate various interfacial deformations.
The VSRP model interface element, a zero- thickness element similar to that proposed by Goodman, was implemented using the FRIC subprogram ABAQUS. According to the three-dimensional zero-thickness interface element of the VSRP model, neglecting tangential coupling, normal coupling, and the mutual effects of shear stress in both directions, the stress-strain relationship can be expressed as
 (7)
(7)
where ����n and ����n represent the normal stress and strain increments, respectively; ����t1 and ����t1 represent the tangential stress and strain increments in x, respectively; ����t2 and ����t2 represent the tangential stress and strain increments in y, respectively; and Ei is a constant that represents the normal contact status. Ei is used to determine whether interface separation has occurred. In addition, G1 and G2 are constants used to determine whether slippage has occurred in the tangents of the x and y axes. When ��<��fi, the values of G1 and G2 are high, indicating no slippage and deformation on the interface. When ��=��fi, G1 and G2 are low, indicating plastic slippage and deformation on the interface.
3.3 Validation of VSRP model
3.3.1 Direct shear test calculation model
The DRS-1 direct shear test calculation model was established using ABAQUS. As shown in Fig. 8, the model consisted of an upper shear cell, soil sample, concrete block, and normal loading block. This model was simplified by replacing the concrete blocks on the bottom and lower shear cell of the model with a single concrete block. This simplification reduced the number of contact settings and improved the efficiency of the model.
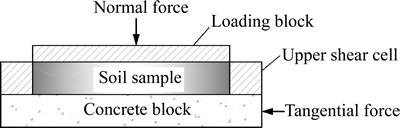
Fig. 8 Direct shear test calculation model
In order to further simplify the calculations, the concrete block, upper shear cell, and loading block of the model were arranged into a single, discrete, rigid part. The constitutive relationships among the soil samples followed the Mohr-Coulomb model. The cohesion and frictional angle of the model were determined using the shear test results. The elasticity modulus was obtained using Eq. (8). The contact area between each soil sample and the concrete block was described using the user-defined VSRP subprogram. The initial void ratio and saturability of the surface-soil interface were included as parameters in this subprogram. The contact area between each soil sample and the loading block and upper shear cell of the model were described using the ABAQUS default friction model.
 (8)
(8)
In this equation, E represents the elasticity modulus, Es represents the oedometer modulus, and v is Poisson ratio.
3.3.2 Finite element calculation results and analysis
Normal forces were applied and direct shear tests were conducted via displacement control according to the steps outlined in the DRS-1 direct shear tests. Then, 48 models with different void ratios (e0=0.4, 0.5, 0.6 and 0.7), saturability values (Sr0=50%, 75% and 100%), and normal stress values (��n=100, 200, 400 and 800 kPa) were constructed. The counter-force of the horizontal load in the destination file and the horizontal displacement were used to determine the relationship between the shear stress and shear displacement of the soil-structure interface. Then, as shown in Fig. 8, the VSRP model calculations and DRS-1 direct shear test results obtained when Sr0=75% were compared.
As shown in Fig. 9, the interfacial shear stress increased as a function of the shear displacement but became constant as the stress approximated the interfacial shear strength. As the normal stress increased, the interfacial initial shear modulus increased. The shear displacement also increased as the stress approximated the shear strength. The finite element model calculations coincided with the results of the DRS-1 direct shear tests, validating the VSRP model. The model also reflected the nonlinear features of the soil-structure interface. As the void ratio increased, the shear displacement also increased as it approximated the shear strength. In addition, the nonlinear features became more apparent as the void ratio increased. This was primarily because the decrease in the elasticity modulus of the soil samples as a function of the void ratio increased the shear deformation of the soil. Thus, the nonlinear features of the soil- structure interface were macroscopic.
4 Conclusions
1) The cohesion of the soil-structure interface initially increased and then decreased as a function of the initial moisture content. When the initial moisture content ranged from approximately 5.51% to 13.79%, the cohesion fluctuated significantly, but increased overall. When the initial moisture content ranged from approximately 14.71% to 25.74%, the cohesion decreased as a function of the initial moisture content. The frictional angle of the soil-structure interface decreased as a function of the initial moisture content
2) Based on the results of the analysis, a rigid- plastic constitutive model of the disturbed soil-structure interface based on the initial void ratio and saturability (VSRP) model was established. In addition, the three- dimensional zero-thickness element of the VSRP model was determined using the FRIC subprogram. A finite element analysis of the DRS-1 direct shear tests was conducted in order to validate the VSRP model. The finite element model calculations corresponded with the results of the DRS-1 direct shear tests. The model also reflected the nonlinear features of the soil-structure interface.
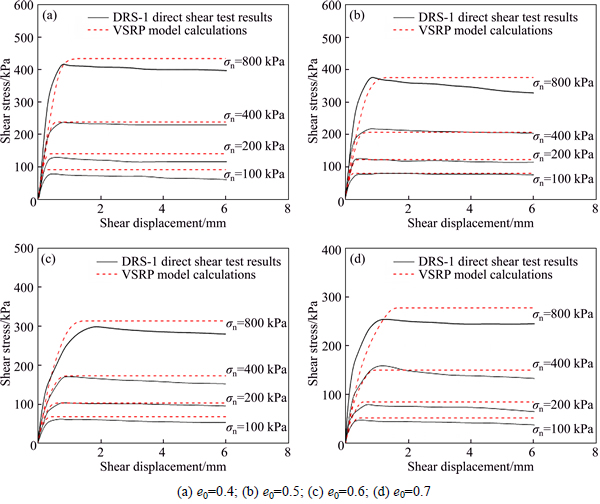
Fig. 9 Comparison of the VSRP model calculations and DRS-1 direct shear test results for Sr0=75%
References
[1] CLOUGH G W, DUNCAN J M. Finite element analyses of retaining wall behavior [J]. Journal of the Soil Mechanics and Foundations Division, 1971, 97(12): 1657-1673.
[2] BRANDT J R T. Behavior of soil-concrete interfaces [D]. Edmonton: University of Alberta, 1985.
[3] CHEN Hui-yuan. The friction contact element and its analysis method [J]. Journal of Hydraulic Engineering, 1985(4): 44-50. (in Chinese)
[4] YIN Zong-ze, ZHU Hong, XU Guo-hua. Numerical simulation of the deformation in the Interface between soil and structural material [J]. Chinese Journal of Geotechnical Engineering, 1994, 16(3): 14-22. (in Chinese)
[5] YUAN Ying-shu, QIN Jie, CAI Yue. Modeling of soil and brick masonry structure interaction due to ground movement [J]. Journal of China University of Mining & Technology, 1998, 27(4): 336-339. (in Chinese)
[6] LUAN Mao-tian, WU Ya-jun. A nonlinear elasto-perfectly plastic model of interface element for soil-structure interaction and its applications [J]. Rock and Soil Mechanics, 2004, 25(4): 507-513. (in Chinese)
[7] GAO Jun-he, YU Hai-xue, ZHAO Wei-bing. Characteristics study of interface between soil and concrete by using large size single shear apparatus and numerical analysis [J]. China Civil Engineering Journal, 2000, 33(4): 42-46. (in Chinese)
[8] DESAI C S, MA Y. Modelling of joints and interfaces using the disturbed-state concept [J]. International Journal for Numerical and Analytical Methods in Geomechanics, 1992, 16(9): 623-653.
[9] HU Li-ming, PU Jia-liu. Damage model of soil-structure interface [J]. Rock and Soil Mechanics, 2002, 23(1): 6-11. (in Chinese)
[10] YANG Lin-de, LIU Qi-jian. Research on statistical damage model of soil-structure interface [J]. Chinese Journal of Underground Space and Engineering, 2006, 2(1): 79-82. (in Chinese)
[11] XIA Hong-chun, ZHOU Guo-qing, SHANG Xiang-yu. Statistical damage softening constitutive model of soil-structure interface based on Weibull random distribution [J]. Journal of China University of Mining & Technology, 2011, 40(6): 846-851. (in Chinese)
[12] HU Li-ming, MA Jie, ZHANG Bing-yin. Numerical simulation of interface failure during direct shear tests [J]. Journal of Tsinghua University: Sci & Tech, 2008, 48(6): 943-946. (in Chinese)
[13] WANG Wei, ZHANG Fang, SUN Bin-xiang. Tested and modeled shear stress-displacement behavior of soil-structure interface [J]. Journal of China Coal Society, 2011, 36(9): 1469-1473. (in Chinese)
[14] DURIEZ J, VINCENS E. Constitutive modelling of cohesionless soils and interfaces with various internal states: An elasto-plastic approach [J]. Computers and Geotechnics, 2015, 63: 33-45.
[15] LASHKARI A. A state dependent constitutive model for sand-structure interfaces [C]// Benz & Nordal eds. Numerical Methods in Geotechnical Engineering (NUMGE 2010), Trondheim, Norway: NUMGE, 2010, 9-14.
[16] LASHKARI A. A plasticity model for sand-structure interfaces [J]. Journal of Central South University of Technology, 2012, 19: 1098-1108.
[17] LASHKARI A. Prediction of the shaft resistance of nondisplacement piles in sand [J]. International Journal for Numerical and Analytical Methods in Geomechanics, 2013, 37(8): 904-931.
[18] LASHKARI A, KADIVAR M. A constitutive model for unsaturated soil�Cstructure interfaces [J]. International Journal for Numerical and Analytical Methods in Geomechanics, 2016, 40: 207-234.
[19] OLIVIER D, HARLALKA A. Numerical study of the soil-structure interaction within mining subsidence areas [J]. Computers and Geotechnics, 2010, 37(6): 802-816.
[20] XIA Jun-wu, YUAN Ying-shu, DONG Zheng-zhu. Mechanism study on subsoil-strap footing-framework interaction in mining subsidence area [J]. Chinese Journal of Geotechnical Engineering, 2007, 29(4): 537-541. (in Chinese)
[21] CHANG Hong, XIA Jun-wu, KONG Wei, ZHANG Pei-bo, TANG Xiao-xiang. Experimental study on shear characteristics of disturbed soil-structure interface within mining subsidence areas [J]. Journal of China University of Mining & Technology, 2013, 42(4): 535-539. (in Chinese)
(Edited by DENG L��-xiang)
Cite this article as:
CHANG Hong, XIA Jun-wu. Constitutive model of disturbed soil-structure interface within mining subsidence areas [J]. Journal of Central South University, 2017, 24(7): 1676-1683.
DOI:https://dx.doi.org/10.1007/s11771-017-3574-xFoundation item: Project(51274192) supported by National Natural Science Foundation of China
Received date: 2015-11-03; Accepted date: 2016-05-01
Corresponding author: XIA Jun-wu, PhD; Tel: +86-516-83995179; E-mail: xiajunwu100@163.com, xjunw@163.com
Abstract: The characteristics of a disturbed soil-structure interface were studied based on the variation regularities of the disturbed soil within its mining subsidence area using direct shear tests. The effects of the initial moisture content on the shear strength parameters of the soil-structure interfaces were analyzed. The results indicate that the cohesion of the interface initially increased and then decreased as the initial moisture content increased. In addition, the friction angle of the interface decreased as the initial moisture content increased. A constitutive model of the disturbed soil-structure interface, a rigid-plastic model based on the initial void ratio and saturability (VSRP) model, was established based on the results. In order to validate this model, a finite element analysis of DRS-1 direct shear tests was conducted. The finite element model calculations coincided with the results of the DRS-1 direct shear tests. The proposed model also reflected the nonlinear features of the soil-structure interface.
