

Preparation and microwave absorption properties of FeNi/graphite nanocomposites
YANG Li(�� ��), HE Huan(�� ��), LIU Hong-bo(���鲨),
ZOU Yan-hong(����), CHEN Hui(�� ��), ZHOU Ru-quan(����ȫ)
College of Materials Science and Engineering, Hunan University, Changsha 410082, China
Received 15 July 2007; accepted 10 September 2007
Abstract:
FeNi/graphite nanocomposites were prepared by reducing FeCl3-NiCl2-GICs in H2. The elemental composition, structure, magnetic and microwave absorption of FeNi/graphite nanocomposites were investigated using X-ray diffraction, energy dispersive spectra, hysteresis loop and electromagnetic parameter analysis. The results show that with the increase of the reduced temperature, the number and size of particles of FeNi increases, and the FeNi /graphite nanocomposites changes to soft magnetism. FeNi /graphite nanocomposites bear microwave absorption properties. With the increase of the thickness of the sample, the matching frequency tends to shift to the low frequency region, and theoretical reflection loss becomes less at the matching frequency. Microwave absorption property in the low frequency region of FeNi/graphite nanocomposites prepared at 600 �� (FeNi/C600) is the best. When the thickness is 2 mm, the maximum theoretical reflection loss of FeNi/C600 is -4.3 dB and the matching frequency is 3.5 GHz.
Key words:
graphite intercalated compound; FeNi/graphite nanocomposite; microwave absorption;
1 Introduction
Microwave absorption nanocompounds have excellent microwave absorption properties. The nano metal powder with many outstanding properties such as high microwave magnetic conductivity, good thermal stability, wide frequency band, low density, has been used widely. Nano metal powder microwave absorption compounds mainly include carbonyl nano-powder composites and magnetic metal nano-powder composites. Magnetic metal nano-powder mainly includes Co, Ni, CoNi and FeNi and so on[1-4]. Nano powder is easily agglomerated, oxidated, and hard conserved[5-8]. The most important structure characteristic of graphite intercalated compounds (GICs) is the occurrence of separate graphite and intercalate layers due to the strong intraplanar binding and weak interplanar binding. Thus the graphite layers retain the basic properties of pristine graphite, and the intercalate layers behave similarity to the parent intercalate material[9-12]. The purpose of this study is to obtain FeNi/graphite nanocomposites by reducing FeCl3-NiCl2-GICs. The FeNi alloy nanoparticles are dispersed into graphite, which effectively avoids the nanoparticle agglomeration and oxidation[13-15].
In the present work, the FeNi/graphite nanoco- mposites were prepared by reducing FeCl3-NiCl2-GICs in H2. The influence of reduced temperature on the composition, structure, the hysteresis loops and electromagnetic parameters of FeNi/graphite nanocomposites were investigated systematically. The microwave absorption properties of FeNi/graphite nanocomposites at different reduced reaction temperatures were also discussed.
2 Experimental
The stage-1 FeCl3-NiCl2-GICs were prepared by molten salts method. FeNi/graphite nanocomposites were synthesized by reducing FeCl3-NiCl2-GICs in H2 at 350, 500 and 600 �� for 24 h, and the samples were named as FeNi/C350, FeNi/C500, and FeNi/C600, respectively.
FeNi/graphite nanocomposites at different reduced reaction temperatures were characterized by X-ray diffractometry (XRD, D5000) with Cu K�� radiation. The surface images were observed by scanning electron microscopy (SEM, JSM-6700F). The composition was determined by energy dispersive X-ray spectroscopy (EDS, Oxford Inca). The hysteresis loops of the specimens at room temperature were measured by means of vibrating sample magnetometer (VSM��Lake Shore 7300). The electromagnetic parameters and reflection losses were determined using a transmission/reflection network analyzer (Agilent 8720 ET).
3 Results and discussion
Fig.1 shows the X-ray diffraction patterns of FeNi/ graphite nanocomposites at different reduced temperatures. The XRD pattern of the original stage-1 FeCl3-NiCl2-GICs reveals weak reflection peak of (002) of graphite at 2�ȡ�26?. The XRD pattern of FeNi/C350 reveals that reflection peaks of (001), (002) and (003) of FeCl3-NiCl2-GICs are weakened obviously, and the peak intensity of (002) of graphite is enhanced relatively. Additionally, the low reflection peaks of FeCl2 and FeNi appear in the XRD pattern of FeNi/C350. The XRD patterns of FeNi/C500 and FeNi/C600 show that the peak intensities of FeCl2, FeNi, and graphite is enhanced further with the increase of reduced temperature, while the reflection peaks of FeCl3-NiCl2-GICs disappear gradually.
The elemental composition of FeNi/graphite nanocomposites prepared at different reduced temperatures is listed in Table 1. With the increase of temperature, the mole fraction of Cl of FeNi/graphite nanocomposites decreases from 62.80% to 28.11%. Meanwhile, the mole fraction of Fe and Ni increases gradually. These changes demonstrate that FeCl3 and
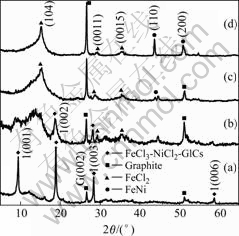
Fig.1 XRD patterns of FeNi/graphite nanocomposites at different reduced temperatures: (a) original stage-1 FeCl3- iCl2-GICs; (b) FeNi/C350; (c) FeNi/C500; (d) FeNi/ C600
NiCl2 can be reduced to FeNi and FeCl2 by H2, and the reduction increases with the increase of reduced temperature. However, the mole fraction of Cl is high even if the reduced temperature reaches 600 ��. The reason is that FeCl3 is mainly reduced to FeCl2, while it is very difficult for the FeCl2 between the graphite layers to further reduce to iron.
Table 1 Elemental compositions of FeNi/graphite nano- composites at different reduced temperatures
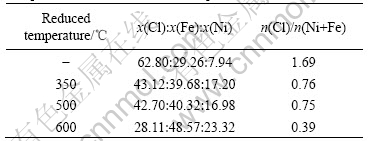
Fig.2 shows SEM backscattering images of FeNi/ graphite nanocomposites at different temperatures and the EDS pattern of the bright particles. It can be found from Fig.2 that there are many bright particles adhering to the surface and interlayer of graphite after are reduced at different temperatures. The size and number of the bright particles, of which the elemental composition is mainly Fe and Ni proved by EDS, increases with the increase of the temperature. These results agree with the XRD patterns.
The hysteresis loops of the stage-1 FeCl3-NiCl2- GICs and FeNi/graphite nanocomposites at different reduced temperatures are shown in Fig.3. The hysteresis loop of the original stage-1 GICs is a line, which indicates that it is diamagnetic. The hysteresis loops of FeNi/C500 and FeNi/C600 are like ��S��, and the area of the hysteresis loops is very small, which indicates that they are soft magnetic materials. The areas of these hysteresis loops of FeNi/graphite nanocomposites slightly increase with the increase of the temperature. The reason is that the magnetic phase of FeNi increases with the increase of the reduced temperature.
The relative permittivity ��r and the relative permeability ��r of FeNi/graphite nanocomposites at different temperatures were measured in the frequency range of 2-18 GHz. The dielectric loss angular tangent (tan ����) and the magnetic loss angular tangent (tan ����) were determined according to the measured value of ��r and ��r, respectively. The complex tan ���� and tan ���� versus frequency are shown in Fig.4. tan ���� of the stage-1 FeCl3- NiCl2-GICs are larger than tan ���� in the entire frequency range, which suggests that the stage-1 FeCl3-NiCl2-GICs is dielectric loss microwave absorption materials. tan ���� f FeNi/C500 is larger than tan ���� in the enlire frequency range, which suggests that FeNi/C500 is magnetic loss microwave absorption material. tan ���� of FeNi/C600 is larger than tan ���� in the frequency range of 2-5 GHz and 8.5-12.5 GHz, and less in the frequency range of 5.5-8.5 GHz and 12.5-18 GHz.
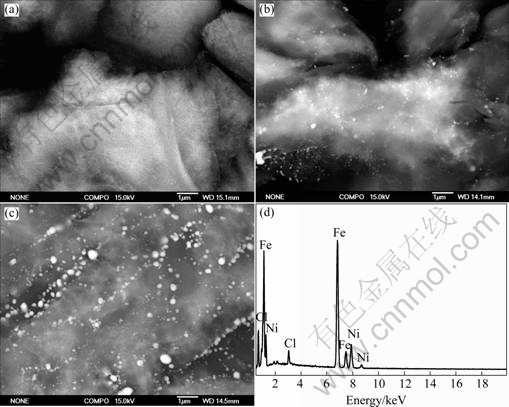
Fig.2 SEM backscattering images (a, b and c) of FeNi/graphite nanocomposites and EDS pattern of bright particles (d): (a) FeNi/C 350; (b) FeNi/C500; (c) FeNi/C600
Fig.3 Static magnetic hysteresis loops of FeNi/ graphite nanocomposites at different reduced reaction temperatures: (a) Original FeCl3-NiCl2- Cs; (b) FeNi/C500; (c) FeNi/C600
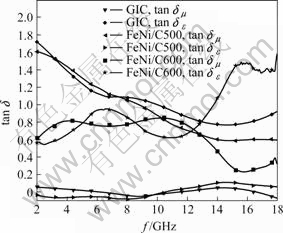
Fig.4 Changes of tan���� and tan���� of FeNi/graphite nano- composites at different reduced temperatures versus frequency
The theoretical reflection loss under certain thickness can be calculated according to the measured values of ��r and ��r. Fig.5 shows the complex theoretical reflection loss of FeCl3-NiCl2-GICs and FeNi/graphite nanocomposites versus frequency. With the increase of thickness of the stage-1 GICs and FeNi/C500, the matching frequency tends to shift to the low frequency region, and the theoretical reflection loss becomes less at the matching frequency. Contrasted to the stage-1 GICs, the maximum theoretical reflection loss of FeNi/C500 is improved. When the thickness is 1 mm, the maximum theoretical reflection loss of FeNi/C500 is -6.0 dB and the frequency region in which the maximum reflection loss is larger than -4.0 dB is 11-18 GHz. The maximum theoretical reflection loss of the stage-1 GICs is only -4.7 dB and the frequency region with the maximum refection loss larger than -4.0 dB is 11.8-16.9 GHz. Microwave absorption property of FeNi/C600 in the low frequency region is the best among the stage-1 FeCl3-NiCl2-GICs, FeNi/C500 and FeNi/C600. When the thickness is 1 mm, the maximum theoretical reflection loss of FeNi/C600 is -5.6 dB, however the frequency shifts to 10.3 GHz, and the frequency region in which the maximum reflection loss is more than -4.0 dB is 8.7-12.7 GHz. When the thickness is 2 mm, the frequency at which the reflection loss of FeNi/C600 is -4.3 dB shifts to 3.5 GHz. These results demonstrate that FeNi/graphite nanocomposite is a good candidate for microwave absorbent due to its low density, wide frequency region for microwave absorption and larger reflection loss.
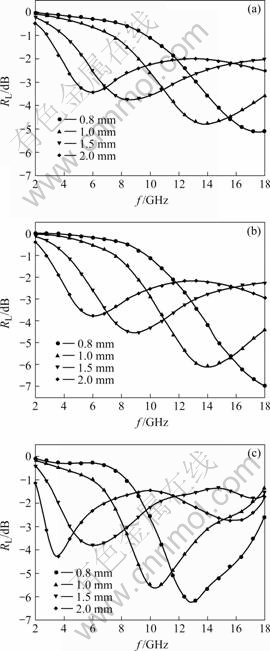
Fig.5 Theoretical reflection loss of FeNi/graphite nanocomposites at different reduced temperatures versus frequency: (a) Original FeCl3-NiCl2-GICs; (b) FeNi/C500; (c) FeNi/C600
4 ConclusionsFeNi/graphite nanocomposites can be prepared by reducing FeCl3-NiCl2-GICs under H2. The FeNi/graphite nanocomposites are composed of FeNi, FeCl2 and graphite. The number and size of the particles of FeNi increase with the increase of the reduced temperature. FeNi/graphite nanocomposites are soft magnetic materials. When the thickness is 1 mm, the microwave absorption property of FeNi/C500 is the best among the stage-1 FeCl3-NiCl2-GICs, FeNi/C500 and FeNi/C600. The maximum theoretical reflection loss of FeNi/C500 is -6.0 dB, and the frequency region in which the maximum reflection loss is larger than -4.0 dB is 11-18 GHz. The microwave absorption property of FeNi/C600 in the low frequency region is the best among them. When the thickness of the sample is 2 mm, the maximum theoretical reflection loss of FeNi/C600 is -4.3 dB and the matching frequency is 3.5 GHz.
References[1] ZHANG Xue-feng, LI Zhe-nan et al. Microwave absorption characteristics of ferromagnetic Fe, Co, Ni nanoparticles[J]. Powder Metallurgy Industry, 2006, 16(1): 11-16.(in Chinese)
[2] KIMA S S, KIMA S T, AHN J M, et al. Magnetic and micro-wave absorbing properties of Co-Fe thin films plated on hollow ceramic microspheres of low density[J]. J Magn Magn Mater, 2004, 271: 39-45.
[3] DUFFY D M, BLACKMAN J A, MULHERAN P A, et al. Transition metal clusters on graphite[J]. J Magn Magn Mater, 1998, 181: 953-954.
[4] XING Guo-li, SEIKI T K. Synthesis and magnetic properties of Fe-Co-Ni nanoparticles by hydrogen plasma metal reaction[J]. J Magn Magn Mater, 2000, 214(3): 195-203.
[5] DONG X L, ZHANG Z D, ZHAO X G. The preparation and characterization of ultrafine Fe-Ni particles[J]. J Mater Res, 1999, 14(2): 398-406.
[6] VLADIMIR B B. Advantages of ferromagnetic nanoparticle composites in microwave absorbers[J]. IEEE Trans Magn, 2004, 40(3): 1679-1684.
[7] DKER F B, RUP S M, LINDEROTH S. Surface effects in metallic iron nanoparticles[J]. Phys Rev Lett, 1994, 72(2): 282-285.
[8] RUOFF R, L ORENTS D C, CHAN B, et al. Single crystalmetals encapsulated in carbon nanoparticles[J]. Science, 1993, 259: 346-348.
[9] DRESSELHAUS M S, DRESSELHAUS G. Intercalation compounds of graphite[J]. Advances in Physics, 1981, 30(2): 139-326.
[10] ZOU Yan-hong, LIU Hong-bo, YANG Li, et al. The influence of temperature on magnetic and microwave absorption properties of Fe/graphite oxide nanocomposites[J]. J Magn Magn Mater, 2006, 302: 343-347.
[11] REN Hui, JIAO Qing-jie, SHEN Wan-ci, et al. Research on CuCl2-NiCl2-GIC interfering military infrared frequency[J]. Energetic Materials, 2005, 13(1): 45-49. (in Chinese)
[12] USHA N, SUBRAMANIAN V, MURTHY V R K. Microwave studies on some low stage graphite ferric chloride intercalation compound[J]. Materials Science and Engineering, 1997, B45: 85-87.
[13] CHUAN Xiu-yun. Magnetic properties of expanded graphite intercalation compounds of CuCl2-NiCl2[J]. Journal of Inorganic Materials, 2000, 15(6): 1077-1082. (in Chinese)
[14] LUO Jie, XU Guo-liang, JIANG Gang, et al. The preparation and property of the carbon cluster-like radar absorbing coating over broad band[J]. Chinese Journal of Atomic and Molecular Physics, 2002, 19(4): 531-533. (in Chinese)
[15] DUFFY D M, BLACKMAN J A, MULHERRAN P A, et al. Transition metal clusters on graphite[J]. J Magn Magn Mater, 1998, 181: 953-954.
(Edited by CHEN Can-hua)
Foundation item: Project(50372019) supported by the National Natural Science Foundation of China; project(GFPY-2006-003) supported by the Basic Scientific Research Cultivation Project, National Defence of Ministry of Education, China
Corresponding author: YANG Li; Tel: +86-13574836840; E-mail: hunanyangli@yahoo.com.cn
