

Raman spectroscopy and ionic structure of Na3AlF6-Al2O3 melts
HU Xian-wei, QU Jun-yue, GAO Bing-liang, SHI Zhong-ning, LIU Feng-guo, WANG Zhao-wen
School of Materials and Metallurgy, Northeastern University, Shenyang 110004, China
Received 19 January 2010; accepted 24 May 2010
Abstract:
Raman spectrum of molten cryolite was recorded. Based on the new understanding of the scattering coefficients, contents of various structural entities in acidic NaF-AlF3 melts at 942-1 024 ��C in previous research were reanalyzed. The new quantitative analysis results show that when cryolite ratio(CR) is less than 2, AlF4- is the dominant anion in the melts, and its mole fraction is about 0.70 for melts with CR=1.5 and 0.50 for melts with CR=2. When CR is more than 2.5, the mole fraction of AlF63- is relatively large, which is around 0.45 for melts with CR=2.5. Ionic structure of Na3AlF6-Al2O3 melts was investigated by UV-Raman spectroscopy. Octahedral AlF63- and tetrahedral AlF4- are proved to exist with possible partial replacement of F- by O2-. Al2O2F42- with a large scattering coefficient also exists in the melts in which alumina concentration is more than 4% (mass fraction). The increase of temperature causes blue-shift of the bands in the Raman spectra.
Key words:
Raman spectroscopy; Na3AlF6-Al2O3 melts; scattering coefficient; complex ion; aluminum electrolysis; sealed cell;
1 Introduction
In modern industry, cryolite-alumina-based melts are used as electrolyte in the production of aluminum and many kinds of aluminum-based master alloys. The researches on the ionic structure of cryolite-based melts have been widely carried out. Raman spectroscopy is an important technique. It was used first to research the structure of cryolite-based melts by SOLOMON et al[1], and the study was continued by RYTTER et al[2] and GILBERT et al[3-5]. Raman spectra were analyzed by AKDENIZ and MADDEN[6], and XIAO et al[7] through the computer simulation. Recently, VASSILIEV et al[8] and NAZMUTDINOV et al[9] have reported some new results of the spectroscopic and computational study of cryolite melts.
There are two kinds of suggested complex ions formed after alumina is added into molten cryolite. Those are Al-O and Al-F-O complexes. The former has not been accepted in the recent 30 years. Furthermore, forms of Al-F-O species are also different in melts with different concentrations of alumina according to previous researches[4-5]. Al2OFx4-x and Al2O2Fx2-x are the most recommended types.
In the previous Raman spectroscopy research on cryolite-based melts, visible exciting laser and a windowless cell were used. In recent years, UV exciting laser has been used on high temperature Raman spectroscopy research, and relatively high S/N ratio could be obtained because of the difference between the frequency ranges of the Raman scattering light and the blackbody emission of the furnace[10]. Furthermore, in order to reduce the effect from the inhomogeneous volatilization of the melts by using the opened cell, a closed cell was recommended[11].
The present work contains two parts. Firstly, spectrum of molten cryolite is recorded. Based on the new knowledge of the scattering coefficients, some corrections are made in the quantitative calculation of various species in acidic NaF-AlF3 melts which have been determined in our previous work[12]. Secondly, UV Raman spectra of cryolite-alumina melts are recorded using a sealed sample cell. So information on the structure is obtained through analysis.
2 Experimental
All the chemicals were dried at 300 ��C for 24 h to remove attached water before use. 15 g mixture, with needed composition, was premelted in a platinum crucible for well mixing. About 0.1 g of the cooled sample was taken for recording Raman spectra.
A Kimmon Koha He-Cd UV laser (18 mW, 325.0 nm) and an Olympus UV microscope objective (10?0.25) were used. Raman spectra were recorded 2 times by a Horiba Jobin Yvon Labram HR 800 Raman spectrometer by accumulating for 15 s. The relatively short accumulating time was used for reducing influence of inhomogeneous volatilization of the melts.
As referred above, a sealed sample cell was used, as shown in Fig.1. A platinum crucible(d5 mm��6 mm) placed in a corundum tube was used as molten sample holder. The corundum tube had an external thread for platinum wire wounded around. A quartz lid with a circular groove was tightly coupled with the platinum crucible. Because of the inhomogeneous volatilization of the melts, the cell was sealed with the high-temperature cement. A Guolong TCW-32B temperature controller connected to a Pt-PtRh10 type thermocouple was used to control the temperature.
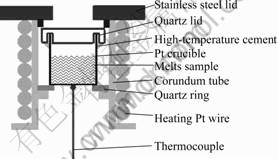
Fig.1 Schematic view of sample cell for recording Raman spectrum
3 Results and discussion
3.1 Quantitative analysis of ionic structure of acidic NaF-AlF3 melts
Raman spectra of acidic NaF-AlF3 melts have been recorded in our previous paper[12], and tetrahedral AlF4- and octahedral AlF63- have been proved to co-exist in the melts with cryolite ratio more than 1. In our quantitative calculation, the scattering coefficient ratios of AlF63- and AlF4- were taken as 2.1, which was taken from GILBERT��s work[13]. In fact, it is difficult to calculate the scattering coefficient ratio only from the structures of various ion species, just as SOLOMON et al[1] have done. In GILBERT��s work[13], the scattering coefficient ratio was calculated under the hypothesis that dissociation constants of reaction AlF63- = AlF4- + 2F- for two different compositions of NaF-AlF3 melts were the same. Unlike the aqueous solution, it cannot introduce a standard substance into the melts for the quantitative calculation of other complex ions. So an external reference method cannot be used. In the quantitative analysis of the melts referred above, except for the information given by the Raman spectra, some preconditions are also needed. For example, the dissociation constants of the same reaction for two different compositions were thought to be the same. Therefore, in the present study, the value of the decomposition rate of AlF63- to AlF4- is thought to be 0.3 in molten cryolite, and it has been confirmed by many other researchers[14]. According to our previous study[12], the influence of temperature on the decomposition rate of AlF63- to AlF4- was small. Therefore, the difference between temperature of the present study and the previous one can be ignored.
Raman spectrum of molten cryolite at 1 015 ��C is shown in Fig.2. It can be seen from Fig.2 that there are a band located at 555 cm-1 and a shoulder peak at 622 cm-1. The two bands are caused by the symmetric stretching vibrations of AlF63- and AlF4-, respectively[12].
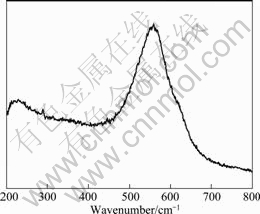
Fig.2 Raman spectrum of molten cryolite at 1 015 ��
The Raman peak can be fitted by a weighted summation of Gauss and Lorentz equations after baseline subtraction[15]. The flattening of the spectrum is not recommended for unnecessary error. In fact, the parameters in the fitted equations corresponding to various Raman peaks can be obtained by using the ��peak searching and fitting�� option in Labspec software. By the analysis method described above, the value of the intensity ratio of the bands corresponding to AlF63- and AlF4- in Fig.2 is calculated to be 10.04. In the present study, the decomposition rate of AlF63- to AlF4- of 0.3 in molten cryolite is used, and then the scattering coefficient ratio of AlF63- to AlF4- can be calculated according to the relationship described by
I = kx (1)
where I is the intensity ratio of bands corresponding to AlF63- and AlF4-; k is the scattering coefficient ratio of AlF63- and AlF4-; and x is the mole ratio of AlF63- and AlF4-. The value of x is calculated to be 2.33 through Eq.(1). Then the value of k is computed to be 4.31.
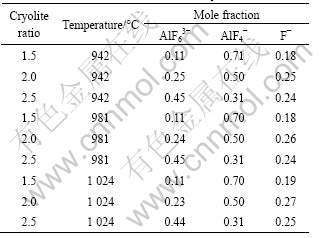
Using the intensity ratio of bands corresponding to AlF63- and AlF4- in the Raman spectra for various compositions of the melts and the analysis method in our previous paper[12], the mole fractions of the anions in the melts with various cryolite ratios can be calculated. The results are listed in Table 1.
Table 1 Anionic mole fractions in NaF-AlF3 melts
3.2 Raman spectrum analysis of Na3AlF6-Al2O3 melts
Raman spectra of Na3AlF6-Al2O3 melts are shown in Fig 3.
In the Raman spectra shown in Fig.3, there are bands corresponding to AlF63- and AlF4- though the AlF4- band is unclear in some spectra because of their lower quality, indicating that the two kinds of complexes or the similar octahedron and tetrahedron also exist in the alumina-containing melts. The possible species may be the products of AlF63- and AlF4- in which the F atom is partly replaced by one or more O atoms in alumina. Furthermore, the two bands both show red-shift by 10-20 cm-1 after alumina addition, which seems to confirm that the atom replacement happens. Another probable interpretation for the red-shift is that the frame of the Al-F complex becomes relatively unstable, which can be attributed to the weaker Al��F bond in the presence of O atoms.
An apparent difference between the spectra in Figs.2 and 3 is that in Fig.3, there is a new band appearing at about 500 cm-1. The Raman shift of the new band is nearly identical with the wavenumber assigned to Al2O2F42- by ROBERT et al[5]. This species has been proved to exist in molten cryolite with middle and high concentration of alumina. Like the characteristic peaks of
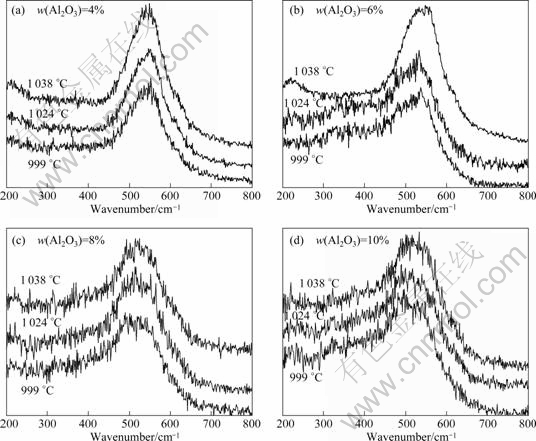
Fig.3 Raman spectra of Na3AlF6-Al2O3 melts
the Al-F complex species, red-shift also occurs for the band of this Al-O-F entity with increase of alumina concentration.
Through observing the changes of bands with temperature changing, one can find that most of the bands referred above have blue-shift, showing a different changing trend for the characteristic bands of complex in acidic NaF-AlF3 melts[12]. The exception is the bands in Fig.3(a). In fact, if in the view of symmetry, it is difficult to make sure that the band corresponding Al2O2F42- exists in the spectra of Fig.3(a). Therefore, it is believed that there might be other O2--containing species in the corresponding melts. This conclusion is consistent with other researchers[4-5]. However, there seems to be no new band appearing in the spectra of Fig.3(a). This is attributed to the relatively poor profile of the spectra and the low scattering coefficient of the complex ions.
It is well known that the relative intensities of different bands are related to the relative contents of the corresponding complex ions. Though it is difficult to find detailed information about the concentrations of various anion groups because of the lack of scattering coefficient and the low quality of the spectra, one can still make some conclusions visually. It is obvious that the intensity ratio of bands corresponding to AlF63- and Al2O2F42- is increased as the concentration of alumina increases. This indicates that the relative content of Al2O2F42- is higher for higher alumina concentration. In fact, compared with the Al-F complex, the concentration of the oxygen-containing complex cannot be high because the researched concentration of alumina is not very high. However, in the spectra of Figs.3(b), (c) and (d), the intensity of the bands corresponding to Al2O2F42- is at the same level as AlF63- because of the large scattering coefficient of Al2O2F42-.
4 Conclusions
1) The scattering coefficient ratio of AlF63- and AlF4- is 4.31 based on the value of decomposition rate of AlF63- to AlF4- of 0.3 in molten cryolite. For the acidic NaF-AlF3 melts with CR less than 2, AlF4- is the dominant anion; for the melts with CR more than 2.5, AlF63- is the most among the anions. Concentration of F- is relatively low in the researched range of CR.
2) Octahedral and tetrahedral structures like AlF63- and AlF4- also exist in the cryolite-alumina melts. There may be partial replacement of F- by O2- in these two kinds of structures. Al2O2F42- exists in the melts in which alumina concentration is more than 4%. This kind of entity has a large scattering coefficient.
3) The bands in Raman spectra of cryolite-alumina melts have blue-shift when temperature increases.
References
[1] SOLOMON C, CLARKE J H, BOCKBIS J O. Identification of complex ions in liquid cryolite [J]. The Journal of Chemical Physics, 1968, 49(1): 445-449.
[2] RYTTER E, RATKJE S K. Raman spectra of molten mixtures containing aluminium fluoride. ��. Dissociation of AlF63- [J]. Acta Chemia Scandinavica A, 1975, 29(5): 565-566.
[3] GILBERT B, MAMANTOV G. Raman spectrum of AlF4- ion in molten fluorides [J]. Inorganic & Nuclear Chemistry Letters, 1974, 10(12): 1123-1129.
[4] GILBERT B, ROBERT E, TIXHON E, OLSEN J E, OSTVOLD T. Acid-base properties of cryolite based melts with, CaF2, MgF2 and Al2O3 additions. A comparison between Raman and vapour pressure measurements [C]//Light Metals 1995. Las Vegas: Minerals, Metals & Materials Society, 1995: 181-194.
[5] ROBERT E, OLSEN J E, DANEK V, TIXHON T, OSTVOLD T, GILBERT B. Structure and thermodynamics of alkali fluoride-alumina melts: Vapor pressure, solubility and Raman spectroscopic studies [J]. The Journal of Physical Chemistry B, 1997, 101(46): 9447-9457.
[6] AKDENIZ Z, MADDEN P A. Raman spectra of ionic liquids: A simulation study of AlF3 and its mixtures with NaF [J]. The Journal of Physical Chemistry B, 2006, 110(13): 6683-6691.
[7] XIAO Li, YOU Jing-lin, JIANG Guo-chang. Characteristic Raman spectra of micro environment of fluoroaluminate structural units [J]. The Chinese Journal of Nonferrous Metals, 2008, 18(6): 1164-1170. (in Chinese)
[8] VASSILIEV S, LAURINAVICHUTE V, KUZMINOVA Z, TSIRLINA G, ANTIPOV E, GUSEV A, SIMAKOV D. In situ Raman experimental study of ionic species in cryolite melts of various composition[C]//Light Metals 2010. Seattle: Minerals, Metals & Materials Society, 2010: 559-561.
[9] NAZMUTDINOV R R, ZINKICHEVA T T, VASSILIEV S Y, GLUKHOV D V, TSIRLINA G A, PROBST M. A spectroscopic and computational study of Al(III) complexes in sodium cryolite melts: Ionic composition in a wide range of cryolite ratios [J]. Spectrochimica Acta Part A: Molecular and Biomolecular Spectroscopy, 2010, 75(4): 1244-1252.
[10] CHEN Hui, JIANG Guo-chang, YOU Jing-lin, WU Yong-quan. High temperature Raman spectroscopy techniques and its application [J]. Spectroscopy and Spectral Analysis, 2007, 27(12): 2464-2467. (in Chinese)
[11] HU Xian-wei, WANG Zhao-wen, GAO Bing-liang, SHI Zhong-ning, YU Ya-xin. A sealed sample cell and using method for Raman spectra measurements of high-temperature volatile melts: CN 101629899A [P]. 2010-01-20. (in Chinese)
[12] HU Xian-wei, WANG Zhao-wen, CHEN Guang-hua, LU Gui-min, CUI Jian-zhong, CAO Xiao-zhou. Raman spectra of ionic structure for acidic NaF-AlF3 melts [J]. The Chinese Journal of Nonferrous Metals, 2008, 18(10): 1914-1919. (in Chinese)
[13] GILBERT B, MAMANTOV G. Raman spectra of aluminum fluoride containing melts and the ionic equilibrium in molten cryolite type mixtures [J]. The Journal of Chemical Physics, 1975, 3(2): 950-955.
[14] QIU Zhu-xian. Principle and application of aluminium electrolysis [M]. Xuzhou: China University of Mining and Technology Press, 1998: 194-196. (in Chinese)
[15] GILBERT B, MATERNE T. Reinvestigation of molten fluoroaluminate Raman spectra: The question of existence of AlF52- ions [J]. Applied Spectroscopy, 1990, 44(2): 299-305.
Na3AlF6-Al2O3���ε�Raman�������ӽṹ
����ΰ, ������, �߱���, ʯ����, �����, ������
������ѧ ������ұ��ѧԺ������ 110004
ժ Ҫ�����ڲⶨ�����ڱ���ʯ��Raman���Ͷ�ɢ��ϵ���������⣬���·�����ǰ�о���942~1 024 ��C������NaF-AlF3�����д��ڵIJ�ͬ�����ŵĺ������µĶ�������������������ڷ��ӱ�С��2�����Σ�AlF4-�Ǻ�����ߵ������ӣ������ӱ�Ϊ1.5ʱ����Ħ������ԼΪ0.70�������ӱ�Ϊ2ʱ����Ħ������Ϊ0.50�������ӱȴ���2.5ʱ��AlF63-��Ժ������ߣ������ӱ�Ϊ2.5ʱ����Ħ������Ϊ0.45��Ȼ��������Raman�����о�Na3AlF6-Al2O3���ε����ӽṹ���о���������������д��ڰ������AlF63-���������AlF4-�������е�F-���ܱ�O2-����ȡ������Al2O3��������������4%�������д��ھ��д�ɢ��ϵ����Al2O2F42-�������еIJ������¶ȵ����߷������ơ�
�ؼ��ʣ� Raman���ף�Na3AlF6-Al2O3���Σ�ɢ��ϵ������������ţ�����⣻�����Ʒ��
(Edited by YANG Hua)
Foundation item: Project (51004034) supported by the National Natural Science, China; Project(N090302009) supported by the Fundamental Research Funds for the Central Universities, China
Corresponding author: HU Xian-wei; Tel: +86-24-83686464; E-mail: huxw@smm.neu.edu.cn
DOI: 10.1016/S1003-6326(11)60728-0
