
Trans. Nonferrous Met. Soc. China 24(2014) 484-490
Simulated and experimental investigation of stretch sheet forming of commercial AA1200 aluminum alloy
Reza ESMAEILIZADEH1, Kourosh KHALILI1, Bagher MOHAMMADSADEGHI 2, Hossein ARABI3
1. Department of Materials Science and Engineering, Sharif University of Technology, Tehran, Iran;
2. School of Metallurgy and Materials Engineering, Iran University of Science and Technology, Narmak, Tehran, Iran;
3. Center of Excellence for High Strength Alloy Technology, School of Metallurgy and Materials Engineering, Iran University of Science and Technology, Narmak, Tehran, Iran
Received 18 June 2013; accepted 24 September 2013
Abstract:
The simulation and experimental results obtained from stretching test of a commercial sheet of AA1200 aluminum alloy were compared and evaluated. Uniaxial tensile tests were carried out to obtain the required input parameters for simulation. Finite element analysis of the forming process was carried out using Abaqus/Explicit by considering von Mises and Hill-1948 yield criteria. Simulation results including punch force and strain distribution were compared and validated with the experimental results. The results reveal that using anisotropic yield criteria for simulation has a better match in both cases with the experiments.
Key words:
AA1200 aluminum alloy; sheet forming; stretch forming; numerical simulation; yield criteria;
1 Introduction
Nowadays, cold-rolled sheets have been utilized in various industries. However, due to the development of the microstructural complexities such as the formation of different textures during their rolling and the subsequence induction of anisotropic properties, one should take enough care in their applications for any specific use [1]. Materials anisotropy plays an important role in the subsequent sheet forming processes. The main cause of anisotropy in metals is due to preferential orientation of grains which forms during rolling, i.e., statistical orientation of grains in any specific cross section with a special crystallographic directions [2].
It is worth mentioning that recrystallization during annealing usually changes the crystallographic texture, but does not randomize it. However, during mechanical working, since plastic deformation often occurs in certain crystal planes, thus these planes are bended and rotated, a well-known orientated texture called deformation texture is created. The type of this texture therefore depends on the deformation mode and the forming temperature [3,4].
Stretching is common in stamping. This property which can be evaluated by Erichsen or Olsen test plays an important role in sheet metal forming. For example, AKROUT et al [5] used the experimental and numerical simulation results of Erichsen test to study the stretchabilities of aluminum, steel and copper sheets. TAJALLI and EMADODDIN [6] used tensile and Erichsen tests to study the plasticity parameters of aluminum 7075 and the anisotropic properties of this alloy. Several other studies [7-10] were carried out on the variation of plastic strain ratios during straining, using two extensometers or digital imaging for measuring length and width change during tensile test and some mathematical relations proposed for compensation of elastic strain in online measurements of strain.
In this study, several uniaxial tensile tests were carried out on samples at different angles, relative to the rolling direction (RD), to determine the mechanical properties required for simulation. After stretch forming tests, the amounts of punch forces used were plotted versus displacements to validate the computer simulation results of this test. Stretch forming test was simulated by the mechanical properties obtained from uniaxial tensile tests and also von Mises and Hill-48 yield criteria for isotropic and anisotropic materials, respectively, in Abaqus finite element software.
2 Experimental and numerical methods
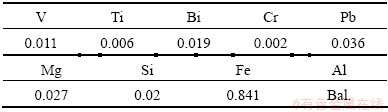
As received Al alloy sheet (AA1200) was fully annealed at 350 ��C for 10 min for recrystallization to occur and improving its ductility. The mean chemical composition of the fully annealed sheet is listed in Table 1.
Table 1 Mean chemical composition of AA1200 alloy (mass fraction, %)
Then, the samples were cut in different directions relative to rolling direction (RD), i.e., 0�� (RD), 45�� and 90�� (TD).
Dimensions of the tensile test specimens were selected in accordance with the standard ASTM E8 multiplied by a factor of 3.2 because of the width requirement for theextensometers.
Five square blanks (specimens) with the dimensions of 100 mm��100 mm��2 mm were cut from the annealed material for stretch forming test. To measure the surface strains of the specimens, circular-shaped grids with 2.5 mm diameter were inscribed on them by the electro-etched method. The specimens were then subjected to stretching tests with punch speed of 40 mm/min. Then variations of punch force versus punch displacement were plotted for 25 locations of the punch.
The tensile test was conducted using two extensometers installed on the sample��s width and length. In addition to the ordinary tensile properties data such as yield strength (YS) and ultimate tensile stress (UTS), the plastic strain ratio (R-value) was calculated during straining.
The properties and their units used for material in Abaqus software are as follows: Length in mm, stress in MPa, and density in kg/m3. To enter the mechanical properties of the material, a density of 2.7��103 kg/m3 was entered in general section, then the elastic properties of the aluminum were entered in mechanical section. The output results were consistent with the experimental test data.
The classical model of Johnson-Cook was used as one of the two ways of defining the sheet plastic behavior. To study the von Mises yield criterion, tensile test data were entered in tabular form at first and then by selecting the potential in suboptions. All coefficients were put equal to one. However, in the case of Hill yield criterion, the coefficients were calculated using the set of equations as follows [11,12]:
 (1)
(1)
 (2)
(2)
 (3)
(3)
 (4)
(4)
where F, G and H are Hill constants; R0, R45 and R90 are the plastic strain ratios in the directions of tensile test specimens.
The boundary conditions (BC) were as follows: punch displacement of 20 mm was defined in the upward direction to apply the load on the sheet. In the mold, blank holder, sheet and punch were set similar to those of the real conditions of the test. For calculating the strain, an initial mesh size of 2 mm in the mesh module was used. The optimization of mesh size was performed based on two factors of accurate results and minimal computation time.
3 Results and discussion
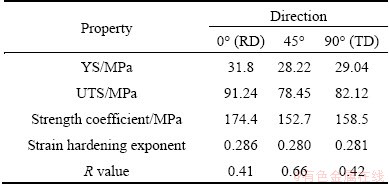
The average flow curve data obtained from nine tensile tests for three different directions relative to the RD are listed in Table 2. It shows the results of yield stress and strain, stress and strain at the point of instability, constants of power law equation of plastic zone and plastic strain ratio (R value). R values are calculated by the equation with the assumption of incompressibility as follows:
 (2)
(2)
where ��l, ��w and ��t are strains in length, width and thickness of the tensile specimens, respectively.
Table 2 Average results of tensile tests
Figures 1 and 2 show the true stress��true strain curves and engineering stress��engineering strain curves, respectively. The material��s tensile data obtained from Figs. 1 and 2 were used later in Abaqus software for simulation.
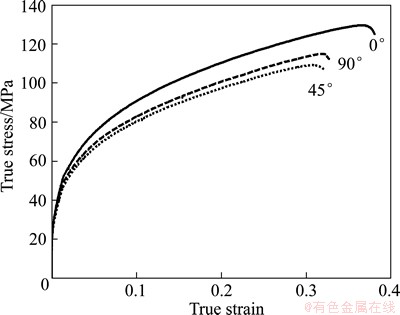
Fig. 1 Variation of true stress vs true strain
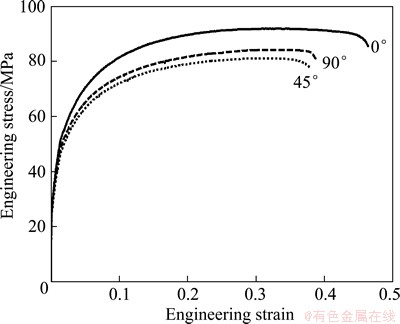
Fig. 2 Variation of engineering stress vs engineering strain
Plastic strain ratios (R values) were calculated by measuring strain in both longitudinal and width directions obtained from the extensometers during the test. Figure 3 shows the changes of width (transverse) strains vs longitudinal strains in tensile specimens in three directions. It indicates that the curves related to the tensile samples in rolling direction (RD) and transverse direction (TD) have a good coincidence with each other up to 0.25 longitudinal strains.
However, the linear relationship between the longitudinal and width strains, which is an interpretation of incompressibility, disappears when the longitudinal strains are larger than 0.25. This phenomenon could be due to the neck formation in the sample and the concentration of strain in the necked region. This leads to errors in measurements of strains by the extensometers. The variation of plastic strain ratio with longitudinal strain is plotted in Fig. 4.
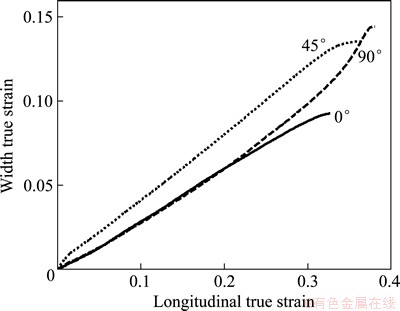
Fig. 3 Variation of transversal strain vs longitudinal strain
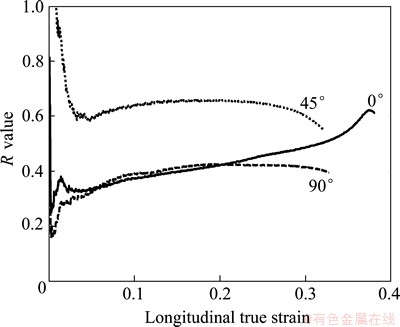
Fig. 4 Variation of plastic strain ratio vs longitudinal strain
It shows that the plastic strain ratio roughly remains unchanged in the three directions in the strain range of 0.05 to 0.25, but it changes after further straining of the material. The path on which each of the extensometer follows after passing through uniform plastic deformation depends on the relative distance between the necked region and the width of the extensometer. So, the R value curve (Fig. 4) can be ascending or descending. It shows that the R value in 45�� direction is higher than those in other directions. This confirms the amounts of strains in different directions vary during deformation. The necked region in RD specimen occurs near the middle of the gage length where the extensometer is located, but in the TD and 45�� specimens necking occurs near the shoulders of tensile specimen far away from the extensometers locations, as shown in Fig. 5. Therefore, the strains obtained for these specimens are not used for the calculation due to necking and localization of strain. The longitudinal plastic strain of 0.2 is used for anisotropic yield criterion, calibration and simulations similar to Refs. [1,7,13].
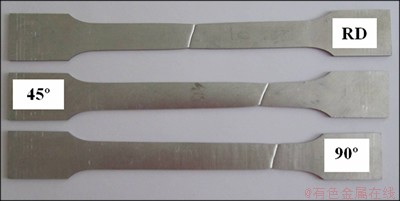
Fig. 5 Locations of necked regions in various samples
The calculated R values of this alloy for the three directions are in the range of 0.4-0.6. R value less than one is an indication that this alloy has very low resistance against thinning, therefore, it is not suitable for a deep drawing process [14-16]. The previous researches [2,3] showed that considerable texture evolution develops in pure cold rolled aluminum, mainly copper type  and brass type
  ; while after their annealing, a very strong cube texture (001)[100] can develop in this type of materials.
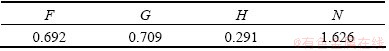
Constants F, G, H and N in Hill-1948 yield criterion, used for simulation of the anisotropic behavior of sheets, were calculated by putting the values of parameters R0, R45 and R90 at 0.2 longitudinal strains into Eqs. (1-4). Table 3 shows the values of these constants.
Table 3 Calculated constants of Hill yield criterion
Mean variations of the applied punch force vs punch displacement of stretch forming tests are shown in Fig. 6.
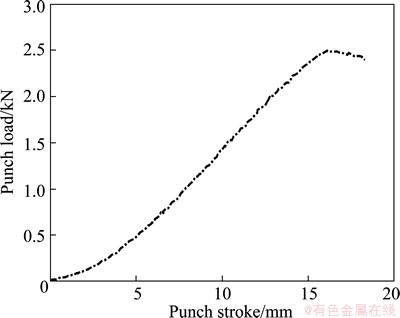
Fig. 6 Experimental stretch forming for AA1200 Al alloy sheet
Figure 6 shows that the effect of hardening is more than the reduction in cross section and it has an increasing slope up to about 15 mm of punch travel. After this, the process reverses, the cross section decreases faster than the speed of hardening, and the slope is decreasing.
A typical image of a stretch formed sample presented in Fig. 7 shows the highest stress during the test performance occurred in a ring with a constant diameter in the center of the sheet. This ring is located in a section of full contact of sheet with the punch. The location of crack shows the maximum strain and stress in this figure. One should note that during the test the maximum strain occurred in the vicinity of the punch head where the tangential contact prevents deformation and causes strain localization.
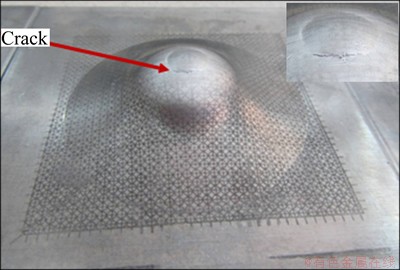
Fig. 7 Stretch formed specimen
For simulating the results by finite element technique, three different methods of defining the plastic behavior of the material are used in this research as follows.
Johnson-Cook model
Plastic behavior was modeled on the base of von Mises yield criterion and Johnson-Cook hardening model. Johnson-Cook model is actually a generalized form of Holloman model which is used for creep and temperature-dependent conditions. In fact, the constants of the Holloman model in this study were used in association with von Mises yield criterion and Johnson-Cook model, which is called as JC-Holloman model. The result is shown in Fig. 8.
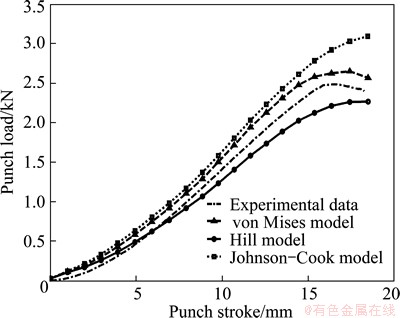
Fig. 8 Comparison of experimental and simulation curves
von Mises model
The results of tensile test, i.e. true stress and true plastic strain, were used directly in association with von Mises yield criterion to model the material flow behavior. The original data were put in Abaqus software and the results are also shown in Fig. 8. Hill model Tensile test data and Hill-1948 criterion which was considered as a yield criterion, were used to determine the hardening behavior of the material, as shown in Fig. 8.
Figure 8 shows the variation of simulated force versus the punch displacement obtained for plastic behavior of the material in accordance with different yield criterions and the actual test data. The curves related to Johnson-Cook and von Mises models predict higher values of punch forces than the experimental values for the same amount of displacement; while the forces predicted in the Hill model are lower than the experimental forces particularly for a punch movement more than 7 mm. The difference is due to the effect of R values used in different models, on which for the Hill criterion these values are less than unity.
The effect of biaxial strength used in stretch forming tests on plastic behavior is the most important factor in these tests. The value of this parameter obtained from Hill criterion is dependent on plastic strain ratio. In the case of aluminum alloys with R values less than unity the predicted value of strength by Hill criterion is less than the uniaxial yield strength predicted by von Mises criterion and the real value of the strength. So it��s not surprising that the flow curve predicted by Hill model lies under those of other models and the experimental data. However, the slight difference between von Mises model and the experimental results is due to the anisotropic plastic behavior of the sheet and the lack of accuracy in isotropic yield criterion. It should be noted that the accuracy of input parameters such as friction coefficient (i.e., 0.1 in this research) and parameters of anisotropy yield criteria given in Table 3, can have a significant effect on the accuracy of the simulation results. On the other hand, the difference between the results of Hill and Johnson-Cook criteria with the experimental results shows that these two criteria are not very accurate technique to describe the flow behavior of the material under test particularly for punch movement more than 15 mm.
The results of Johnson-Cook and von Mises models for up to 15 mm punch movement are very close to each other because von Mises yield criterion is used in both models. It should be noted that in this study anisotropic hardening is neglected, and all hardening properties are considered in rolling direction because of its higher values.
Figure 9 shows the equivalent stress distribution obtained from simulating stretch forming test by von Mises and Hill criteria. The location of the maximum amount of tension over the surface of the stretched sheet is shown in red color. The crack locations observed practically (Fig. 7) were within or very close to the red area. When Hill model was used for simulation, the prediction for the location of crack formation was much closer to the experimentally observed crack location than that when the von Mises model was used. However, this result indicates that although Hill criterion under- estimates the strength value particularly for a punch movement more than 7 mm, but it can be considered as an acceptable criterion for stress distribution prediction.
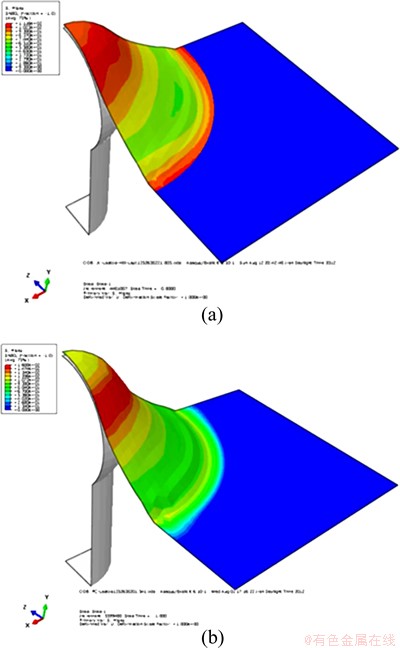
Fig. 9 Equivalent stress distribution for Hill (a) and von Mises (b) criteria
The measured and calculated strains via Hill and von Mises criteria for three points of the sheet surface shown in Fig. 10 are listed in Table 4.
The minor and major strains were measured according to Fig. 11, i.e., changes in initial circle diameter which is 2.5 mm in this study.
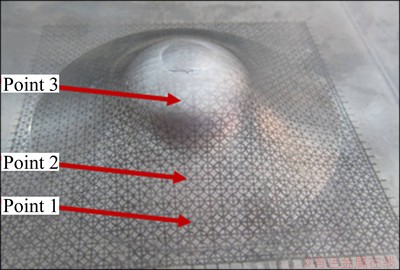
Fig. 10 A typical stretch formed specimen and selected points for strain measurement
Table 4 Measured strains and calculated strains via two different criteria
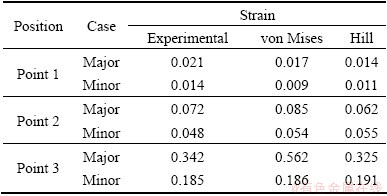
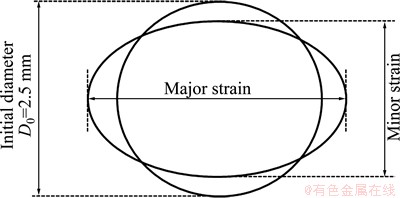
Fig. 11 Minor and major strains
Due to the small amounts of strain at the points 1 and 2, the possibility of errors may occur during experimental measurement, the measured strains at this point were not used for the purpose of comparison. However, the experimental results in point 3, which has a considerable amount of strain, are suitable for validation of different methods. The minimum strain calculated from the von Mises and Hill criteria is not different from the measured strain, but the maximum strain calculated from Hill criterion (i.e. 0.325) in comparison with that estimated from the von Mises criterion (i.e. 0.562) is much closer to the actual measured strain (i.e. 0.342). This issue shows a better match between the experimental results of strain and those predicted by Hill criterion.
4 Conclusions
1) Annealing operations and recrystallization process do not eliminate the anisotropic plastic behavior of the rolled sheet, so that a particular texture can be developed. However, the nature of this texture is not established in this research.
2) The force��displacement curves of stretch forming test calculated using two methods (von Mises and Johnson-Cook models) are in good agreement with each other. While the calculated curve with the Hill criterion shows lower value than that with the other two models.
3) The use of isotropic yield criterion for anisotropic materials, such as sheet used in this study, has no good results in finite element simulation.
References
[1]  V. Variation of normal anisotropy ratio ��r�� during plastic forming [J]. Journal of Mechanical Engineering, 2009, 55(6): 392-399.
[2] ENGLER O, RANDLE V. Introduction to texture analysis: macrotexture, microtexture, and orientation mapping [M]. 2nd ed. CRC Press, 2010.
[3] TOTTEN G E, MACKENZIE D S. Handbook of Aluminum: Physical metallurgy and processes [M]. Vol. 1 Boca Ration: CRC Press, 2003.
[4] WANG X Y, HU H E, XIAJ C. Effect of deformation condition on plastic anisotropy of as-rolled 7050 aluminum alloy plate [J]. Materials Science and Engineering A, 2009, 515(1): 1-9.
[5] AKROUT M, AMAR M B, CHAKER C, DAMMAK F. Numerical and experimental study of the Erichsen test for metal stamping [J]. Advances in Production Engineering & Management, 2008, 3(2): 81-92.
[6] TAJALLY M, EMADODDIN E. Mechanical and anisotropic behaviors of 7075 aluminum alloy sheets [J]. Materials & Design, 2011, 32(3): 1594-1599.
[7] DANCKERT J, NIELSEN K B. Determination of the plastic anisotropy r in sheet metal using automatic tensile test equipment [J]. Journal of Materials Processing Technology, 1998, 73(1): 276-280.
[8] CHAMANFAR A, MAHMUDI R. Compensation of elastic strains in the determination of plastic strain ratio (R) in sheet metals [J]. Materials Science and Engineering A, 2005, 397(1): 153-156.
[9] HUH J, KIM Y J, HUH H. Measurement of R-values at intermediate strain rates using a digital speckle extensometry [J]. Dynamic Behavior of Materials, 2011, 1: 317-322.
[10] CHAMANFAR A, MAHMUDI R. Effect of specimen geometry, gage length, and width measurement locations on plastic strain ratio (R-value) in sheet metals [J]. Metallurgical and Materials Transactions A, 2006, 37(12): 3477-3487.
[11] RAGAI I, LAZIM D, NEMES J A. Anisotropy and springback in draw-bending of stainless steel 410: Experimental and numerical study [J]. Journal of Materials Processing Technology, 2005, 166(1): 116-127.
[12] GENG L, WAGONER R H. Role of plastic anisotropy and its evolution on springback [J]. International Journal of Mechanical Sciences, 2002, 44(1): 123-148.
[13] LADEMO O G, HOPPERSTAD O S, LANGSETH M. An evaluation of yield criteria and flow rules for aluminium alloys [J]. International Journal of Plasticity, 1999, 15(2): 191-208.
[14] SUZUKI K. The relationship between the deep-drawability and the r-values of sheet metals [J]. Journal of Mechanical Working Technology, 1987, 15(2): 131-142.
[15] YI S, BOHLEN J, HEINEMANN F, LETZIG D. Mechanical anisotropy and deep drawing behaviour of AZ31 and ZE10 magnesium alloy sheets [J]. Acta Materialia, 2010, 58(2): 592-605.
[16] CADA R. Comparison of formability of steel strips, which are used for deep drawing of stampings [J]. Journal of Materials Processing Technology, 1996, 60(1): 283-290.
��ҵAA1200���Ͻ𱡰��������ģ���ʵ���о�
Reza ESMAEILIZADEH1, Kourosh KHALILI1, Bagher Mohammad SADEGHI 2, Hossein ARABI3
1. Department of Materials Science and Engineering, Sharif University of Technology, Tehran, Iran;
2. School of Metallurgy and Materials Engineering, Iran University of Science and Technology, Narmak, Tehran, Iran;
3. Center of Excellence for High Strength Alloy Technology, School of Metallurgy and Materials Engineering, Iran University of Science and Technology, Narmak, Tehran, Iran
ժ Ҫ���Թ�ҵAA1200���Ͻ𱡰�������ε�ģ���ʵ�������бȽϺ����������õ�����������õ�ģ�������������������von Mises ��Hill-1948��������Abaqus/Explicit����Ԫ�����������ι��̡�����ѹ����Ӧ��ֲ���ģ������ʵ�������бȽϺ���֤�����������������������£�ʹ�ø�������������ģ��Ľ����ʵ�������Ǻϡ�
�ؼ��ʣ�AA1200���Ͻ𣻰��ϳ��Σ�������Σ���ֵģ�⣻������
(Edited by Chao WANG)
Corresponding author: Reza ESMAEILIZADEH; E-mail: reza_esmaeilizadeh@mehr.sharif.ir
DOI: 10.1016/S1003-6326(14)63086-7
Abstract: The simulation and experimental results obtained from stretching test of a commercial sheet of AA1200 aluminum alloy were compared and evaluated. Uniaxial tensile tests were carried out to obtain the required input parameters for simulation. Finite element analysis of the forming process was carried out using Abaqus/Explicit by considering von Mises and Hill-1948 yield criteria. Simulation results including punch force and strain distribution were compared and validated with the experimental results. The results reveal that using anisotropic yield criteria for simulation has a better match in both cases with the experiments.
