

J. Cent. South Univ. (2018) 25: 2871-2882
DOI: https://doi.org/10.1007/s11771-018-3959-5

Optimizing process of preparing artificial-similar material for rocky slope with uniform formula design
FAN Tian-cheng(�����), ZHOU Chuan-bo(�ܴ���), JIANG Nan(���), WU Ting-yao(��͢Ң)
Departerment of Engineering, China University of Geosciences (Wuhan), Wuhan 430074, China
 Central South University Press and Springer-Verlag GmbH Germany, part of Springer Nature 2018
Abstract:
The determination of material formula needs try-and-error experiment, and consumes large amount of time and fund. In order to solve the problem, a comprehensive method is established, via the experiment of artificial-similar material formula of a mine slope. We controlled the samples by the compactness, and arranged the formula of the test group with the method of the uniform formula experiment. The physical and mechanical parameters of these samples were analyzed using the method of the partial least-squares regression (PLS). And a mathematical model of the indexes of physical and mechanics parameters relating to the factors of formulation constituents was established eventually. We used the model to analyze the effect of each formulation constituent on physical and mechanics parameters of samples. The experiment results and analysis illustrates that 1) in the formulation of similar material, the effect of raw materials on the internal friction angle �� and cohesion C is opposite; 2) The method can highly facilitate the process of the of preparing artificial-similar materials, more economic and effective.
Key words:
Cite this article as:
FAN Tian-cheng, ZHOU Chuan-bo, JIANG Nan, WU Ting-yao. Optimizing process of preparing artificial-similar material for rocky slope with uniform formula design [J]. Journal of Central South University, 2018, 25(12): 2871�C2882.
DOI:https://dx.doi.org/https://doi.org/10.1007/s11771-018-3959-51 Introduction
With the exploit of ore resources continuing and the development of mining engineering from the surface to the deep, the high and deep mine slopes, huge in size and quantity, have been forming. Especially, in the slopes of metal mine, the fault, one important characteristic of geological structure, is forming all the time. And this type of structure, high-steep appearance and flaw in the slope, containing the fault, is harmful to the stability of the slope. And considering the ore exploit with the blast method, generating dynamic load. Thus, there is serious security problem exploiting mine with this type of slope.
In order to invest the problem and ensure the security of the mine exploit, the method of numerical simulation or physical modelling experiment, is usually taken to discover the evolution mechanism of the stability of the high- steep flaw slope under the dynamic and static load. The similar-artificial material to the physical model is the key and fundament of conducting of physical modelling experiment successfully.
As is well-known, the determination of material formula needs try-and-error experiment, especially little information of the formula approached. It means large amount of time as well as money consumption, especially when valuable materials are involved. And in the global market, the problem, how to reduce the huge consumption in the process and judge the numerous and complicating candidates wisely under the project of limited amount of time and fund, strikes the brain of every material engineer promptly and heavily.
In order to solve this problem, the previous researchers mainly carry out the work from two aspects, the arrangement of experiment and the analyzation of candidate. The array of the formula and the method of analyzing and selecting in the experiment process are the two important focuses. Researchers usually take the orthogonal experiment design (OED) to arrange the experiment factors and its levels, and use the semi-quantitative method of the range and variance analysis to direct the analyzation and selection [1�C11]. Some learners have researched the artificial-similar materials to rock with the method mode [12�C18].
The mode to solve the problem still exist two deficiencies. The one is that the size and scale of the formula array are limited when the OED is taken to conduct the arrangement of the formula array, especially when the candidates contain valuable constituents, which limit the precision of the analyzation and selection of the candidate. The other one is that the analyzation and selection of the candidate with the semi-quantitative method are not pretty precise, which harm the reliability of the determination of material formula [13, 14]. Otherwise, the limitation quantity of factor and level given aforehand affect the precision of the analyzation and selection hereditarily.
Even if the expense of constituent in the test is not valuable, under the condition of more factors and levels, where the number of the test group is pretty huge with the orthogonal experimental design (OED), especially where the mean value of one parameter and the repetition of one formulation is needed, the number of the samples of one batch becomes a lot larger. It usually consumes a lot of time [18]. This problem will be more serious when the time is urgent. And the method of the uniform formula design (UFD) could avoid the phenomenon.
In our research of the similar-artificial material of one fault born in a high-steep flaw rocky slope, located in the eastern open-pit mining in Daye Iron Mine, the method of the UFD is taken to reduce the amount of the test group of formulation design. Meanwhile, in order to achieve the expectation of the high-efficient accomplishment of the experiment, we used the PLS method to establish the mathematical model, and analyzed and selected the candidates to direct the entire experiment further. One step of the preparation process of artificial- similar material is given, and Figure 1 sets the scene.
2 Experiment details
2.1 Background of research
Having been mined with the open-pit method for decades after the Republic Founding, the eastern open-pit mining becomes an extremely high and steep open-pit slope with the height of 230�C430 m and the slope angle of 38��C43��. A reverse fault F9 is born in the slope, and the zone near F9 contains many joints and crushed rock [18]. In the history of the slope, the landslide has occurred 4 times. The east open pits can be divided into six zones A, B, C, D, E and F according to engineering geological characteristics��so the area A is the focus of the physical model experiment research. The aerial view of Daye Eastern Open Pit and the schematic diagram of the engineering geological zoning of the slope in the eastern open-pit mining field are shown in Figures 2 and 3, respectively.
And the F9 seriously influences the mining work and safety. In order to research the mechanism process of the slope, we take the method of physical model experiment. The preparation and discovery of the artificial-similar material is the primary work. Reference to the former research of the slope [18�C23], via the similarity analysis, the physical and mechanical parameters of the artificial-similar material to the fault matters are obtained, as shown in Table 1.
2.2 Method and details
2.2.1 UFD and experiment design selection of raw material
The selection of raw material, in addition to meet the similar requirement of objective physical and mechanical parameters of the model in the process of experiment, should also follow the following principles:
1) The valuable materials should be low cost, stable performance, non-toxic and easy processing, namely, avoid choosing precious and special ones;
2) The chosen raw materials should fully consider the demands of different processing technology, and make the processing easy and time-saving.
3) The general characteristics of rock mass material in model experiment, i.e., rock mass similar material, should have severely high density, low strength, low modulus, which are pretty different from that of ones in nature.
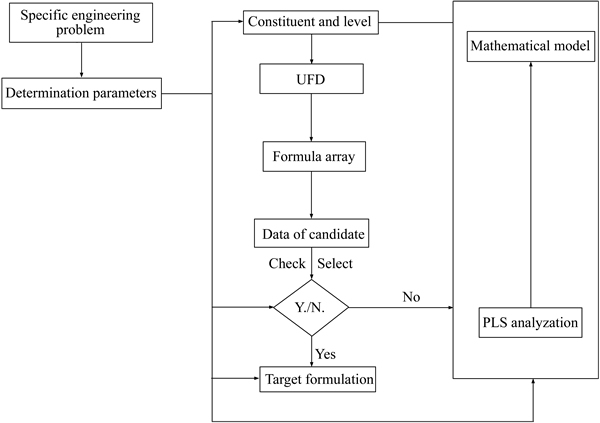
Figure 1 Flowchart of one step of preparation process of artificial-similar material
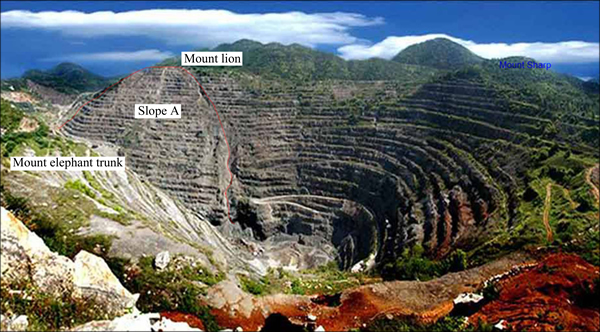
Figure 2 Aerial view of Daye east open pit
According to the requirements above, we sought the ingredients of fault similar material: three kinds of pickling coarse, fine, and silt quartz sand as aggregate, the mesh number of three kinds of the sand is 40, 80 and 280, respectively; Barite powder is the anhydrous powder of barium sulfate, which obtains slight caking property after being mixed with water. We used the mixture of barite powder and water as the binder material. The samples of raw materials we use are shown in Figure 4.
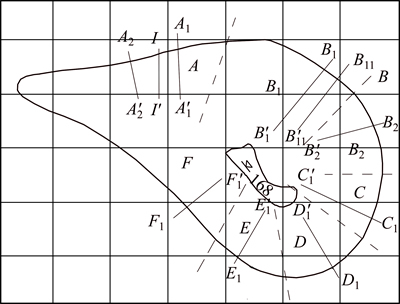
Figure 3 Schematic diagram of engineering geological zoning of slope in east open-pit mining field
Table 1 Physical and mechanical parameters of similar material to matters in fault F9
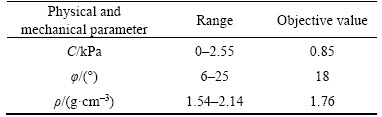
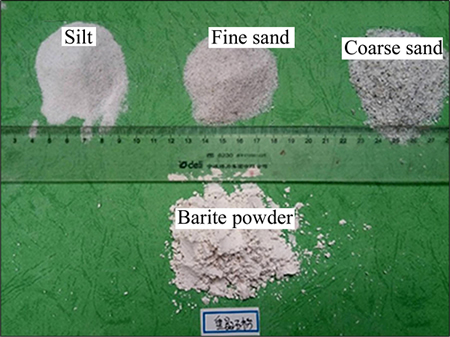
Figure 4 Four kinds of raw materials of fault zone similar materials
(1) Profile of theory of uniform experimental design
Uniform experimental design (UED) was initiated and matured by WANG [24] and FANG [25] which is base on the quasi-Monte Carlo method they popularized in practice [19�C23]. Its mathematical principle is using a method of number theory to find one space uniformly scattered point set (pseudo random number), so as to instead of a random number which is defined in quasi-Monte Carlo method. And the analytical problem is converted into the probabilistic problem of the same solution, so that they can use the method of statistical simulation to dispose the problem [24, 25].
This method is first to meet the need of missile design test to reduce the number of experiment group significantly. It emphasizes the homogeneity of experiment sites within the test scope, and the number of experiment group is less than orthogonal test and the complete test. For example, in an experiment design with x factors and n levels each factor set, the number of experiment group employing the comprehensive experiment design method is xn, for the orthogonal design experiment design is O(n2), but for the uniform experimental design method is only n. Therefore, the UED method can greatly reduce the workload of the experiment. And under the circumstance which the model of the experiment is unknown, it can totally control all possibilities. Today, the UED has become an important experiment design method, and it has the following advantages [24�C28]:
1) Filling all of the experiment space. Experiment combination points via the UED method can be strongly representative in the area;
2) High robustness. The UED method uses regression design ideas, which does not demand strong and hard assumptions about the model, so it has certain robustness of the arrangement of model;
3) Multilevel. The maximum number of levels can be arranged in a factor of all kinds of experiment designs;
4) Continuity. The number group via the UED method shows continuity with increasing levels.
(2) Experiment scheme of artificial-similar material uniform formula
In the experiment, we used the UED method to do the research for a similar material of fault. However, in the formula design, the contents of the components are no longer independent (i.e., in a formula, the increase of the content of one composition inevitably leads to a drop in others�� content). And the UED previously mentioned, as well as general experiment design, also demands the independence of each experiment factor. Hence, an improvement must be made of the UED, this creates the experiment design of similar material uniform formula, i.e., the uniform formula design (UFD).
The uniform formula design (UFD) is better than other formula designs, such as simplex lattice point design, simple center of gravity design, shaft design, etc, has the following advantages:
1) Solve the problem that the distribution of experiment points within the test scope is not pretty uniform;
2) Avoid the problem that there are too many points designed at the boundary (i.e., the lack of one or more components in the formula).
Uniform formula chart can directly give the concrete content of raw material in the formula. And the general steps are: firstly, according to the specified species of raw materials and the specific number of formula group, uniform design table can be generated; secondly, use one algorithm to deal with the array in the table, and then obtain the table of uniform formula [25, 28].
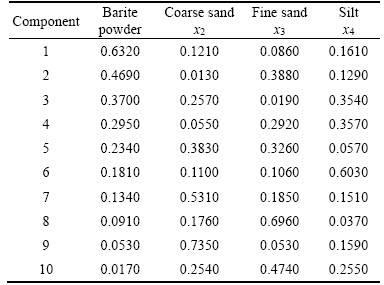
In the similar materials of fault, four components were set totally: three classes of particle size, coarse, fine, and silt quartz sand, barite powder. And we had determined the mixing water consumption is 14% of the total quality of solid through the preliminary formula test. Hence, only four compositions in the similar material were needed to determinate-quartz sand of three different particle sizes, barite powder.
Determining the group number of 10 to choose uniform experiment form, and according to the above method, we could get the uniform formula experiment form, as is shown in Table 2.
According to the preliminary formula test, the dosage of the barite powder is determined about 0.8 in the possible formulation. The formula code is undertaken as followed:
 (1)
(1)
 (2)
(2)
 (3)
(3)
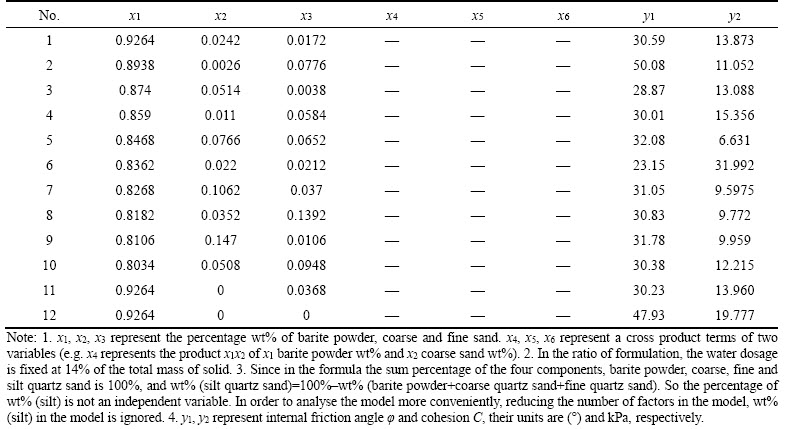
We prepare 5 samples for each candidate, and take the direct shear instrument to test the candidate parameter. The result of the direct shear test is shown in the Table 3.
Table 2 Uniform formula experiment table
2.2.2 Analysis method of uniform formula experiment results for similar material
1) Profile of theory of partial least-squares regression analysis
The method of partial least-squares regression analysis, one method of the statistics analyses, was thriving in the 20th century in China. And it was first produced in chemical field. In the use of the spectroscopy to predict the composition of chemical samples, the number of the wavelengths of the reflection spectra of the infrared zone, which deciphers variables, often exceeds the number of chemical samples. The fact that it brings about the multiple correlation may make it difficult to take use of the traditional least-square method.
A prominent feature of the PLS method, is that it combines the multiple linear regression analysis with the variable principal component analysis and canonical correlation analysis among variables, organically [28]. Via only one algorithm process, it realizes the regression modeling, data structure simplification and the correlation analysis between the two groups of variables, which brings great convenience to the analysis of the multivariate data.
There are unique advantages for partial least- squares regression method in dealing with the problems, existing the serious phenomena of multiple correlation among variables, of small sample capacity, large quantities of independent variables. In summary, there are the following points [29�C34]:
1) It can realize the regression modeling of the multiple dependent variables to multiple independent variables. Where there is a larger degree of correlation inside each variable set, the partial least-squares regression method can fully reflect the integrity of the model, more effective than variable regression model one by one.
Table 3 Uniform formulation and corresponding result of direct shear test
2) It can realize the regression modeling where there is a multiple correlation among the independent variables. By resolving and screening the information of data, the partial least-squares regression method can extract the strongest explanatory comprehensive variables for dependent variable and identify the system information and noise, thus effectively overcomes the problem of multiple correlations among variables and improves the stability of the analysis results.
3) It can be more concise than the common least-squares regression for screening out of the independent variables. The assistant analysis technology of the partial least-squares regression method could realize the screening of the independent variables in modeling process at the same time.
4) Via the principal component analysis and extract of comprehensive variables, it allows the regression modeling under the condition of the sample number less than the number of independent variables, where the general multivariate regression can not settle.
5) Under the condition of the same data information, that all of the original independent variables are contained in the final model, which makes the most of data information and makes the partial least-squares regression model more effective than the general multivariate regression model. Especially, it needs to consider the factors more comprehensively, in the design of uniform formula experiment, where the formulation compositions can not be removed at liberty.
2) Assistant analysis method of partial least- squares regression analysis
Now, some of PLS assistant analysis methods we employed in this article are introduced as follows:
1) Cross validation analysis
In brief, according to certain rules, the original data are divided into two categories-the modeling category (the training set) and testing category (the test set). The data of the modeling category is used to build the regression models, while the data of the testing category is used to measure how well models with different numbers of extracted factors fit. And the merits of the models are assessed by the predicted residual sum of squares (PRESS). According to the classification methods of the original data, cross validation analysis can be classified into one-at-a-time cross validation, blocked validation, split-sample cross validation and random sample cross validation. On the various kinds of cross validation analysis above, the handling method is similar. Now introduce the one-at-a-time cross validation, as an example [25, 27�C29]:
The first step: divide the data. The data set containing all the sample points (contain n�C1 sample points), having been removed certain one point i, is taken as the training set, while the removed data point i is taken as the test set;
The second step: Build the model. Using the training set, extracting h principal components, established a regression model;
The third step: Calculate the PRESSh. Substitute the testing data group (i.e., the sample point i) into the front regression model, and get the fitted value yj on the sample point i, named  ; For each i=1, 2, ��, n, repeat the steps above, and PRESSh can be defined,
 (4)
(4)
Obviously, it is sensitive to the changes of the sample points, and leads to the increase of the value of PRESSh that the stability of the regression equation is poor, resulting in large error.
In addition, use all the sample points to match the regression equation which contains h principal components. At this time, the predicted value of the ith sample point, in the equation, is named  , and the predicted residual squares sum of y is defined SSh,
 (5)
(5)
Generally speaking, the value of PRESSh is always more than that of SSh, while SSh is always less than SSh�C1. The SSh�C1 is the fitting error of the equation, all the sample points fitting with h�C1 principal components. The PRESSh adds a component th, and contains the perturbation error of sample points. If the perturbation error of the regression equations, containing h components, can be less than the fitting error of that, containing h�C1 components in a degree, the addition of a component th will significantly improve the accuracy of prediction.
Therefore, the smaller the value of (PRESSh/SSh) is, the better. But there is not a judgment. In the actual processing, the selection of the number of principal components can be simplified as follows: 1) PRESSh gets to the satisfaction of accuracy; 2) the number of principal components is less than 1/3 of the number of samples to ensure the effectiveness of statistics. The application shows that partial least-squares regression is of fast convergence, and you can generally obtain satisfactory results, when h=1�C3.
2) Variable importance in projection
In partial least-squares regression analysis, the explanation ability of the independent variable to the dependent variable can be measured by variable importance in projection [30]. Its defined formula is as follows:
 (6)
(6)
In this formula, ��hj is the j-th component of the axis ��h, which measures the contribution of xj to the principal component th. Rd(y; t1, ��, tm) and Rd(y; th), respectively, are the variation precision (a coefficient measured), which y is explained of by th and t1, t2, ��, tm, i.e., they respectively represent the explanatory ability of th to y and the accumulated explanatory ability of t1, t2, ��, tm to y, and:
 (7)
(7)
In this formula above, r2(y,th) is the correlation coefficient of y to the main component th.
In the definition formula of VIPJ, the explanatory ability of xj to y is realized through th. If th plays a considerable role in the interpretation of y, and xj plays an important role in the constitution of th, the explanatory role, xj to y, is regarded as very important. Namely, if Rd(y; th) and ��hj get great value under the principal component th, the explanation xj to y, plays an important role.
Besides,

 (8)
(8)
Therefore, if k independent variables about xj (j=1, 2, ��, k) plays the same role in the explanation of y, then all the VIPJ equal 1; otherwise for a large value VIPJ (greater than 1) of xj, the explanatory role will be important. WOOD et al [29] thought that the impact of this dependent variable is small on the model, when the VIPJ of a dependent variable is less than Wold��s Criterion (0.8).
3 Results and discussion
3.1 Results of uniform formula experiment
Taking use of the PLS method to process the data in Table 3, we obtained the PLS model of material ��component-the index of shearing strength�� (as shown in Table 4). According to the parameter index specified appropriately and the PLS model, we obtained six groups of parameter, totally 12 candidates of the possible formulation (shown in Table 5).
By the same means, we got the parameter of the candidates, in Table 6. The objective value of parameter is that range 0�C2.55 kPa for C, and range 6��C25�� for ��. It can be found that the candidates of 1#, 5# and 6# are the objective formulation ingredients.
3.2 PLS model analysis for uniform formula experiment
In order to show how to clarify the impact of each raw material on the parameters of artificial-similar material for the fault, and guide the formula design experiment in the next step precisely, we used the PLS method to analysis the intermediate result of the formulation and its corresponding direct shear data (shown in Table 3).
3.2.1 Cross validation analysis
Figure 5 shows the fitting degree of the model��s variation, while the number of principal components model changes from 1 to 6 in the modeling process. Select the number of the principal components where the prediction error��s sum of squares and average root (root mean PRESS) evolves into the minimum.
Table 4 Specific information of PLS model for test results of artificial-similar material
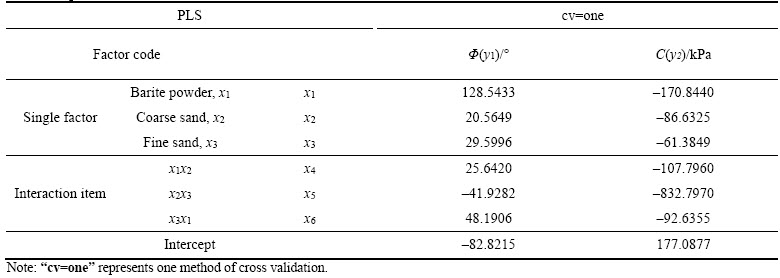
Table 5 Combinations of �� and C, corresponding range of x1, and selected formulation combinations
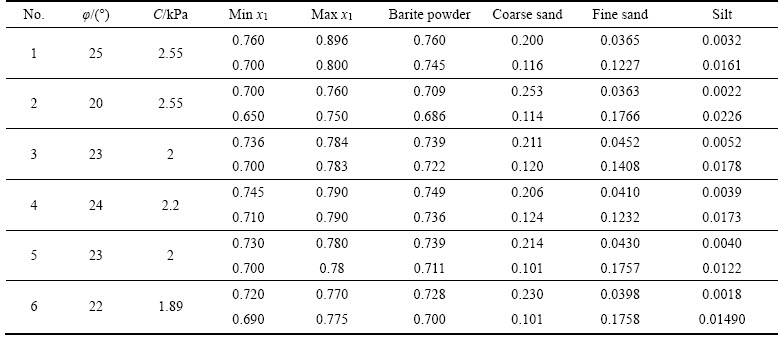
Table 6 Formula of fault��s similar material and its test result
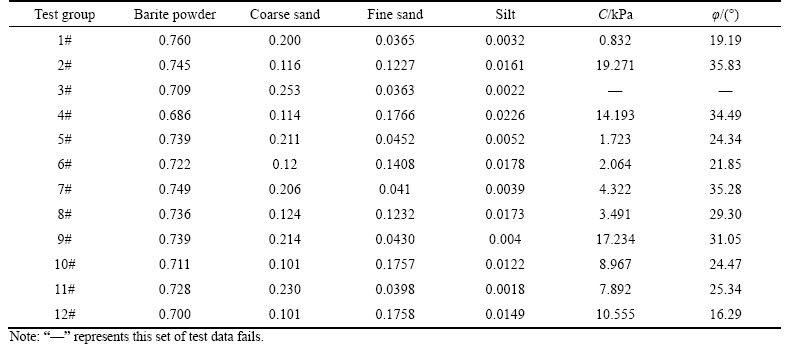
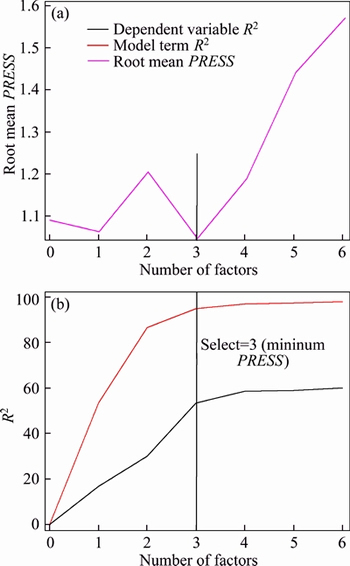
Figure 5 Optimization of number of principal component for PLS model
It reads that where the number of principal components model is set 3, the prediction error��s sum of squares�� average root obtains the minimum value, 1.0464. The coefficient reflecting the fitting degree of the entire model (model term R2,97.0797), and the coefficient reflecting the amount of information of dependent variables (Dependent Variable R2, 55.3069) both evolve into the peak.
Therefore, it is more reasonable to select 3 principal components to do the model analysis.
3.2.2 Importance analysis in variable projection
Figure 6 describes the phenomenon that each selected dependent variable reflects the amount of the information in the PLS model, i.e., the degree of importance to the model, named variation importance projection (VIP).
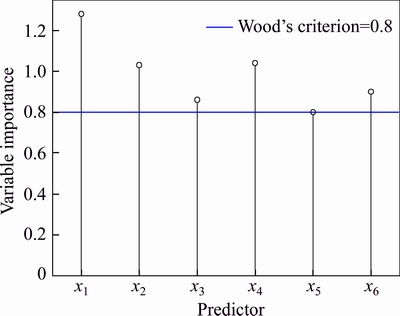
Figure 6 Variation importance factors of PLS regression model
As shown from the chart, the dependent variable importance factors, in order of size, are shown as follows:


It is the fact that except that the VIP value of x5 is slightly larger than Wold�� limit, those of x3, x6 are much larger than Wold�� limit, those of x1, x2, x4 are all larger than 1.2, that indicates the degree of importance of each variable arranges from high to low particularly, characterized in which: x1>1.2>x2�� x4>1>x3>x6>0.8��x5. Corresponding to the actual formulation in the Table 5, barite powder, coarse sand, and fine sand are important to the model in descending order of VIP. However, because of their VIP greater than Wold�� limit, their significances are still outstanding.
3.2.3 Sensitivity analysis of PLS model factor
Figure 7 shows the relative size of the coefficients of the various independent variables in the model. In order to facilitate the comparison of the relative size of the respective coefficient, the data have been standardized, which the mean are set to be 0, and variance to be 1.
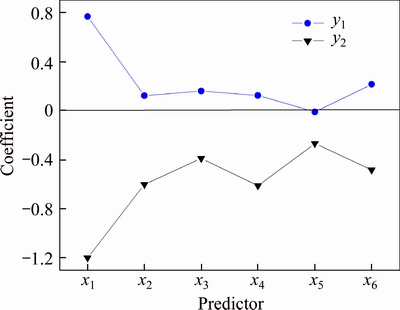
Figure 7 Factors�� coefficient of PLS regression model
From Figure 7, we can see that the coefficients of the independent variables, x1, x2, x3, x4, x5, x6, respectively show the opposite symbol result for dependent variables, indicating that in the formulation design, the content of barite powder (x1), coarse sand (x2), fine sand (x3), along with two cross product items among them, have a contrary effect on the internal friction angle ��(y1) and cohesion C(y2).
In addition, it sees the fact from the signs and relative size of each factor: the content of barite powder (x1) is both sensitive to the internal friction angle �� (y1) and cohesion C (y2) of artificial-similar material, and the larger the amount of barite powder, the more the internal friction angle ��, but the smaller the cohesion C. The content of coarse sand (x2) and fine sand (x3) has a similar law, but the degree of sensitivity is lower than the content of barite powder (x1).
4 Conclusions
1) After determining the composition of the artificial-similar material, the mathematic model, established using the PLS, can guide the formula design of the follow-up material experiment. And that it can get the preciser formulation content of the artificial-similar material, only through a fewer groups of the formula design experiments, enhances the direction and objective of the formula design.
2) In the formula experiment of the artificial- similar material, the key parameters of the objective materials are usually various, and the influence of one ingredient of the formulation exists on all the parameters. Therefore, it is difficult to solve this problem via the general regression analysis method. And the PLS can avoid these phenomena perfectly. The uniform design, including the UED and UFD, can arrange much more factors and levels in smaller quantities of candidate.
3) It is the UFD that can be used to solve the discovery of the desired proportion of artificial-similar materials in the mixture area, where the objective formulation possibly exists. The load of the UFD is significantly reduced, compared with that of the OED. In this way, combined with the PLS, the comprehensive method can shorten the time and fund consumption of the experiment sharply.
Acknowledgments
The work was finished with the help of many people, especially CHEN Dong, LI Ren-chao, WU Ting-yao, CHEN Si-yuan, CAI Jia-yuan and Zhou Jia-quan, who assisted with the experiment operation, the teachers, LI Ming and SU Yun, who put forward the helpful suggestions.
References
[1] QIN C, GOU G Q, CHE X L, CHEN H, CHEN J, LI P, GAO W. Effect of composition on tensile properties and fracture toughness of Al�CZn�CMg alloy (A7N01S-T5) used in high speed trains [J]. Materials & Design, 2016, 91: 278�C285.
[2] LI Z, WANG Y, YU Q. Significant parameters in the optimization of synthesis of silver nanoparticles by chemical reduction method [J]. Journal of Materials Engineering and Performance, 2010, 19(2): 252�C256
[3] SIVAPRAGASH M, KUMARADHAS P, RETNAM B S J, JOSEPH X F, PILLAI U T S. Taguchi based genetic approach for optimizing the PVD process parameter for coating ZrN on AZ91D magnesium alloy [J]. Materials & Design, 2016, 90: 713�C722.
[4] SAHOO P. Wear behaviour of electroless Ni�CP coatings and optimization of process parameters using Taguchi method [J]. Materials & Design, 2009, 30(4): 1341�C1349.
[5] KOILRAJ M, SUNDARESWARAN V, VIJAYAN S, RAO S K. Friction stir welding of dissimilar aluminum alloys AA2219 to AA5083�COptimization of process parameters using Taguchi technique [J]. Materials & Design, 2012, 42: 1�C7.
[6] CAI A H, CHEN H, TAN J Y, CHEN M, LI X S, ZHOU Y, AN W K. Optimization of compositional and technological parameters for phosphate graphite sand [J]. Journal of Materials Engineering and Performance, 2008, 17(4): 465�C471.
[7] RAMAVANDI B, ASGARI G, FARADMAL J, SAHEBI S, ROSHANI B. Abatement of Cr (VI) from wastewater using a new adsorbent, cantaloupe peel: Taguchi L16 orthogonal array optimization [J]. Korean Journal of Chemical Engineering, 2014, 31(12): 2207�C2214.
[8] LI Zhi-hua, WANG Yan-wei, YU Qina-qian. Significant parameters in the optimization of synthesis of silver Nanoparticles by chemical reduction method [J]. Journal of Materials Engineering and Performance, 2010, 19(2): 252�C256.
[9] SHARMA P, VERMA A, SIDHU R K, PANDEY O P. Process parameter selection for strontium ferrite sintered magnets using Taguchi L9 orthogonal design [J]. Journal of Materials Processing Technology, 2005, 8(1): 147�C151.
[10] XU J M, WANG P, MA X C, QIAN Y, CHEN R. Parameters studies for rail wear in high-speed railway turnouts by unreplicated saturated factorial design [J]. Journal of Central South University, 2017, 24(4): 988�C1001.
[11] ZHENG L H, WANG J F, LI X P, ZHANG Y, LI D. Optimization of rheological parameter for micro-bubble drilling fluids by multiple regression experimental design [J]. Journal of Central South University of Technology, 2008, 15(S1): 424�C428.
[12] NIU X H, MENG X L, ZHANG Z T, ZHAO R, SHEN B F. Modeling and analysis of plunge milling force based on orthogonal experiment [J]. Applied Mechanics and Materials, 2013, 391: 372�C375.
[13] CHAN C W, SMITH G C. Fibre laser joining of highly dissimilar materials: Commercially pure Ti and PET hybrid joint for medical device applications [J]. Materials & Design, 2016, 103: 278�C292.
[14] ALQRAGHULI W A A, ALKARKHI A F M, YUSUP Y. Proposed procedure for estimating the coefficient of three-factor interaction for 2p3m4q factorial experiments [J]. International Journal of Engineering, Transactions A: Basics, 2018, 31(1): 12�C18.
[15] LIANG Z, LIAO S, WEN Y, LIU X. Working parameter optimization of strengthen waterjet grinding with the orthogonal-experiment-design-based ANFIS [J]. Journal of Intelligent Manufacturing, 2016: 1�C22.
[16] CHEN Zhi-zhou, YIN Guo-ping. Optimization of processing technology of acetylated corn starch films [J]. Applied Mechanics and Materials, 2012, 200: 267�C270.
[17] GAO Ji, LIU Qing-yang, MA Xiao-fang. Research on surface roughness of superalloy thin-walled parts with electrical discharge grinding based on orthogonal test [J]. Applied Mechanics and Materials, 2012, 198�C199: 202�C206.
[18] DINGBANG Z, CHUANBO Z, DAN H E, JINGSHAN S, ZHIHUA Z. Similar material preparation of underground caving mining model with super high-steep slope [J]. Journal of Central South University (Science and Technology), 2013, 44(10): 4221�C4227. (in Chinese)
[19] JIANG N, ZHOU C, LU S, ZHANG Z. Effect of underground mine blast vibrations on overlaying open pit slopes: A case study for Daye iron mine in China [J]. Geotechnical and Geological Engineering, 2018, 36: 1475�C1489.
[20] DING B Z, CHUAN B Z, YANG B L, JIAN Y Y. Physical model test and numerical simulation study of deformation mechanism of wall rock on open pit to underground mining [J]. International Journal of Engineering, Transactions B: Applications, 2014, 27(11): 1795�C1802.
[21] ZHOU C B, HE R, JIANG N, LU S W. Sensitivity analysis and 3D-displacement inversion of rock parameters for high steep slope in open-pit mining [J]. Open Civil Engineering Journal, 2016, 10: 448�C460.
[22] CHEN Zhi-zhou, YIN Guo-ping. Optimization of processing technology of acetylated corn starch films [J]. Applied Mechanics and Materials, 2012, 200: 267�C270.
[23] BELL F G. Engineering properties of soils and rocks of soils and rocks [M]. England: Whitstable Litho Ltd, 1983.
[24] WANG Yuan. Uniform design-one method of experiment design [J]. Science & Technology Review, 1994(5): 20�C22. (in Chinese)
[25] FANG Kai-tai. Uniform design and the table of uniform design [M]. Beijing: Science Press, 1994. (in Chinese)
[26] XIE X D, ZHOU K, CHEN B Y, CHANG C T. Degradation of oxytetracycline using microporous and mesoporous photocatalyst composites: Uniform design to explore factors [J]. Journal of Environmental Chemical Engineering, 2016, 4(4): 4453�C4465.
[27] WANG Tie-ying, WANG Huan-ding, ZHANG Yong-shan, LIU Wen-guang. Height-width ratio limited value for rubber bearing isolated structure computed by uniform design method [J]. Journal of Harbin Institute of Technology (New Series), 2007, 14(1): 36�C40.
[28] CHEN Zhou-jun, FENG Long-long, LI Bao-liang. Study on the optimal formula of lubricant with uniform design [J]. Advanced Materials Research, 2012, 399�C401: 1196�C1199.
[29] WOOD M F G, COTE D, VITKIN I A. Combined optical intensity and polarization methodology for analyte concentration determination in simulated optically clear and turbid biological media [J]. Journal of Biomedical Optics, 2008, 13(4): 044037.
[30] WOOD J E, ALLAWAY D, BOULT E, SCOTT I M. Operationally realistic validation for prediction of cocoa sensory qualities by high-throughput mass spectrometry [J]. Analytical Chemistry, 2010, 82(14): 6048�C6055.
[31] MONK W A, WOOD P J, HANNAH D M, EXTENCE C A, CHADD R P, DUNBAR M J. How does macroinvertebrate taxonomic resolution influence ecohydrological relationships in riverine ecosystems [J]. Ecohydrology, 2012, 5(1): 36�C45.
[32] KHOSHMANESH A, DIXON M W, KENNY S, TILLEY L, MCNAUGHTON D, WOOD B R. Detection and quantification of early-stage malaria parasites in laboratory infected erythrocytes by attenuated total reflectance infrared spectroscopy and multivariate analysis [J]. Analytical Chemistry, 2014, 86(9): 4379�C4386.
[33] WANG Y, BOYSEN R I, WOOD B R, KANSIZ M, MCNAUGHTON D, HEARN M T. Determination of the secondary structure of proteins in different environments by FTIR-ATR spectroscopy and PLS regression [J]. Biopolymers, 2008, 89(11): 895�C905.
[34] ZANG Qing-da, KEIRE D A, WOOD R D, BUHSE L F, MOORE C M V, NASR M, AL-HAKIM I, TREHY M L, Welsh W J. Determination of galactosamine impurities in heparin samples by multivariate regression analysis of their 1H NMR spectra [J]. Analytical and Bioanalytical Chemistry, 2011, 399(2): 635�C649.
(Edited by HE Yun-bin)
���ĵ���
���ھ����䷽��Ƶ����ʱ������Ʋ����Ʊ������Ż�
ժҪ���������Ʋ��ϵ�������ȣ���Ҫͨ������������������ܹ���ã�������ķѴ�����ʱ�����ʽ�Ϊ�˽��������⣬��Ϲ���ʵ�ʣ���չ���ڿ�ɽ���µ����Ʋ���������飬����һ���ۺ������������������������У�ͨ������ʱ������ѹʵ���������������ܶȣ�ͬʱ�����������飬�����鷽��������ơ�Ȼ����ƫ��С���˻ع������PLS��������������������ѧ���������ۺϷ��������������Ʋ��ϵ���Ҫ�ɷ���Ϊ��Ҫ�������أ�����һ����ѧģ�ͣ������õ����Ʋ��ϵ���ȳɷֶ�������������ѧ������Ӱ�졣ͨ���������ó����½��ۣ�1�������Ʋ��ϵ���������У����Ʋ��ϵ�ÿһ����Ҫ�ɷֶ���������Ħ���ǵ���ճ������Ӱ��Ч�����Ǵ����෴��ϵ�ġ�2�����ַ������������������鿪չ��Ч�ʣ����������鿪չ����ķ��ã����������龭�ø�Ч�Ľ��С�
�ؼ��ʣ��˹����Ʋ��ϣ��Ż��������䷽���飻ƫ��С���˻ع�
Foundation item: Projects(41372312, 51379194) supported by the National Natural Science Foundation of China; Project(CUGL140817) supported by the Fundamental Research Funds for the Central Universities of China University of Geosciences (Wuhan); Project(2014CFB894) supported by the Natural Science Foundation of Hubei Province of China; Project(2014M552113) supported by the China Postdoctoral Science Foundation
Received date: 2017-09-08; Accepted date: 2018-04-02
Corresponding author: ZHOU Chuan-bo, PhD, Professor; Tel: +86-13707175382; E-mail: cbzhou@cug.edu.cn; ORCID: 0000-0003- 3056-9946
Abstract: The determination of material formula needs try-and-error experiment, and consumes large amount of time and fund. In order to solve the problem, a comprehensive method is established, via the experiment of artificial-similar material formula of a mine slope. We controlled the samples by the compactness, and arranged the formula of the test group with the method of the uniform formula experiment. The physical and mechanical parameters of these samples were analyzed using the method of the partial least-squares regression (PLS). And a mathematical model of the indexes of physical and mechanics parameters relating to the factors of formulation constituents was established eventually. We used the model to analyze the effect of each formulation constituent on physical and mechanics parameters of samples. The experiment results and analysis illustrates that 1) in the formulation of similar material, the effect of raw materials on the internal friction angle �� and cohesion C is opposite; 2) The method can highly facilitate the process of the of preparing artificial-similar materials, more economic and effective.
