

Predictive model based on artificial neural net for purity of perovskite-type SrTiO3 nanocrystalline
REN Qing-li(������), CAO Quan-xi(��ȫϲ)
School of Technical Physics, Xidian University, Xi��an 710071, China
Received 10 April 2006; accepted 25 April 2006
Abstract:
A three-layer structure back-propagation network model based on the non-linear relationship between the purity of the perovskite-type SrTiO3 nano-crystal samples and the technology factors, such as reaction time, reaction temperature, raw material adding amount of NaOH and SrCl2, and the rate of TiCl4/Hl, was established. The input variables were pretreated by using the main component analysis firstly. Moreover, the momentum terms were introduced so as to accelerate the converging rate and avoid the non-converging situation. At the same time, the variable learning speed was adopted. The results show that the improved back propagation neural network model is very efficient for the prediction of the perovskite-type SrTiO3 nano-crystal sample purity.
Key words:
SrTiO3; nano-crystal; preparation; back-propagation; neural network;
1 Introduction
SrTiO3 nano-crystal is one of the most promising nano-crystal. However, the relationship between the purity of the SrTiO3 sample and its technology factors is very complex. Artificial neural net technology can reflect the non-linear relationship between the actual state development tendency and the state input signals[1], so it can process the prior-calculation of multi-factors. Back propagation (BP) model of the feed-forward multi-layer neural network is now widely applied in the artificial neural network. It has significant practical worth in various scientific fields[2-15].
In this study, artificial neural net is used in the prediction model of SrTiO3 purity according to its self-study ability and approaching non-linear reflection ability. So, the prediction of the synthesized perovskite-type SrTiO3 nano-crystal sample purity can be performed according to this prediction model for different technology conditions, including reaction time, reaction temperature, raw material adding amount of NaOH and SrCl2, and molor rate of TiCl4 to HCl.
2 Experimental
2.1 Preparation of SrTiO3 nanocrystalline
The constituent oxides, TiCl4, HCl, SrCl2 and NaOH were weighed in a proper molar ratio according to the nominal composition SrTiO3 and mixed in water by stirring for n h at about m �� and atmospheric pressure. The slurry was then dried at 90 ��. The phase composition was analyzed using Japan automatic X-ray diffraction meter (Rigaku-2400D/MAX 12kW). The SrTiO3 sample purity was calculated according to the following Eqn:
 (1)
(1)
where Ii is the diffraction strongest peak of the phase i; Iy is the diffraction strongest peak of the perovskite-type SrTiO3 nano-crystals.
2.2 Algorithm of BP neural networks
In the classical structure of a BP, the output of each layer is sent directly to neuron in the layer above. While there can be many layers, but the processing can be done with a minimum of three layers: one layer that receives and distributes the input pattern, one middle or hidden layer that captures the nonlinearities of the input/output relationship, and one layer that produces the output pattern. BP networks are trained by presenting a series of input/output pattern sets to the network repeatedly. The network gradually ��learns�� the input/output relationship of interest by adjusting the mass to minimize the error between the actual and predicted output patterns of the training set. The trained network is usually examined through a separated set of data called the test set to monitor its performance and validity. When the mean squared error of the test set reaches a minimum, network training is considered complete and the weights are fixed.
3 Results and discussion
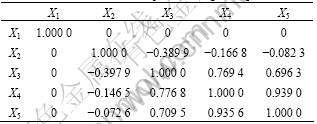
The experimental data used for the calculation is shown in Table 1. Based on the experiment results, there is a certain correlation among the five technological factors. If there are much more variables, or if there is a correlation among the variables, redundance among data may be appeared, which can also cause complex error surface and lead to the local minimization easily using the correct algorithm. Accordingly, the five input variables were pretreated by using the main component analysis firstly[16]. The correlation of the five input variables calculated is shown in Table 2. According to Table 2, there is a correlation among the concentration of NaOH and the molar rate of TiCl4 to HCl and the concentration of SrCl2. A correlation also excises among reaction temperature and the concentration of SrCl2 and the molar rate of TiCl4 to HCl. The experiment results show that the preparation process of SrTiO3 nano-crystal is as follows:
1) A sort of white deposition Ti(OH)4 forms after TiCl4 and NaOH;
2) SrTiO3 nano-crystal forms after the reaction of Ti(OH)4, NaOH and SrCl2.
So, only a certainty reaction temperature and concentration of NaOH and the molar rate of TiCl4 to HCl is guaranteed, the formation of the amorphous deposition Ti(OH)4 is assured.
And only a certain reaction temperature and concentration of SrCl2 is assured, the essential condition for Sr2+ entering the amorphous deposition Ti(OH)4 and forming the SrTiO3 nano-crystal can be satisfied.
It is clear that the conclusion obtained by the autoregression algorithm is almost as the same as that of the experimental results about the correlation of the five variables in Table 1. Based on the correlation of the five input variables��their eigen value ��i are 0.055 6, 0.249 9, 1.000 0, 1.020 9 and 2.682 6, respectively. Here
![]() then ��5/a=0.538 32, ��4/a=0.201 98, ��3/a=0.200 40, so
then ��5/a=0.538 32, ��4/a=0.201 98, ��3/a=0.200 40, so ![]() Three main com-
Three main com-
ponents were chosen as the input vectors of neural networks, and the mass fractions that they occupied are 53.83%, 20.21%, 20.06%, respectively.
Moreover, the BP network is improved. In order to repress iteration vibration, accelerate the converging rate, and avoid the non-converging situation, the momentum terms of ����Wkj(n) and ����Wji(n) are introduced firstly, where �� is the momentum term constant (0�ܦ���1). Secondly, the step length �� is chosen according to the
Table 1 Purity of perovskite-type SrTiO3 sample and technological factors

Table 2 Interrelated relationship of five original input variables
following equation:

Thirdly, the primary value of the mass was chosen in the range of [-2,2] randomly.
According the calculated results��see Tables 3 and 4��, it is clear that increasing the number of the hidden layer from 2 to 4, the prediction precision is increased, and the test prediction error is decreased. However, the time that its training set consumed is increased. So, it is regarded that increasing the number of neuron in hidden layer means increasing the calculation load, which increases the complexity of imitating curve surface. Moreover, the prediction converging speed is improved after momentum term is affixed and converging step is modified. Besides, test set prediction error calculated by using the main component variable is smaller than that of using the original data.
4 Conclusions
The improved BP neural network is efficient for the prediction of the perovskite-type SrTiO3 nano-crystal sample purity after the five original input variables are pretreated by using the main component analysis firstly.
Table 3 Prediction results using BP neural network
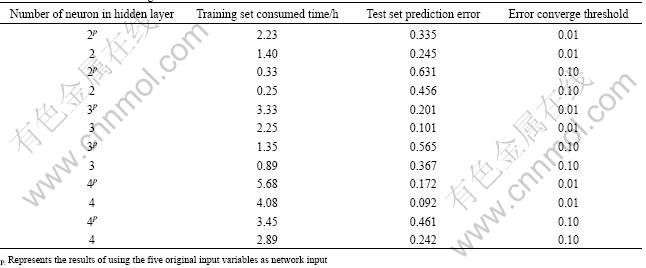
Table 4 The prediction results using improved BP neural network

[1] JIAO L C. Theory of Neural Net System[M]. Xi��an: Press of Xidan University, 1990.(in Chinese)
[2] LAHIRI A, CHAKRAVORTI S. A novel approach based on simulated annealing coupled to artificial neural network for 3-D electric-field optimization [J]. IEEE Transactions on Power Delivery, 2005, 20(3): 2144-2152.
[3] ASHHAB M S, AHMED A S. Optimization of hot-wire thermal flow sensor based on a neural net model[J]. Applied Thermal Engineering, 2006, 26(8-9): 948-955.
[4] BAHRAM H. Net analyze signal-artificial neural network (NAS-ANN) model for efficient nonlinear multivariate calibration[J]. Analytica Chimica Acta, 2005, 535(1-2): 275-285.
[5] SOZEN A, ARCAKLIOGLU E, OZKAYMAK M. Modeling of turkey��s net energy consumption using artificial neural network[J]. International Journal of Computer Applications in Technology, 2005, 22(2-3): 130-136.
[6] HEUVELMANS G, MUYS B, FEYEN J. Regionalization of the parameters of a hydrological model: comparison of linear regression models with artificial neural nets[J]. J Hydrology, 2006, 319(1-4): 245-265.
[7] RAJU K S. Artificial neural networks and multicriterion analysis for sustainable irrigation planning[J]. Computers and Operations Research, 2006, 33(4): 1 138-1 153.
[8] MureSAN S, SADOWSKI J. ��In-house likeness��: comparison of large compound collections using artificial neural networks[J]. J Chemical Information and Modeling, 2005, 45(4): 888-893.
[9] MELESSE A M, HANLEY R S. Artificial neural network application for multi-ecosystem carbon flux simulation[J]. Ecological Modeling, 2005, 89(3-4): 305-314.
[10] ROLANDO P. Using neural nets to forecast the unemployment rate[J]. Business Economics, 2006, 41(1): 37-44.
[11] DAVID W, DAVID I, DAVID M, et al. A global-local artificial neural network with application to wave overtopping prediction[J]. Lecture Notes in Computer Science, 2005, 3 697: 109.
[12] NING G M, SU J, LI Y Q, WANG X Y, LI C H, YAN W M. Artificial neural network based model for cardiovascular risk stratification in hypertension [J]. Medical and Biological Engineering and Computing, 2006, 44(3): 202-208.
[13] MAHMOUD A B, NaDER S S. Pattern recognition of control charts using artificial neural networks��analyzing the effect of the training parameters[J]. J Intelligent Manufacturing, 2004, 15(5): 635-644.
[14] MAGARGLE R, HOBURG J F, MUKHERJEE T. Microfluidic injector models based on artificial neural networks[J]. IEEE Transactions on Computer-Aided Design of Integrated Circuits and Systems, 2006, 25(2): 373-380.
[15] LIU B P, LI Y, ZHANG L, ZHANG L M, WANG X F, WANG J D. Automated recognition of VOCs using artificial neural networks[J]. Spectroscopy and Spectral Analysis, 2006, 26(1): 51-53. (in Chinese)
[16] WANG X R, WEN Z L. Applied Regression Analysis[M]. Chongqing: Press of Chongqing University, 1991. (in Chinese)
Foundation item: Project (2004E113) Supported by the Natural Science Basic Research Plan of Shaanxi Province of China
Corresponding author: REN Qing-li; Tel: +86-29-82551108; E-mail: qlren@mail.xidian.edu.cn, abcdrenqingli@263.sina.co
