
J. Cent. South Univ. (2012) 19: 2403-2410
DOI: 10.1007/s11771-012-1288-7![]()
Simulation of thermomechanical behavior during continuous casting process based on MiLE method
XIA Yun-jin(���ƽ�)1,2, WANG Fu-ming(������)1, LI Chang-rong(���)3, WANG Jin-long(������)1
1. School of Metallurgical and Ecological Engineering,
University of Science and Technology Beijing, Beijing 100083, China;
2. School of Metallurgy and Resources, Anhui University of Technology, Maanshan 243002, China;
3. School of Materials Science and Engineering, University of Science and Technology Beijing, Beijing 100083, China
? Central South University Press and Springer-Verlag Berlin Heidelberg 2012
Abstract:
A new method called mixed Lagrangian and Eulerian method (MiLE method) was used to simulate the thermomechanical behavior during continuous casting process of steel YF45MnV. The simulation results are basically in agreement with the measured data. The delaying period at the beginning of solidification is about 0.1 in square root of solidification time which is agreement with the data in literatures, and shell thickness increases in linear relation to square root of solidification time. The bloom surface temperature decreases gradually as the casting proceeds. The effective stress in the corner is much larger than that in the mid-face. The corner area is the dangerous zone of cracking. The effects of mold flux break temperature on the air gap and hot tearing indicator were also modeled. The model predicts that the bloom surface temperature increases with the increase of the mold flux break temperature, but the heat flux decreases with the increase of the mold flux break temperature. The hot tearing indicator is much smaller when the mold flux break temperature is higher.
Key words:
1 Introduction
The quality of cast metal is related to heat transfer in the continuous casting mold. Mold flux not only plays a role as a lubricant between solidified shell and mold wall, but also influences the heat transfer in mold. Mold flux in the continuous casting mold may have a structure that is liquid, glass, crystalline or combination of them, as known generally. These layers of mold flux comprise a large resistance to heat removal, although they provide uniformity relative to the alternative of an intermittent vapor gap found with oil casting of billets. Heat conduction across the slag depends on the thickness and conductivity of its layers, which, in turn, depends on their velocity profile, crystallization temperature [1], viscosity and state (glass, crystalline, or liquid). When the steel shell remains above its crystallization temperature, a liquid slag layer will move downward, performing the major lubricating function. As the continuous casting processes, the mold flux will solidify, forming a solid mold flux which may consist of glass and crystalline. At the same time, the air gap which has a high resistance may form due to the strand shrinks and the solid mold flux can not be completely full with the strand and mold.
Some simulations about fluid flow, temperature distribution and shell thickness in mold have been done [2-6]. The method of most of them is steady state computation, which uses Eulerian method. According to this method, a fixed domain is modeled, and the solid is transported at the casting speed through this domain. And fewer is involved in the effect of mold flux on the thermomechanical behavior in mold. In the present work, in order to investigate the thermomechanical behavior in mold, a finite element code called ProCAST which provided a mixed Lagrangian and Eulerian method (MiLE Method) [7] was used. The model was then used to analyze the effect of mold flux properties on the shell. Particular attention was paid to the evolution of crystalline, glass and liquid mould flux layers using an iterative heat transfer model between the shell and the mold. Finally, the model was used to investigate the effect of flux break temperature on the air gap and hot tearing indicator.
2 Mathematical and physical model
2.1 MiLE algorithm
Figure 1 shows the schematics of the MiLE method. At the beginning, the casting is divided into two domains (1 and 2). Then, as the continuous casting process starts, the bottom, Domain 2 moves down, while the Domain 1 stays at its initial position. In order to have continuity between the two domains, new elements have to be introduced (Domain 3). To make this possible, a number of layers of elements with initial zero thickness is stored at the interface between two domains. As the downstream domain moves down, the layers are gradually ��unfolded��, similar to the unfolding of an accordion. By doing so, layers of new elements are introduced on the top of Domain 3. To ensure the continuity of temperature and velocities between domains 1 and 3 through the unfolded nodes, some periodic boundary conditions are applied at the interface. All the nodes which have identical coordinates will be given the same field values. Domain 1 uses Eulerian algorithm, Domain 2 and 3 use Lagrangian algorithm. During the calculation process, Domain 2 is translated at the casting speed and the accordion will unfold itself in between Domain 1 and 2. The MiLE algorithm allows only to model ��straight�� continuous casting processes, but it allows to couple stress with the heat and fluid computations.
2.2 Description of model
The following basic assumptions are used in model:
1) The continuous casting process is a non-steady process;
2) The temperature of meniscus is pouring temperature;
3) The main heat transfer of solidified shell is conduction;
4) According to symmetry, one fourth of the cross section is considered as the object of study to analyze the heat transfer, melt flow and stress deformation process of bloom in mold.
2.3 Governing equations
The governing equations used in this work are the same with Ref. [3]. An enthalpy method is used to solve the phase change problem during solidification. The standard momentum equations have been modified to include a Darcy term, thus their applicabilities are stretched to treat mushy and solid phases.
2.4 Stress model
The solidified shell experiences a complex set of forces, including: 1) ferro-static pressure due to liquid metal, 2) contraction forces due to cooling of the shell and 3) possible contact forces from the mould due to taper and oscillation acting on the outside of the shell. Stress analysis is only carried out on the bloom which has been solidified, and the solid fraction greater than 0.8 is deemed that the bloom has been solidified. The ferro-static pressure of liquid metal directly affects the boundaries of the solidification front. Thermal stress caused by temperature drop and phase change mainly affects the heat transfer process. The mold is treated as a rigid surface.
Assuming that the solidified shell is elasto-plastic material, the rate representation of the total strain in elasto-plastic model [8] is given by
![]() (1)
(1)
The linear isotropic elastic response is described by
![]() (2)
(2)
where E is the elastic modulus, and ��e, ��P, ��T are the elastic strain rate, the plastic strain rate and the thermal strain rate, respectively.
The effective stress is given by
![]() (3)
(3)
where the stress components which are in the square root correspond to the principal stresses.
A generalized von Mises yield function, ![]() is used in the numerical computations, where s is deviatoric stress, x is the back stress which controls the kinematic hardening and k characterizes isotropic hardening.
is used in the numerical computations, where s is deviatoric stress, x is the back stress which controls the kinematic hardening and k characterizes isotropic hardening.
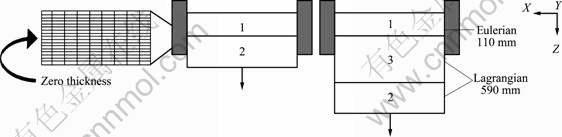
Fig. 1 Schematics of MiLE method
The assumed plastic flow rule has the form of ![]() where �� is the plastic multiplier to be determined with the aid of the consistency condition, f = 0.
where �� is the plastic multiplier to be determined with the aid of the consistency condition, f = 0.
Both isotropic and kinematic hardening rules are available. For isotropic hardening, the rule can be chosen as
![]() (4)
(4)
where Y0 is the yield stress and H is the plastic modulus.
The effective plastic strain is given by
![]() (5)
(5)
The isotropic hardening rule can also have the form of
![]() (6)
(6)
where Y�� is the ultimate stress and a is a material parameter.
For kinematic hardening, the Armstrong-Frederick model is adopted:
![]() (7)
(7)
where c and b are material parameters.
The criteria of cracks are as follows: In the brittle temperature range defined as the temperature range between the zero ductility temperature (ZDT) and the liquid impenetrable temperature (LIT) [9], the cracks due to hot tearing in the mushy zone may occur when the strand is under tension. In order to predict the cracks in the strand, the crack susceptibility coefficient, Sc, is defined as follows [10]:
 (8)
(8)
where Tfs is the solid fraction which corresponds to the LIT, YM is the analyzed maximum principal stress and Yc is the critical yield strength for the cracking.
2.5 Mold/bloom heat transfer
The heat transfer between the bloom and the mold, and the change of shell thickness are primarily controlled by the flux filling the gap and the interfacial contact resistance.
2.5.1 Mold flux break temperature
Recently, FOX [11] showed that the break temperature or the melting temperature, Tb, of the mold flux can be expressed as a function of mold flux viscosity:
![]() (9)
(9)
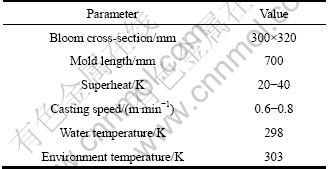
The geometry of the bloom is listed in Table 1.
Table 1 Main parameters of continuous casting process
2.5.2 Bloom/mold interfacial heat transfer
The heat transfer between the bloom and the mold occurs via both conduction and radiation. The thermal resistance between the bloom and the cooling water in the mold can be represented as an equivalent electric circuit, as shown in Fig. 2. Radiation across the crystalline flux layer is ignored due to the high extinction coefficient [12]. The contact resistance between the shell and the liquid flux layer is ignored because it is much lower compared with any other single component in the system.
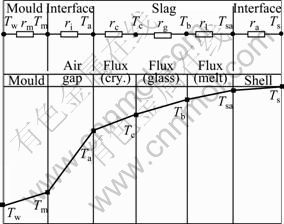
Fig. 2 Schematic diagram of temperature distribution and resistances to heat transfer across mold flux film
The net heat flux from bloom to mold surface can be written as
![]() (10)
(10)
where ra, rl, rg, rc and ri are the thermal resistances of the air gap, liquid, glass and crystalline mold flux layers, and the solid flux/mold interfacial resistance, respectively; Ts is the bloom surface temperature and Tm is the mold hot face temperature.
The total resistance in the mold including the convection in the water channel can be written as
![]() (11)
(11)
where dm is the mold thickness, km is the mold thermal conductivity and hw is the water heat transfer coefficient.
The thermal resistances, r, in Eq. (10) are defined in terms of conduction and radiation components across the different layers [13].
1) The thermal resistances across liquid flux (l)
![]() (12)
(12)
 (13)
(13)
![]() (14)
(14)
2) The thermal resistances across glassy flux (g)
![]() (15)
(15)
 (16)
(16)
![]() (17)
(17)
3) The thermal resistances across crystalline flux (c)
![]() (18)
(18)
4) The thermal resistances across air gap (a)
![]() (19)
(19)
![]() (20)
(20)
![]() (21)
(21)
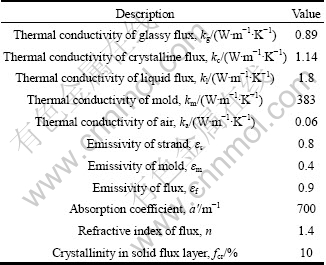
where Tc is the crystalline/glass interface temperature, Tsa is the air gap/glass interface temperature, �� is the Stefan�CBoltzmann constant, a�� is the absorption coefficient, n is the refractive index and �� is the emissivity. The thermophysical properties of the mold flux used in this investigation are given in Table 2.
Table 2 Thermophysical properties of flux [13]
Assuming a crystalline fraction of fcr, the total mold flux gap can be written as
![]() (22)
(22)
where di is the interfacial gap thickness at mold/solid flux interface, dc is the solid crystalline flux thickness, dg is the solid glass flux thickness, dl is the liquid flux thickness and da is the air gap thickness between the solidified flux and strand in the absence of liquid flux. As the heat flux across the various flux layers is the same, they can be written as
![]() (23)
(23)
![]() (24)
(24)
![]() (25)
(25)
![]() (26)
(26)
![]() (27)
(27)
The resulting set of non-linear Eqs. (23)-(27) is solved using Matlab software to obtain Tc, Ta, dc and dl for the input flux gap size, dt, and shell temperature, Ts. The initial mold temperature (Tm) is 450 K. The total mold/strand gap size (dt) at the meniscus is taken as 0.5 mm following the methodology of YAMAUCHI et al [14]. The solid flux/mold interfacial resistance is expressed as ri=16.4dc for medium carbon steel based on the research of CHO et al [1].
The converged thermal resistances can then be used to calculate the net heat transfer coefficient between the shell and the cooling water given as
 (28)
(28)
3 Model validation
Model prediction of shell thickness and bloom surface temperature at mold exit are compared with the measured data. Figure 3 shows that the predicted shell thicknesses are in good agreement with the measured data. The measured temperature at mold exit is about 1 376 K, and the predicted temperature is about 1 361 K, which provides confidence in model. The relationship between the solidification time and the shell thickness is regressed as
![]() (29)
(29)
where dshell is shell thickness (mm) and t is solidification time (min).
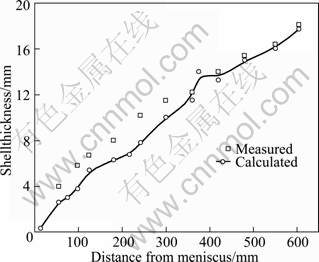
Fig. 3 Comparison of measured and predicted shell thickness
When the continuous casting becomes a major method of industrial production of steel, the shell thickness has the expression of ![]() [15-21] rather than
[15-21] rather than![]() . The gradient k is solidification coefficient in the range of 18.4-38.0 mm/min0.5. The x-axis intercepts are about 0.1 in square root of solidification time. The y-axis intercepts are from -8.6 to -0.86 in which the negative values suggest that there is a delaying period at the beginning of solidification. The relationship between shell thickness and solidification time in this work is shown in Fig. 4(a), compared with those in literatures [15-21]. The k value is 19.62 in this work which is within the range of previous data. The delaying period at the beginning of solidification also agrees with the previous data which is about 0.1 in square root of solidification time. So, the shell thickness calculated in this work is considered to be reasonable.
. The gradient k is solidification coefficient in the range of 18.4-38.0 mm/min0.5. The x-axis intercepts are about 0.1 in square root of solidification time. The y-axis intercepts are from -8.6 to -0.86 in which the negative values suggest that there is a delaying period at the beginning of solidification. The relationship between shell thickness and solidification time in this work is shown in Fig. 4(a), compared with those in literatures [15-21]. The k value is 19.62 in this work which is within the range of previous data. The delaying period at the beginning of solidification also agrees with the previous data which is about 0.1 in square root of solidification time. So, the shell thickness calculated in this work is considered to be reasonable.
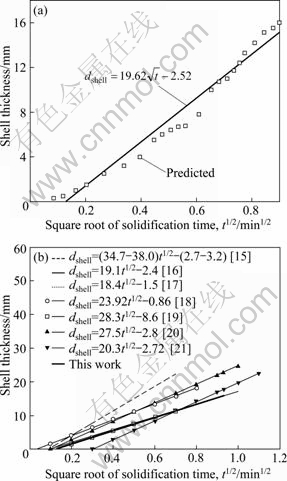
Fig. 4 Relationship between shell thickness and solidification time: (a) In this work; (b) Compared with previous data in literatures
4 Simulation results and discussion
Figure 5 shows the simulation process in the mold of steel YF45MnV based on the MiLE method. In mathematical terms, because of perfect symmetry, one fourth of the bloom cross section is used to display. The MiLE method working principle that the bloom grows downwards gradually as the casting proceeds is in agreement with the actual continuous casting process. The bloom surface temperature decreases gradually from 11.2 s to 51.7 s, and the temperature keeps continuity across the accordion. From the effective stress distribution at mold exit in Fig. 5, the effective stress in the corner is much larger than that in the mid-face. The formation of bloom cracks is related to the material mechanical properties and metallurgical characteristics. The research results show that the ductility begins to decrease until the zero ductility in the vicinity of the melting temperature at more than 1 200 ��C [22]. The high-temperature brittleness is the important reason to cause bloom cracks. In the range of high-temperature brittleness, when the stress or strain that material suffers exceeds a certain critical value, it will cause cracks. So, the corner area is the dangerous zone of cracking.

Fig. 5 Simulation of continuous casting process in mold of steel YF45MnV based on MiLE method
Figure 6 shows the bloom surface temperature, heat flux, thermal resistance, liquid flux thickness and air gap changing with distance from meniscus. The bloom surface temperature and heat flux decrease gradually as the casting proceeds (Fig. 6(a)). At the bloom mid-face area, as the bloom surface temperature is higher than the mold flux break temperature, the liquid steel or partially solidifying shell is in good contact with mold wall through the mold flux, and the heat flux to the mold is larger. The heat transfer to the mold mainly depends on the contact heat transfer coefficient between the strand and the mold wall, which is strongly dependent on the surface temperature of the strand. But in the bloom corner area, the liquid steel or partially solidifying shell is in good contact with mold wall through the mold flux at the beginning. Later, as the solidification of the strand proceeds further, the bloom surface temperature at about 215 mm below the meniscus is lower than the mold flux break temperature, the liquid flux is completely solidified, the surface grid of the strand is fully solidified and the strand shrinks. Then, the solidifying shell is detached from the mold wall due to the formation of air gap, and the heat flux to the mold decreases. The air gap grows lager with the casting proceeds (Fig. 6(c)). There is a high thermal resistance (Fig. 6(b)), making the heat transfer difficult, so it is necessary to compensate the gap with a mold taper. Due to the ferrostatic pressure of molten steel, the mold taper will compensate a part of air gap.
5 Effect of mold flux break temperature
The model is used to investigate the effects of varying mold flux break temperatures on the air gap and hot tearing indicator.
Mold flux plays a very important role as a lubricant between a solidified shell and a mold wall in a continuous casting process. Specifically, the molten flux film forming between the solid shell and the solidified mold flux performs the major lubricating function. In the upper mold, the liquid flux will flow into and fill the gap formed by shell shrinkage. However, in the lower mold, if the shell temperature is lower than the break temperature of the flux, there will be no liquid available to fill the gap and hence an air gap may form. This air gap becomes the dominant thermal resistance and the effect of mold flux/mold interfacial resistance is diminished. The effects of break temperature (Tb) on the liquid mold flux thickness and the resulting heat flux between the bloom and the mold are investigated.
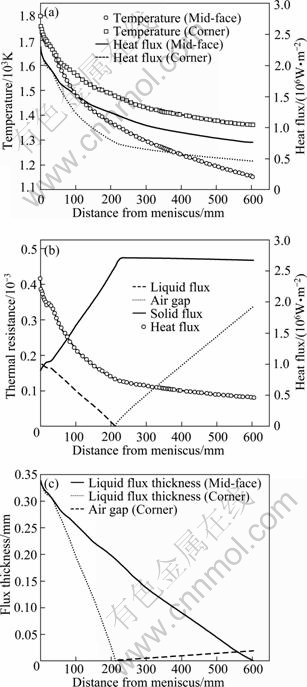
Fig. 6 Bloom surface temperature and heat flux at mid-face/ corner (a), thermal resistance in corner area (b) and liquid flux thickness and air gap (c) changing with distance from meniscus
Figure 7 shows the bloom surface temperature, heat flux, liquid flux thickness and air gap for varying mold flux break temperature with distance from meniscus. The bloom surface temperature increases with the increase of the break temperature, but the heat flux decreases with the increase of the break temperature. Decreasing the break temperature delays the solidification of the mold flux and results in a thicker liquid flux layer and a thinner solid flux layer, and it also delays the air gap formation. From Fig. 7(c), it is obvious that the air gap forms at about 175 mm below the meniscus when the break temperature is 1 410 K, and it forms at about 260 mm below the meniscus when the break temperature is 1 320 K. Since the liquid mold flux has a high thermal conductivity, increased heat transfer is resulted from a lower break temperature.
Figure 8 shows hot tearing indicator changing with the mold flux break temperature. The hot tearing indicator decreases with increasing the break temperature. A mold flux with a high break temperature has been reported to help to reduce the cracking susceptibility of medium carbon steels owing to decreased heat transfer. A lower break temperature is helpful for improving the quality of bloom surface. BILLANY et al [23] found that star cracking decreased as the relative length of mold undergoing liquid lubrication approached unity. So, it is important to use a suitable mold flux break temperature for different steel grades.

Fig. 7 Bloom surface temperature (a), heat flux (b) and flux thickness (c) for varying mold flux break temperature with distance from meniscus
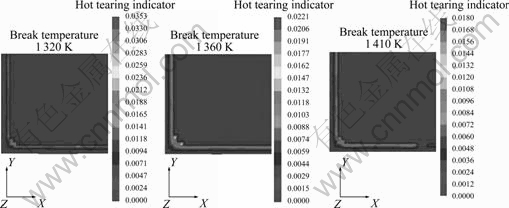
Fig. 8 Hot tearing indicator changing with mold flux break temperature
6 Conclusions
1) The relationship between shell thickness and solidification time calculated is in agreement with the data in literatures, and is expressed as dshell= ![]() .
.
2) The bloom surface temperature decreases gradually from 11.2 s to 51.7 s, and the temperature keeps continuity across the accordion. The effective stress in the corner is much larger than that in the mid-face. The corner area is the dangerous zone of cracking.
3) The liquid steel or partially solidifying shell is in good contact with mold wall through the mould flux at the beginning. Later, as the solidification of the strand proceeds further, the bloom surface temperature is lower than the mold flux break temperature, the liquid flux is completely solidified, the air gap forms due to the strand shrinks and the heat flux to the mold decreases. The air gap grows lager as the casting proceeds, which has a high thermal resistance, making the heat transfer difficult. So, it is necessary to compensate the gap with mold taper.
4) The bloom surface temperature increases with the increase of the mold flux break temperature, but the heat flux decreases with the increase of the mold flux break temperature. Decreasing the break temperature delays the solidification of the mold flux and results in a thicker liquid flux layer and a thinner solid flux layer, and it also delays the air gap formation. The hot tearing indicator is much smaller when the mold flux break temperature is higher.
References
[1] CHO J, SHIBATA H, EMI T. The resistance at interface between mold flux film and mold in continuous casting steels [J]. ISIJ International, 1998, 38(5): 440-446.
[2] MILLS K C, FOX A B. The role of mould fluxes in continuous casting-so simple yet so complex [J]. ISIJ International, 2003, 43(10): 1479-1486.
[3] HWANG J D, LIN H J, HWANG W S. Numerical simulation of metal flow and heat transfer during twin roll strip casting [J]. ISIJ International, 1995, 35(2): 170-177.
[4] LI Chun-sheng, THOMAS B G. Thermo-mechanical finite-element model of shell behavior in continuous casting of steel [J]. Metallurgical and Material Transactions B, 2004, 35(6): 1151-1172.
[5] GUPTA D, LAHIRI A K. A water model study of the flow asymmetry inside a continuous casting mold [J]. Metallurgical and Material Transactions B, 1996, 27 (5): 757-764.
[6] THOMAS B G, MIKA L M, NAJJAR F M. Simulation of fluid flow inside a continuous slab casting machine [J]. Metallurgical and Material Transactions B, 1990, 21 (3): 387-400.
[7] SAMONDS M T, WAITE D M. ProCAST user manual & technical reference [M]. 2007: 625-627.
[8] SAMONDS M, ZHU J Z. Coupled thermal-fluids-stress analysis of casting [R]. UES Software Inc, Annapolis, MD, USA.
[9] KIM K, HAN H N, YEO T. Analysis of surface and internal cracks in continuously cast beam blank [J]. Ironmaking Steelmaking, 1997, 24(3): 249-256.
[10] THOMAS B G, SAMARASEHERA I V, BRIMACOMBE J K. Investigation of panel crack formation in steel ingots. Part II: Off-corner panel cracks [J]. Metallurgical and Material Transactions B, 1988, 19(2): 277-287.
[11] FOX A B. Mould fluxes, their properties and performance [D]. London: Imperial College, 2003.
[12] SHIBATA H, CHO J, EMI T, SUZUKI M. Structural aspects of slags [C]// Proc of the 5th Inter Conf on Molten Slags, Fluxes and Salts. Warrendale, PA, ISS, 1997: 771-779.
[13] SARASWAT R, MAIJER D M, LEE P D. The effect of mold flux properties on thermomechanical behavior during billet continuous casting [J]. ISIJ International, 2007, 47(1): 95-104.
[14] YAMAUCHI A, EMI T, SEETHARAMAN S. A mathematic mold for prediction of thickness of mold flux film in continuous casting mold [J]. ISIJ International, 2002, 42(10): 1084-1093.
[15] SUZUKI A, SUZUKI T, MITSUSHIMA S. Determination of the solidification condition in continuous casting process [J]. Tetsu-to- Hagan��, 1970, 56(11): s427-s431.
[16] NAGAOKA N, IWAMOTO K, USUI G. Shell thickness in continuous casting process [J]. Tetsuto-Hagan��, 1969, 55(3): s109-s112.
[17] OKANO S, NISHIMURA T, OOI H. Relation between large inclusions and growth directions of columnar dendrites in continuously cast slabs [J]. Tetsu-to-Hagan��, 1975, 61(14): 2982-2989.
[18] MORI T, AYATA K, FUJIMAKI M. The solidification behavior in continuous casting process [J]. Tetsuto-Hagan��, 1976, 62 (4): S132.
[19] FUJII H, OHASHI T. The effect of solidification behavior on melt flow in continuous casting process [J]. Tetsu-to-Hagan��, 1978, 64 (11): S646.
[20] NARITA K, MORI T, AYATA K. Determination of the temperature distribution in continuous casting process [J]. Tetsu-to-Hagan��, 1978, 64 (11): S659.
[21] SUZUKI M, MIYAHARA S, KITAGAWA T. Effect of mold oscillation curves on heat transfer and lubrication behavior in mold at high speed continuous casting of steel slabs [J]. Tetsu-to-Hagan��, 1992, 78(1): 113-121.
[22] WANG Zhe, SHEN Hou-fa. Finite element analysis of shell growth in a continuous casting mold [J]. J T Sing Univ (Sci & Tech), 2004, 44(11): 356-361. (in Chinese)
[23] BILLANY T J H, MILLS K C, NORMANTON A S. Surface cracking in continuously casting products [J]. Ironmaking Steelmaking, 1991, 18(6): 403-410.
(Edited by YANG Bing)
Foundation item: Project(51174020) supported by the National Natural Science Foundation of China
Received date: 2011-06-08; Accepted date: 2012-04-10
Corresponding author: XIA Yun-jin, PhD; Tel: +86-10-62332872; E-mail: xyjsssss@yahoo.com.cn
Abstract: A new method called mixed Lagrangian and Eulerian method (MiLE method) was used to simulate the thermomechanical behavior during continuous casting process of steel YF45MnV. The simulation results are basically in agreement with the measured data. The delaying period at the beginning of solidification is about 0.1 in square root of solidification time which is agreement with the data in literatures, and shell thickness increases in linear relation to square root of solidification time. The bloom surface temperature decreases gradually as the casting proceeds. The effective stress in the corner is much larger than that in the mid-face. The corner area is the dangerous zone of cracking. The effects of mold flux break temperature on the air gap and hot tearing indicator were also modeled. The model predicts that the bloom surface temperature increases with the increase of the mold flux break temperature, but the heat flux decreases with the increase of the mold flux break temperature. The hot tearing indicator is much smaller when the mold flux break temperature is higher.
