
Trans. Nonferrous Met. Soc. China 24(2014) 393-400
Preparation and characterization of Ce1-xDyx-ySryO2-�� system
S. RAMESH1, K. C. JAMES RAJU1, C. VISHNUVARDHAN REDDY2
1. School of Physics, University of Hyderabad, Hyderabad 500046, India;
2. Department of Physics, Osmania University, Hyderabad 500007, India
Received 2 May 2013; accepted 29 October 2013
Abstract:
The effect of dysprosium and strontium on the total ionic conductivity of ceria in the system Ce1-xDyx-ySryO2-�� was studied. In this system, few compositions were prepared with x=0.15, y=0.015, 0.03 and 0.045 by modified sol-gel process using maltose and pectin as organic precursors. Rietveld refinement of XRD patterns confirms the cubic structure with space group  . SEM images show relatively uniform grains with clean and distinct grain boundaries. Four probe AC impedance measurements were carried out to evaluate the total ionic conductivity in the temperature range of 150-500 ��C and frequency range of 40 Hz-1 MHz. The composition Ce0.85Dy0.12Sr0.03O2-�� shows higher electrical conductivity than single-doped ceria samples.
Key words:
electrolyte; Sr-Dy doping; impedance spectroscopy; conductivity;
1 Introduction
Ceria (CeO2) doped with rare earth and alkaline earth materials has a number of applications such as automobile exhaust catalysts as oxygen storage, oxygen sensors, and electrolyte in solid oxide fuel cell (SOFC). SOFCs are known for their ability to provide clean, green and high efficiency energy conversion [1-3]. However, major constraint is the selection of materials for commercial SOFC due to high operating temperature (800-1000 ��C with yttrium stabilized zirconia electrolyte). Performance of SOFC depends on electrolyte materials [4].
A SOFC electrolyte material should have high ionic conductivity, high chemical stability and high density, etc. The ionic conductivity of electrolyte material depends on ionic radii of dopants and their concentration. If the dopant ionic radius is close to that of host (ceria), then small (or negligible) strain is induced in the crystal lattice consequently ionic conductivity increases. On the other hand, if there is mismatch between host and dopant radii, then large strain is induced in the lattice, resulting in decrease in ionic conductivity. It has been noticed that dopant ionic radius should close that of host, to minimize the activation energy of the ionic conduction [5]. To optimize the ionic conductivity, suitable dopants have been selected based on these critical factors.
Basically, pure ceria is a poor ionic conductor (�ҡ� 1��10-5 S/cm at 600 ��C) [6]. CeO2 (ceria) has cubic fluorite structure with  space group. The doping of trivalent or divalent oxides into ceria creates oxygen vacancies, which are responsible for the ionic conduction in these oxides [1,5]. Oxygen vacancies depend on the nature and amount of dopant [7,8]. In cerium oxide (CeO2), oxide vacancies
  may be introduced by ceria reduction or by doping with oxides of metals with lower valences. These equations are written in
  notation.
 (1)
(1)
 (2)
(2)
Doped ceria fluorites showed significant improvements in the ionic conductivity and can be considered promising electrolyte for SOFCs, which were operated ��750 ��C [1,4,5,9,10]. Ceria doped with heterovalent cations such as alkaline earth and rare earth ions shows higher ionic conductivity than single-doped ceria [9-15]. Dopants Sm and Gd improved the ionic conductivity of pure ceria significantly due to the minimum association enthalpy between oxygen vacancies and cations. Besides, dysprosium-doped ceria also showed similar order of ionic conductivity to Sm- or Gd-doped ceria.
SOFC components made up of nanopowders have advantages like an electrolyte component, which may exhibit a finer grain structure and therefore a higher density of grain boundaries. Nanoparticles are active to heat transfer and have a higher rate of densification at a lower sintering temperature as a result of a high surface area. These features may increase the oxygen ion mobility and therefore the ionic conductivity reducing ohmic losses in an electrochemical cell.
In the present study, an attempt has been made to prepare nano-crystalline Py- and Sr-doped ceria by a modified sol-gel process first proposed by SUCIUA et al [16]. Aim of the present work is to study the effect of Dy and Sr co-dopants on density, structure and total conductivity of ceria.
2 Experimental
CexDyx-ySryO2-�� (x=0.15; y=0.015, 0.03 and 0.045) compositions were synthesized through modified sol-gel process using maltose and pectin as organic precursors. The compositions were named as SrDDC1 (Ce0.85Dy0.135Sr0.015O2-��), SrDDC2 (Ce0.85Dy0.12Sr0.03O2-��) and SrDDC3 (Ce0.85Dy0.105Sr0.045O2-��). Cerium nitrate hexa hydrate, (Alfa acer, 99.8% purity), dysprosium penta hydrate (Alfa acer, 99.8% purity) and strontium nitrate (Alfa acer, 99.8% purity) were used as starting materials. Dysprosium, strontium and cerium nitrates were calculated and weighed accurately. Commercial grade maltose and pectin, Finar made, were used for gel preparation and mixed in mass ratio of maltose to pectin of 50:1. Maltose made from glucose and fructose units, also is known as ordinary table sugar. Pectin is present in ripe fruits and some vegetables. Pectin is widely used in food industry as gelating agent. Pectin consists of 300 and 1000 monosaccharide units [16].
Maltose and pectin in the mass ratio of 50:1 were mixed with distilled water in beaker until clear solution formation and labelled as a solution A. Cerium, strontium and dysprosium nitrates were dissolved in distilled water, stirred properly to get clear solution and labelled as solution B. The cationic concentration of solution B was controlled to be 20 g/L of the final CexDyx-ySryO2-�� composition. Solutions A and B were mixed by dripping solution A into solution B under continuous stirring for 2 h. The aim of this treatment was to prevent agglomeration of the constituent particles and to avoid solidification of the particles or raw granular formation during the different stages of processing. The homogeneous mixed solution was dried in a beaker at 80 ��C on magnetic stirrer warm plate at constant stirring until the gel formation. The obtained gel was placed in a separate beaker and dried on warm plate at 90 ��C for more than 20 h until it became completely gelatinized and light yellow powders.
Further, powders were calcined at 500 ��C for 2 h. The resultant ash was ground in agate mortar to get a fine homogeneous powder. The calcined powders were ground into fine powders and uniaxially pressed into circular pellets (10 mm in diameter and 1 mm in thickness) without any binder using hydraulic press by applying a pressure of 5 MPa. The pellets were sintered in air at 1200 ��C for 5 h. Archimedes method was employed to measure sintered pellets density in water. Experimental densities of sintered pellets were found to be more than 95% of the theoretical density. XRD patterns of the samples were obtained by BRUKER D8 ADVANCED using Cu K�� radiation in the Bragg��s angle range of 20���2�ȡ�80�� at room temperature. Fullprof Rietveld refinement software was used to calculate the lattice constant to analyze structure. The sintered pellets were polished, thermally etched and gold coated for microstructure analysis using a scanning electron microscope ZEISS (FE-SEM) equipped with an energy dispersive X-ray spectrometer (EDX) analyzer.
Sintered pellets were polished on both sides and silver paste was brushed for electrode purpose to measure electrical properties. Four-probe Agilent precision impedance analyzer (4294A) was used to record the AC impedance spectra of the samples with an applied voltage of 50 mV. The measurements were carried out in the temperature range of 150-500 ��C in frequency range from 40 Hz to 1 M Hz. Lab view software (version 8.5) was used to acquire the impedance data. Grain, grain boundary and total resistance were calculated by impedance spectra using ZSimpwin software.
3 Results and discussion
3.1 XRD analysis
Figure 1 shows the XRD patterns of Sr- and Dy- doped ceria. There are no extra peaks. This confirms the formation of single phase and it contains only a cubic [17] structure with the space group. Figure 2 shows the Rietveld refinement of SrDDC2 sample using cubic #225 space group. The Rietveld refinement was carried by program FULLPROF [18]. The Rietveld parameters are shown in Table 1. The angular dependence of the peak full width at half maximum (FWHM) was described by Caglioti��s formula. Peak shapes were described by the pseudo-Voigt profile function. The background variation was described by a polynomial with six coefficients. All atom positions are fixed by the symmetry of the space group and are not refined. Rare earth and alkaline earth cations are situated at the 4a site with the atomic coordinate(0 0 0) and oxygen is at the 8c site corresponding to the (1/4 1/4 1/4) position.

Fig. 1 XRD patterns of Sr-Dy co-doped ceria samples
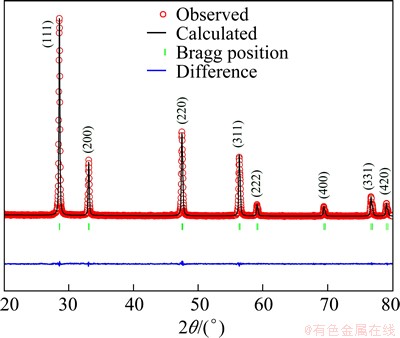
Fig. 2 Rietveld refinement of SrDDC2 sample
The introduction of Dy3+ and Sr2+ into Ce4+ can cause a small shift in the ceria peaks (Fig. 2). This indicates a change in the lattice parameter (Table 1). The change in the lattice parameters occurs due to the difference in ionic radii of Ce4+(0.967  ), Dy3+(1.053 ) and Sr2+(1.126 ) [19] in an oxide solid solution. Presence of oxygen vacancies due to aliovalent dopants also expands the lattice [20]. It is noticed from Fig. 3 that there is no difference in peak position between calcined and sintered samples except decrease in broadening (peak width) of peaks; they became relatively sharp and narrow. This indicates the grain growth at higher temperatures. Crystallite size, Dc, of the calcined powders was calculated from XRD line broadening (1 1 1) reflection using the Scherrer��s formula:
 (3)
(3)
where �� is the wavelength of X-ray radiation, �� is the full width at half maximum (FWHM) after correcting the instrumental broadening, and �� is the Bragg angle. The average sizes of crystallite for SrDDC1, SrDDC2 and SrDDC3 are in the range of 11-15 nm (Table 1). Particle size of calcined powder obtained from XRD is smaller than the average grain size from SEM image because grain growth occurs during the sintering.
Figure 4 shows the SEM images of all the compositions sintered at 1200 ��C for 5 h. It can be seen the presence of faceted grains. It is observed that the surface of the material shows high densification. Few closed pores are seen on the surface. These results are consistent with the relative density less than 100%. The line intercept method was used to calculate the average grain size. The average grain sizes of compositions SrDDC1, SrDDC2 and SrDDC3 are about 0.97, 0.75 and 1.2 ��m, respectively.
3.2 Impedance spectroscopy
Ionic conductivity of electrolyte materials was measured using AC impedance analysis. Information about grain, grain boundary and electrode polarization contributed to the total ionic conductivity can be obtained from impedance spectroscopy. Nyquist plots of SrDDC2 sample at different temperatures are shown in Fig. 5 and for all samples at 200 ��C are shown in Fig. 6. It is noticed from Fig. 5 that there are two circular arcs at 150 and 200 ��C in which one is depressed semi circle and the other one is semi circle. Here, high frequency depressed semi circle corresponds to grain resistance (Rg) and intermediate frequency semi circle corresponds to grain boundary resistance (Rgb). In this case, grain and grain boundary resistances were calculated from impedance spectra using an equivalent circuit (R-CPE)g(R-CPE)gb. The depressed arc corresponding to grains disappears completely above 250 ��C. In fact, grain contribution arc may see at high frequencies exceeding the equipment limit. In this case, an equivalent circuit Rg(R-CPE)gb was used to fit the impedance data. CPEg and CPEgb represent the constant phase elements of grain and grain boundaries respectively. It can be seen from Fig. 5 that at 300 ��C and above, an incomplete low frequency arc start appears corresponding to contribution of sample-electrode interface. It can be observed from Fig. 6 that the total resistance is the minimum for SrDDC2.
Table 1 Rietveld parameters of crystallographic information


Fig. 3 XRD patterns of SrDDC2 sample at different temperatures

Fig. 4 SEM images for SrDDC1 (a), SrDDC2 (b) and SrDDC3 (c) samples
3.3 Electrical conductivity
The total conductivity ��t is calculated from the grain resistance (Rg) and the grain boundary resistance (Rgb), taking into account thickness l and cross-sectional area A using following equations:
Rt=Rg+Rgb (4)
 (5)
(5)
Figures 7-9 show the Arrhenius plots for the grain conductivity. Grain boundary conductivity and total conductivity of Ce1-xDyx-ySryO2-�� system were measured at different temperatures in the temperature range of 150-500 ��C. It can be seen that the experimental data are fitted with straight line throughout the temperature range studied, indicating that the conductivity of these samples can be expressed in the form of Arrhenius relation.
 (6)
(6)
where Ea is activation energy for vacancy diffusion, k is the Boltzmann constant, and ��0 is pre-exponential factor. The activation energy for conduction is obtained by plotting the total ionic conductivity data in the Arrhenius relation for thermally activated conduction. It was calculated using Eq. (6).
Dy and Sr dopants in CeO2 produce oxygen vacancies according to Eqs. (1) and (2). Oxygen ions (O2-) diffuse through the oxygen vacancies created through Eqs. (1) and (2). The increase in oxygen vacancies contributes to increase in ionic conductivity.
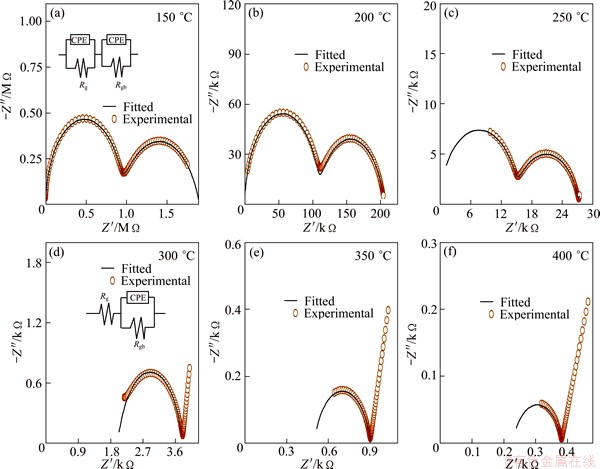
Fig. 5 Nyquist plots of SrDDC2 sample (Insets are equivalent circuit)
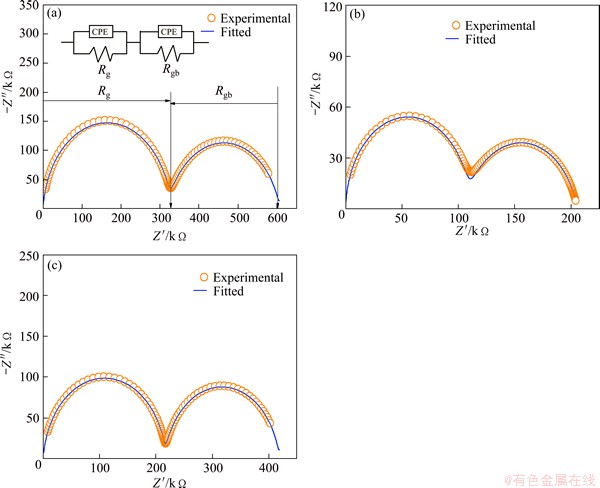
Fig. 6 Nyquist plots of SrDDC3 (a), SrDDC2 (b), and SrDDC1 (c) samples at 200 ��C (Inset shows equivalent circuit)
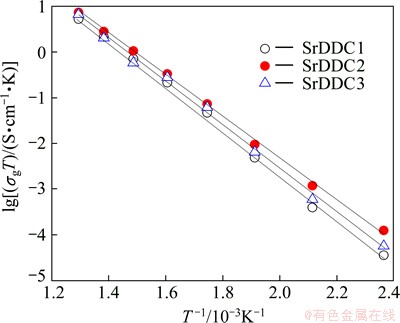
Fig. 7 Arrhenius plots of grain conductivity as function of temperature
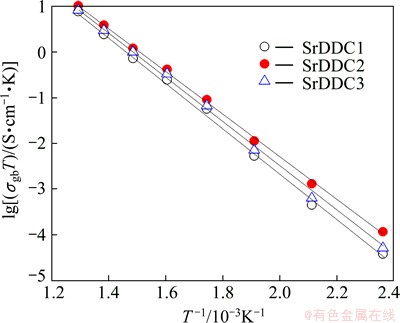
Fig. 8 Arrhenius plots of grain boundary conductivity as function of temperature

Fig. 9 Arrhenius plots of total conductivity as function of temperature
Table 2 shows the activation energy of grain, grain boundary and total conductivity for Ce1-xDyx-ySryO2-�� system. It can be observed that the activation energies for the samples change with Sr and Dy concentrations down to a minimum at y=0.03 and these results are in accordance with linear fitting shown in Figs. 7-9. The influence of the grain boundary conductivity on the total conductivity can be evaluated through blocking factor (��R) [21,22]:
 (7)
(7)
This factor gives the fraction of the electric carriers being blocked on the impermeable internal surfaces, under the measuring conditions, with respect to the total number of electric carriers in the sample. The lowest blocking factor was observed in SrDDC2 sample (0.37 at 350 ��C). It is assumed that the observed blocking effect in stabilized ceria results directly from the formation of blocked zones, where electric carriers aretrapped and do not contribute to the transport of electric current. It is very clear that strontium is an effective scavenger of grain boundary and the addition of strontium promotes the grain boundary conduction, consequently total conduction in DDC (Dy doped ceria).
Table 2 Activation energy of grain (Eg), grain boundary (Egb) and total conductivity (Et) of all samples

Further, from Fig. 9, it is noticed that the total ionic conductivity of Ce1-xDyx-ySryO2-�� increases up to dopant concentration of y=0.03. The co-dopants Sr2+ and Dy3+ would create oxygen vacancies in ceria lattice and minimize the interactions between oxygen vacancies and metal ions result in increase in total ionic conductivity with a minimum activation energy. After that the total ionic conductivity decreases with an increase in dopant concentration, which is related to the formation of defect interactions between metal ions and oxygen vacancies and also formation of local defect structures, which lowers the mobile oxygen vacancy [5].
Sr dopant addition improves the conductivity of Dy- doped ceria. The composition SrDDC2 shows the highest conductivity. The increase in ionic conductivity by strontium addition in DDC (Ce1-xDyxO2-��) might be due to increase in oxygen vacancies, with strontium acting as grain boundary scavenger, in addition to oxygen vacancy radius and decrease in average binding energy [23]. The grain, grain boundary and total conductivity are presented in Table 3. SrDDC2 composition is compared with reported results in Table 4 [24-28]. It can be seen that, the present test sample is compared well and exhibits higher conductivity value. Further, the composition SrDDC2 shows improved conductivity value compared with that reported in previous publications [29-31]. These results show the efficiency of the modified sol-gel process with low sintering temperature for Sr and Dy co-doped ceria ceramics as candidates to be used as electrolytes in IT-SOFC applications.
Table 3 Grain conductivity ��g, grain boundary conductivity ��gb, and total conductivity ��t of Sr-Dy co-doped ceria samples at 500 ��C
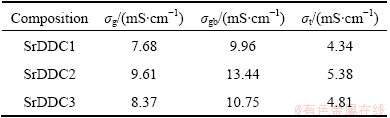
Table 4 Comparison of grain ��g, grain boundary ��gb and total ionic conductivity ��t of Sr-Dy doped ceria samples at 500 ��C

4 Conclusions
Maltose and pectin assisted sol-gel derived nano- crystalline co-doped ceria samples were successfully synthesized. All test samples are found to be cubic structure with single phase. The average crystallite sizes of calcined powders are in the range of 11-15 nm. High dense co-doped ceria oxide ceramics were prepared at lower sintering temperatures (��1200 ��C). The co-dopants Dy and Sr would create oxygen vacancies in the ceria lattice, which contribute to total ionic conductivity. The composition Ce0.85Dy0.12Sr0.03O2-�� could exhibit the maximum conductivity (5.38��10-3 S/cm at 500 ��C) with less activation energy (0.907 eV) in the intermediate temperature range. Thus, the present test sample electrolyte can be useful for IT-SOFCs.
Acknowledgements
Authors greatly acknowledge the UGC for providing financial assistance under DSKPDF, BSR project No. F.4-2/2006(BSR)/13-389/2010 (BSR).
References
[1] INABA H, TAGAWA H. Ceria based solid electrolytes [J]. Solid State Ionics, 1996, 83(1-2): 1-16.
[2] ZHU B, YANG X T, XU J, ZHU Z G, JI S J, SUN M T, SUN J C. Innovative low temperature SOFCs and advanced materials [J]. J Power Sources, 2003, 118(1-2): 47-53.
[3] HUIJSMANS J P P, van BRKEL F P F. Intermediate temperature SOFC��Apromise for the 21st century [J]. J Power Sources, 1998, 71(1-2): 107-110.
[4] STEELE B C H. Appraisal of Ce1-yGdyO2-y/2 electrolytes for IT-SOFC operation at 500 ��C [J]. Solid State Ionics, 2000, 129(1-4): 95-110.
[5] MKILNER J A. Fast oxygen transport in acceptor doped oxides [J]. Solid State Ionics, 2000, 129(1-4): 13-23.
[6] PENG C, LIU Y N, ZHENG Y X. Nitrate�Ccitrate combustion synthesis and properties of Ce1-xCaxO2-x solid solutions [J]. Mater Chem Phys, 2003, 82(3): 509-514.
[7] MOGENSEN M, SAMMERS N M, TOMPSETT G A. Physical, chemical and electrochemical properties of pure and doped ceria [J]. Solid State Ionics, 2000, 129(1-4): 63-94.
[8] ISMAIL A, HOOPER J, GIORGI J B, WOO T K. A DFT+U study of defect association and oxygen migration in samarium-doped ceria [J]. Phys Chem Chem Phys, 2011, 13(13): 6116-6124.
[9] OMER S, WACHSMAN E D, NINO J C. Higher conductivity Sm3+ and Nd3+ co-doped ceria-based electrolyte materials [J]. Solid State Ionics, 2008, 178(37-38): 1890-1897.
[10] OMER S, WACHSMAN E D, NINO J C. A co-doping approach towards enhanced ionic conductivity in fluorite-based electrolytes [J]. Solid State Ionics, 2006, 177(35-36): 3199-3203.
[11] KIM N, KIM B H, LEE D. Effect of co-dopant addition on properties of gadolinia-doped ceria electrolyte [J]. J Power Sources, 2000, 90(2): 139-143.
[12] SHA X, LU Z, HUANG X, MIAO J, LIU Z, XIN X, ZHANG Y, SU W. Influence of the sintering temperature on electrical property of the Ce0.8Sm0.1Y0.1O1.9 electrolyte [J]. J Alloys Compd, 2007, 433(1-2): 274-278.
[13] WANG F Y, WAN B Z, CHENG S. Study on Gd3+ and Sm3+ co-doped ceria-based electrolytes [J]. J Solid State Electrochem, 2005, 9(3): 168-173.
[14] WANG F Y, CHEN S, WANG Q, YU S, CHENG S. Study on Gd and Mg co-doped ceria electrolyte for intermediate temperature solid oxide fuel cells [J]. Catal Today, 2004, 97(2-3): 189-194.
[15] ZHENG Y F, SHI Y, GU H T, CHEN H, GAO L, GUO L C. La and Ca co-doped ceria-based electrolyte materials for IT-SOFCs [J]. Mater Res Bull, 2009, 44(8): 1717-1721.
[16] SUCIUA C, GAGEAB L, HOFFMANNA A C, MOCEANB M. Sol�Cgel production of zirconia nanoparticles with a new organic precursor [J]. Chemical Engineering Science, 2006, 61(24): 7831-7835.
[17] OMER S, WACHSMAN E D, JACOB L J, NINO J C. Crystal structure�Cionic conductivity relationships in doped ceria systems [J]. J Am Ceram Soc, 2009, 92(11): 2674-2681.
[18] RODRIGUEZ-CARVAJAL J. Recent advances in magnetic structure determination by neutron powder diffraction [J]. J Physica B, 1993, 192(1-2): 55-69.
[19] SHANNON R D. Revised effective ionic radii and systematic studies of interatomic distances in halides and chalcogenides [J]. Acta Cryst A, 1976, 32(5): 751-767.
[20] CHEN L, FLEMING P, MORRIS V, HOLMES J D, MORRIS M A. Size-related lattice parameter changes and surface defects in ceria nanocrystals [J]. J Phys Chem C, 2010, 114(30): 12909-12919.
[21] GERHARDT R, NOWICK A S. Grain-boundary effect in ceria doped with trivalent cations: I Electrical measurements [J]. J Am Ceram Soc, 1986, 69(9): 641-646.
[22] VERKERK M J, MIDDLEHUIS B J, BURGGRAAF A J. Effect of grain boundaries on the conductivity of high-purity ZrO2-Y2O3 ceramics [J]. Solid State Ionics, 1982, 6(2): 159-170.
[23] YOSHIDA H, INAGAKI T, MIURA K, INABA M, OGUMI Z. Density functional theory calculation on the effect of local structure of doped ceria on ionic conductivity [J]. Solid State Ionics, 2003, 160(1-2): 109-116.
[24] SHEMILT J, WILLIAMS H M. Effects of composition and processing method on the low temperature conductivity of samaria- doped ceria electrolytes [J]. J Mater Sci Lett, 1999, 18(21): 1735-1737.
[25] WANG D Y, PARK D S, GRIFFITH J, NOWICK A S. Oxygen-ion conductivity and defect interactions in yttria-doped ceria [J]. Solid State Ionics, 1981, 2(2): 95-105.
[26] PARKASH O, SINGH N, SINGH K N, KUMAR D. Preparation and characterization of ceria co-doped with Ca and Mg [J]. Solid State Ionics, 2012, 212(29): 100-105.
[27] JAISWAL N, UPADHYAY S, KUMAR D, PARKASH O. Ionic conductivity investigation in lanthanum (La) and strontium (Sr) co-doped ceria system [J]. J Power Sources, 2013, 222 (1): 230-236.
[28] JAISWAL N, UPADHYAY S, KUMAR D, PARKASH O. Effect of strontium (Sr) doping on the conductivity of ceria [J]. J Power Sources, 2012, 202(15): 78-84.
[29] GAO Z, LIU X, BERGMAN B, ZHAO Z. Enhanced ionic conductivity of Ce0.8Sm0.2O2-�� by Sr addition [J]. J Power Sources, 2012, 208(15): 225-231.
[30] KUHARUANGRONG S. Ionic conductivity of Sm, Gd, Dy and Er-doped ceria [J]. J Power Sources, 2007, 171(2): 506-510.
[31] PRADO-GONGALA J, SCHMIDTS R, ESPINDOLA-CANUTOA J, RAMOS-ALVAREZA P, MORANA E. Increased ionic conductivity in microwave hydrothermally synthesized rare-earth doped ceria Ce1-xRExO2-(x/2) [J]. J Power Sources, 2012, 209(1): 163-171.
Ce1-xDyx-ySryO2-����������Ʊ������
S. RAMESH1, K. C. JAMES RAJU1, C. VISHNUVARDHAN REDDY2
1. School of Physics, University of Hyderabad, Hyderabad 500046, India;
2. Department of Physics, Osmania University, Hyderabad 500007, India
ժ Ҫ����Ce1-xDyx-ySryO2-����ϵ�У��о���Dy��Se�������ӵ絼�ʵ�Ӱ�졣�ڸ���ϵ�У�ʹ����ѿ�Ǻ�����Ϊ�л�ǰ���壬ͨ�������ܽ�-�������գ��� x=0.15��y=0.015��0.03��0.045�������£��Ʊ���ͬ��ֵĵ����塣����X����������Rietveld�����֤�˵�������пռ�Ⱥ�������ṹ����SEM����Կ����������Ծ��硢��Ծ��ȵľ�������150~500 ��C���¶ȷ�Χ��40 Hz~1 MHz��Ƶ�ʷ�Χ�ڣ�������̽�뽻���迹������������������ӵ絼�ʡ��뵥���ӵĶ���������Ʒ��ȣ�Ce0.85Dy0.12Sr0.03O2-�����и��ߵĵ絼�ʡ�
�ؼ��ʣ����Һ��Se-Dy���ӣ��迹�ף��絼��
(Edited by Xiang-qun LI)
Corresponding author: S. RAMESH; Tel: +91-92-90518509; Fax +91-40-23010227; E-mail: ramesh.ou1@gmail.com
DOI: 10.1016/S1003-6326(14)63074-0
Abstract: The effect of dysprosium and strontium on the total ionic conductivity of ceria in the system Ce1-xDyx-ySryO2-�� was studied. In this system, few compositions were prepared with x=0.15, y=0.015, 0.03 and 0.045 by modified sol-gel process using maltose and pectin as organic precursors. Rietveld refinement of XRD patterns confirms the cubic structure with space group . SEM images show relatively uniform grains with clean and distinct grain boundaries. Four probe AC impedance measurements were carried out to evaluate the total ionic conductivity in the temperature range of 150-500 ��C and frequency range of 40 Hz-1 MHz. The composition Ce0.85Dy0.12Sr0.03O2-�� shows higher electrical conductivity than single-doped ceria samples.
