

Establishing empirical relationships to predict grain size and tensile strength of
friction stir welded AA 6061-T6 aluminium alloy joints
S. RAJAKUMAR, C. MURALIDHARAN, V. BALASUBRAMANIAN
Department of Manufacturing Engineering, Annamalai University,Annamalainagar �C 608 002, Chidambaram, Tamil Nadu, India
Received 21 December 2009; accepted 23 March 2010
Abstract:
AA 6061-T6 aluminium alloy (Al-Mg-Si alloy) has gathered wide acceptance in the fabrication of light weight structures requiring a high specific strength and good corrosion resistance. Compared with the fusion welding processes that are routinely used for joining structural aluminium alloys, friction stir welding (FSW) process is an emerging solid state joining process in which the material welded does not melt and recast. Joint strength is influenced by the grain size and tensile strength of the weld nugget region. Hence, an attempt was made to develop empirical relationships to predict grain size and tensile strength of friction stir welded AA 6061-T6 aluminium alloy joints. The empirical relationships are developed by response surface methodology (RSM) incorporating FSW tool and process parameters. A linear regression relationship was also established between grain size and tensile strength of the weld nugget of FSW joints.
Key words:
AA 6061-T6 alloy; friction stir welding; analysis of variance; regression analysis; grain size; tensile strength;
1 Introduction
Heat treatable wrought aluminium-magnesium- silicon alloys conforming to AA 6061-T6 are of moderate strength and possess excellent welding characteristics over the high strength aluminium alloys[1]. Hence, alloys of this class are extensively employed in marine frames, pipelines, storage tanks and aircraft applications. Low distortion, high quality, lower residual stresses, fewer weld defects, and low cost joints are the main advantages of this method. The mechanical properties of the joints mainly depend on the welding parameters such as pin rotation speed, traverse speed and stirrer geometry. In order to increase the welding efficiency, mechanical properties of joints must be maximized and the defects must be minimized in the friction stir welding (FSW) process. Therefore, studying the mechanical properties and related significant factors would be effective to enhance the welding productivity and process reliability.
Recently, modeling the FSW process with different approaches is the main interest of many researchers. A series of investigations have been conducted on modeling the FSW process with different approaches. OKUYUCU et al[2] used the artificial neural networks (ANNs) for the calculation of the mechanical properties of welded Al plates using FSW method. It was found that the correlations between the measured and predicted values of tensile strength, hardness of heat-affected zone (HAZ), and hardness of weld metal were better than those of elongation and yield strength. FRIGAARD et al[3] developed a numerical three dimensional (3D) heat flow model for FSW of AA 6082-T6 and AA 7108-T79 aluminum alloys based on the method of finite differences. ZHANG et al[4] applied the finite element method (FEM) to model the 3D material flow in FSW. The results indicated that the distribution of the equivalent plastic strain correlates well with the distribution of the microstructure zones in the weld. FERSINI and PIRONDI[5] performed an FE analysis to predict the crack path and the stress intensity factor at the crack tip and the lifetime of base material using the AFgrow software. BUFFA et al[6] proposed two different analytic models to determine the average grain size in friction stir welded AA 6061-T6 aluminum alloy joints. They developed a 3D FEM model and the numerical analyses of the welding processes have been performed to verify their effectiveness. Same authors developed a linear regression model to predict local effects of strain, strain rate and temperature in FSW of AA 6082-T6 alloy[7].
Though extensive research has been performed to model this process, the reported research work on relating the process parameters and tool parameters to weld characteristics is very scanty. Moreover, no systematic study has been reported so far to correlate the process parameters and tool parameters with weld nugget microstructure and tensile strength. Hence, in this work, an attempt was made to develop empirical relationship to predict the grain size and tensile strength of weld nugget of friction stir welded AA 6061-T6 aluminium alloy joints using statistical tools such as design of experiments, analyses of variance and regression.
2 Scheme of investigation
2.1 Identifying important process parameters
From Refs.[7-11] and the previous work[12-13] done in our laboratory, the predominant factors that have greater influence on tensile strength of FSW process were identified. They are: 1) tool rotational speed, 2) welding (traverse) speed, 3) axial (downward) force, 4) shoulder diameter, 5) pin diameter and 6) tool hardness. These are the primary process and tool parameters contributing to the frictional heat generation and subsequently influencing the tensile properties of friction stir welded aluminium alloy joints.
2.2 Finding working limits of parameters
The chemical composition and mechanical properties of base metal are presented in Table 1 and 2, respectively. The microstructure of the base metal is displayed in Fig.1. Trial experiments were carried out using 5 mm-thick rolled plates of AA 6061-T6 aluminium alloy to find out the feasible working limits of FSW parameters. The working range of each parameter was decided by inspecting the macrostructure (cross section of weld) for any visible defects such as tunnel defect, pinhole, kissing bond, lazy S. From the above inspection, a few important observations were made and they are presented in Table 3. The chosen levels of important process parameters and tool parameters with their units
Table 1 Chemical composition of base metal (mass fraction, %)
![]()
Table 2 Mechanical properties of base metal
![]()

Fig.1 Microstructure of base metal
and notations are presented in Table 4.
2.3 Developing experimental design matrix
By considering all the above conditions, the feasible limits of the parameters were chosen in such a way that AA 6061-T6 aluminium alloy should be welded without defects. Central composite rotatable design of second order was found to be the most efficient tool in response surface methodology (RSM) to establish the mathematical relation of the response surface using the smallest possible number of experiments without losing its accuracy[14]. Due to wide range of factors, it was decided to use six factors, five levels, central composite design matrix to optimize the experimental conditions. Table 4 presents the ranges of factors considered and Table 5 shows the 52 sets of coded conditions used to form the design matrix. First 32 experimental conditions are derived from half-factorial experimental design matrix (25=32). All the variables at the intermediate (0) level constitute the center points while the combinations of each process variable at either its lowest (-2.378) or its highest (+2.378) with the other twelve variables of the intermediate levels constitute the start points. Thus, the 52 experimental conditions allowed the estimation of the linear, quadratic and two-way interactive effects of the variables on the tensile strength of welded joints. The method of designing such matrix is dealt elsewhere. For the convenience of recording and processing experimental data, upper and lower levels of the factors are coded as +2.378 and -2.378, respectively. The coded values of intermediate values can be calculated using the following expression[15-18]:
Xi=2[2X-(Xmax+Xmin)]/(Xmax-Xmin) (1)
where Xi is the required coded value of a variable X; X is any value of the variable from Xmin to Xmax; Xmin is the lower level of the variable; Xmax is the highest level of the variable.
2.4 Conducting experiments and recording responses
Rolled plates of medium strength aluminium
Table 3 Macrostructure observation results of AA 6061-T6 aluminium alloy

Table 4 Important FSW process parameters and their levels for AA 6061-T6 aluminium alloy
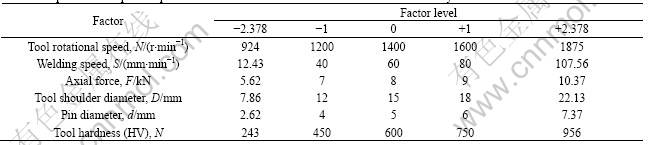
Table 5 Experimental design matrix and results

AA 6061-T6 alloy with 5 mm in thickness were cut to the required size (300 mm��150 mm) by power hacksaw cutting and milling. Square butt joint configuration (300 mm��300 mm) was prepared to fabricate FSW joints. The initial joint configuration was obtained by securing the plates in position using mechanical clamps. The direction of welding was normal to the rolling direction. Single pass welding procedure was followed to fabricate the joints. Non-consumable tools made of high carbon steel were used to fabricate the joints. The tool nomenclature is shown in Fig.2(a). Based on six factors, five level central composite designs, 15 tools were made with different pin diameters, shoulder diameters and tool hardnesses. Five levels of tool hardness were obtained by heat-treating high carbon steel in different quenching media (air, oil, water and furnace cooling). An indigenously designed and developed computer numerically controlled friction stir welding machine (22 kW, 4 000 r/min, 6 t) as shown in Figs.2(b) and (c) was used to fabricate the joints. As prescribed by the design matrix, 52 joints were fabricated and selected joints are displayed in Fig.2(d). The welded joints were sliced using a power hacksaw and then machined to the required dimensions to get tensile specimens. The tensile specimens were prepared as per the ASTM E8M-04 guidelines and the dimensions are shown in Fig.2(e). Tensile test was carried out in 100 kN, servo controlled universal testing machine. The specimen was loaded at the rate of 1.5 kN/min as per ASTM specifications, so that tensile specimens underwent uniform deformation. The specimen finally failed after necking and the load versus displacement was recorded.
Microstructural examination was carried out using a light optical microscope (VERSAMET-3) incorporated with an image analyzing software (Clemex-Vision). The specimens for metallographic examination were sectioned to the required size from the joint comprising weld metal and base metal regions and were polished using different grades of emery papers. Final polishing was done using the diamond compound (1 ��m in particle size) in the disc-polishing machine. Specimens were etched with Keller��s reagent to reveal the microstructure. Some micrographs of the weld nugget region are displayed in Fig.3. A vickers microhardness testing machine (Shimadzu HMV-2T) was employed for measuring the hardness of the weld nugget region with 0.49 N load. The average grain diameter of the weld nugget region was measured by applying Heyn��s line intercept method.
3 Developing empirical relationships
The grain size and tensile strength of the weld nugget of FSW joints are functions of rotational speed
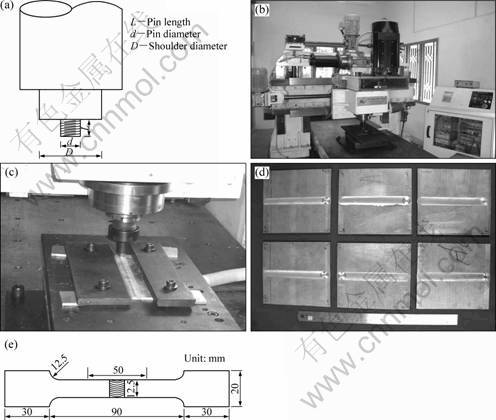 Fig.2 Experimental details: (a) Tool nomenclature; (b) FSW machine; (c) Close up view; (d) Fabricated joints (selected samples); (e) Dimensions of tensile specimen

Fig.3 Optical micrographs of weld nugget region: (a) Joint 3 (Gave=69.74 ��m); (b) Joint 6 (Gave=44.71 ��m); (c) Joint 7 (Gave=63.81 ��m); (d) Joint 9 (Gave=62.54 ��m); (e) Joint 10 (Gave=42.62 ��m); (f) Joint 15 (Gave=59.62 ��m); (g) Joint 18 (Gave=40.21 ��m); (h) Joint 20 (Gave=40.21 ��m); (i) Joint 21 (Gave=53.20 ��m); (j) Joint 26 (Gave=47.45 ��m); (k) Joint 27 (Gave=51.88 ��m); (l) Joint 33 (Gave=70.88 ��m); (m) Joint 39 (Gave=48.50 ��m); (n) Joint 44 (Gave=38.02 ��m); (o) Joint 45 (Gave=24.23 ��m)
(N), welding speed (S), axial force (F), shoulder diameter (D), pin diameter (d) and tool hardness (H), and it can be expressed as[15-17]:
Weld nugget grain size
G=f(N, S, F, D, d, H) (2)
Tensile strength
��b=f(N, S, F, D, d, H) (3)
The second order polynomial (regression) equation used to represent the response surface ��Y�� is given by[19]:
Y=b0+?bixi+?biixi2+?bijxixj +er (4)
and for 6 factors, the selected polynomial could be expressed as:
G or ��b=b0+b1(N)+b2(S)+b3(F)+b4(D)+b5(d)+
b6(H)+b11(N2)+b22(S2)+b33(F2)+b44(D2)+
b55(d2)+b66(H2)+b12(NS)+b13(NF)+b14(ND)+
b15(Nd)+b16(NH)+b23(SF)+b24(SD)+b25(Sd)+
b26(SH)+b34(FD)+b35(Fd)+b36(FH)+b45(Dd)+
b46(DH)+b56(dH) (5)
where b0 is the average of responses and b1, b2, ��, b66 are the coefficients that depend on respective main and interaction effects of the parameters. The values of the coefficients were calculated using the following expressions, and the calculated values are presented in Table 6.
Table 6 Calculated values of coefficients

b0=0.110 749(?y)-0.018 738?(Xiiy) (6)
bi=0.023 087?(Xiy) (7)
bii=0.015 2625?(Xiiy)+0.001 217??(Xiiy)-0.018 738(?y) (8)
bij=0.031 25?(Xijy)/n (9)
All the coefficients were tested for their significance at 95% confidence level applying Fisher��s F-test using Design expert statistical software package. After determining the significant coefficients, the final models were developed incorporating only these coefficients. The final empirical relationships to estimate grain size and tensile strength of weld nugget, developed by the above procedure, are given as follows.
Weld nugget grain size:
G=24.38-7.57N-3.49d+5.56N2+3.70S2+3.66F2+3.55D2+3.05d2+3.39H2 (10)
Tensile strength:
��b=220.41+12.1N+4.03d-9.58N2-4.90S2-4.81F2-4.54D2-4.01d2-5.07H2 (11)
3.1 Testing adequacy of developed empirical relationships
The adequacy of the developed empirical relationships was tested using the analysis of variance (ANOVA) technique[20]. As per this technique, if the calculated value of the F-ratio of the developed model is less than the standard F-ratio (from F-table) value at a desired level of confidence (say 95%), then the model is said to be adequate within the confidence limit. From the response of weld nugget grain size, the ��Model F-value�� of 9.86 implies that the model is significant. There is only a 0.01% chance that a ��Model F-value�� could occur due to noise. Values of ��Prob > F�� less than 0.050 0 indicate that model terms are significant. In this case, N, d, N2, S2, F2, D2, d2, H2 are significant model terms. Values greater than 0.100 0 indicate that the model terms are not significant. The ��Lack of Fit F-value�� of 968.90 implies the ��Lack of Fit�� is significant. There is only a 0.01% chance that a ��Lack of Fit F-value�� could occur due to noise. The ��Pred R-squared�� of 92.3% is in reasonable agreement with the ��Adj R-squared�� of 82.4%. Similarly, from the response of tensile strength, the ��Model F-value�� of 12.45 implies that the model is significant. There is only a 0.01% chance that a ��Model F-value�� could occur due to noise. Values of ��Prob > F�� less than 0.050 0 indicate that model terms are significant. In this case, N, d, N2, S2, F2, D2, d2 and H2 are significant model terms. Values greater than 0.100 0 indicate that the model terms are not significant. The ��Lack of Fit F-value�� of 69.11 implies that the ��Lack of Fit�� is not significant. There is only a 0.01% chance that a ��Lack of Fit F-value�� could occur due to noise. The ��Pred R-squared�� of 59% is in reasonable agreement with the ��Adj R-squared�� of 86%. Calculated value of the R-ratio of the developed relationships exceed the standard tabulated value of the R-ratio for a desired level of confidence (say 95%), then the relationship may be considered to be adequate within the confidence limit. ANOVA test results for both the responses are presented in Table 7. It can be understood that the developed relationships are adequate to predict the grain size and tensile strength of weld nugget of friction stir welded AA 6061-T6 aluminium alloy at 95% confidence level. Coefficient of determination (r2) is used to find how close the predicted and experimental values lie and it is calculated using the following expression[20]:
Table 7 ANOVA test results

r2=(Explained variation)/(Total variation) (12)
The value of r2 for the above-developed models is found to be 92% and 93% for grain size and tensile strength, respectively, which indicates high correlation between the experimental values and predicted values and this is further supported by correlation graphs shown in Fig.4.
3.2 Relationship between grain size and tensile strength of weld nugget
The weld nugget grain diameter and the tensile strength obtained from the experimental results are related, as shown in Fig.5. The experimental data points are fitted by a straight line. The straight line is governed by the following regression equation:
��b=252.4-1.339G (13)
The slope of the estimated regression equation (-1.339) is negative, implying that as grain size increases, the tensile strength decreases. The coefficient of determination is R2=98.8%, which can be interpreted as the percentage of the total sum of squares that can be explained by using the estimated regression equation. In other words, 98.8% of the variability in tensile strength can be explained by the linear relationship between the weld nugget grain size and tensile strength and it is presented in Table 8. The coefficient of determination R2 is a measure of the goodness of fit of the estimated regression equation[21-22]. The fitted regression line (Eq.(13)) may be used for two purposes: 1) estimating the mean value of tensile strength for the given value of Weld nugget grain diameter; and 2) predicting an
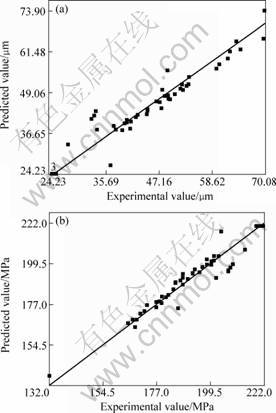
Fig.4 Correlation graphs for responses: (a) Weld nugget grain size; (b) Tensile strength

Fig.5 Relationship between weld tensile strength and weld nugget grain size
Table 8 Analysis of variance test result for linear regression model (Eq.(13))


The confidence interval (CI) and prediction interval (PI) show the precision of the regression results. Narrower intervals provide a higher degree of precision (Fig.5). Confidence interval is an interval estimate of the mean value of y for a given value of x. Prediction interval is an interval estimate of an individual value of y for a given value of x. The estimated regression equation provides a point estimate of the mean value of tensile strength for a given value of grain size. The difference between CI and PI reflects the fact that it is possible to estimate the mean value of tensile strength more precisely than an individual value. The greater width of the PI reflects the added variability introduced by predicting a value of the random variable as opposed to estimating a mean value. From Table 9, it is also inferred that the closer the value to ![]() (43.9 ��m), the narrower the interval will be.
(43.9 ��m), the narrower the interval will be.
4 Conclusions
1) Empirical relationships were developed to estimate the average grain size and tensile strength of weld nugget of friction stir welded AA 6061-T6 aluminium alloy joints incorporating FSW tool and process parameters.
2) A linear regression equation was established between grain size and tensile strength of the weld nugget of friction stir welded AA 6061-T6 aluminium alloy joints.
3) The developed relationships can be effectively used to predict the grain size and tensile strength of friction stir welded AA 6061-T6 aluminium alloy joints within the range of parameters.
Acknowledgements
The authors are grateful to the Department of Manufacturing Engineering, Annamalai University, Annamalai Nagar, India, for extending the facilities of Material Testing Laboratory to carry out this investigation. The authors wish to place their sincere thanks to Clean Technology Division of Ministry of Environment and Forest, Government of India, New Delhi, for financial support rendered through a R&D Project No. MoEF1-9/2005-CT. Authors would like to thank Mr. E. BALAMURUGAN, post graduate student, Mr. K. SUBRAMANIYAN, senior foreman, Manu- facturing Engineering, Mr. S. MUTHUKUMARAN, Mr. N. SAIRAMAN and Mr. A. K. THILLAIPARAMAN of project assistants, CEMAJOR for their help and support.
References[1] THOMAS W M. Friction stir welding. International Patent Application No. PCT/GB92/02203, GB Patent Application No. 9125978.8, U.S. Patent No.5,460,317[P]. 1991.
[2] OKUYUCU H, KURT A, ARCAKLIOGLU E. Artificial neural network application to the friction stir welding of aluminum plates [J]. Materials and Design, 2007, 28: 78-84.
[3] FRIGAARD O, GRONG O, MIDLING O T. A process model for friction stir welding of age hardening aluminum alloys [J]. Metallurgical and Materials Transactions A, 2001, 32: 1189-1200.
[4] ZHANG H W, ZHANG Z, CHEN J T. 3D modeling of material flow in friction stir welding under different process parameters [J]. Materials Processing Technology, 2007, 183: 62-70.
[5] FERSINI D, PIRONDI A. Analysis and modeling of fatigue failure of friction stir welded aluminum alloy single-lap joints [J]. Engineering Fracture Mechanics, 2008, 75: 790-803.
[6] BUFFA G, FRATINI L, SHIVPURI R. CDRX modeling in friction stir welding of AA 7075-T6 aluminum alloy: Analytical approaches [J]. Materials Processing Technology, 2007, 191: 356-359.
[7] FRATINI L, BUFFA G. CDRX modeling in friction stir welding of aluminum alloys[J]. Int Machine Tools and Manufacture, 2005, 45: 1188-1194.
[8] THOMAS W M, NICHOLAS E D. Friction stir welding for the transportation industries [J]. Materials and Design, 1997, 18: 269-273.
[9] OOSTERKAMP A, DJAPIC OOSTERKAMP L, NORDEIDE A. Kissing bond phenomena in solid state welds of aluminium alloys [J]. Welding, 2004: 225-231.
[10] ZENG W M, WU H L, ZHANG J. Effect of tool wear on microstructure, mechanical properties and acoustic emission of friction stir welded 6061 Al alloy [J]. Acta Metallurgica Sinica, 2006, 19(1): 9-19.
[11] OLGA V F. The influence of pin geometry on bonding and mechanical properties in friction stir weld 2014 Al alloy [J]. Scripta Materialia, 1998, 38(5): 703-708.
[12] ELANGOVAN K, BALASUBRAMANIAN V. Influences of tool pin profile and tool shoulder diameter on the formation of friction stir processing zone in AA6061 aluminium alloy [J]. Materials and Design, 2008, 29: 362-373.
[13] ELANGOVAN K, BALASUBRAMANIAN V, BABU S. Predicting tensile strength of friction stir welded AA6061 aluminium alloy joints by a mathematical model [J]. Materials and Design, 2009, 30: 188-193.
[14] GUNARAJ V, MURUGAN N. Application of response surface methodology for predicting weld bead quality in submerged arc welding of pipes [J]. Materials Processing Technology, 1999, 88: 266-275
[15] COCHRAN W G, COX G M. Experimental designs [M]. London: John Wiley & Sons Inc, 1957.
[16] BARKER T B. Quality by experimental design [M]. Marcel Dekker: ASQC Quality Press, 1985.
[17] GARDINER W P, GETTINBY G. Experimental design techniques in statistical practice [M]. Chichester: Horwood Press, 1998.
[18] RAJAKUMAR S, MURALIDHARAN C, BALASUBRAMANIAN V. Optimization of the friction-stir- welding process and the tool parameters to attain a maximum tensile strength of AA7075-T6 aluminium alloy [J]. Journal of Engineering Manufacture, 2010, 224: 1175-1191.
[19] SENTHIL KUMAR T, BALASUBRAMANIAN V, SANAVULLAH M Y. Influences of pulsed current tungsten inert gas welding parameters on the tensile properties of AA 6061 aluminium alloy [J]. Materials and Design, 2007, 28: 2080-2092.
[20] MILLER J E, FREUND, JOHNSON R. Probability and statistics for dngineers [M]. New Delhi: Prentice Hall, 1996.
[21] CANGELOSI V E, TAYLOR P H, RICE P F. Basic statistics: A real world approach [M]. 3rd ed. St. Paul, Minnesota: West Publishing Company, 1983: 315-364.
[22] MONTGOMERY D C, HUNGER G C. Applied probability for engineers [M]. London: John Wiley & Sons Inc, 1994: 471-529.
Corresponding author: S. RAJAKUMAR; Tel: +91-09486870051, +91-4144-231053; Fax: +91-4144-238080/238275; E-mail: srkcemajor@yahoo.com
DOI: 10.1016/S1003-6326(09)60387-3
