
Trans. Nonferrous Met. Soc. China 26(2016) 2784-2792
Structural changes and volatility correlation in nonferrous metal market
Dan WU, Zhen-hua HU
School of Business, Central South University, Changsha 410083, China
Received 2 June 2016; accepted 12 October 2016
Abstract:
The GARCH and DCC-GARCH models are used to study the volatility aggregation and dynamic relevance of China��s three kinds of nonferrous metals (copper, aluminum and zinc) prices incorporating structural changes. The results show that copper, aluminum and zinc returns have many structure breaks points, and nonferrous metals have the great volatility risk during financial crisis. From the results of GARCH with and without structural changes, it is found that the volatility clustering of single nonferrous metal is overvalued when ignoring the structural mutation, and the return of aluminum is the most overvalued, indicating that aluminum market is more susceptible to external shock. Furthermore, it is also found that dynamic volatility correlation exists in the three prices of nonferrous metals, and the structural changes have no significant effect on the volatility correlation of the three nonferrous metals.
Key words:
copper; zinc; aluminum; nonferrous metals price; structural changes; DCC-GARCH model; volatility dynamic correlation;
1 Introduction
Nonferrous metals (such as copper, aluminum and zinc) play a crucial role in industrial production and economic activity. With the development of China��s economy and commodity market, the demand for nonferrous metals grows rapidly, and the price dynamics of nonferrous metal markets are extremely volatile. As an important industrial raw material, the price volatility of nonferrous metals has an important influence on a country��s nonferrous metals industry and the macro economy [1]. Thus, the research on volatility of nonferrous metals price has become a hot area [2].
The reason of the price volatility of nonferrous metals is concerned by a number of researches [3-5]. BOSCHI and PIERONI [6] studied the interaction between aluminum market and macroeconomic variables. The results showed that the aluminum metal prices are ultimately determined by the fundamentals of supply and demand. CHEN [7] researched the price data of nonferrous metals from 1900 to 2007, showing that the price volatility of nonferrous metals is mainly determined by the global macroeconomic factors during 1972 to 2007. CUMMINS et al [8] discussed the influence of behavior factors on the price volatility of nonferrous metals.
Additionally, the research on nonferrous metal price volatility spillover is concentrated [9,10]. XIARCHOS and FLETCHER [11] investigated the one-way relationship between metal and scrap metal. The study concluded that there exists information transfer in the scrap metal and the basic metal market in short term. TODOROVA et al [12] analyzed the volatility spillover effect between five kinds of nonferrous metals (aluminum, copper, lead, nickel and zinc) by using HAR models. YUE et al [13] used the VAR-DCC-GARCH model to explore the co-movement relationship between the price of China��s nonferrous metals market and the price of LME in London. In summary, previous studies have indicated that the volatility of the price of nonferrous metals and the volatility spillover have attracted much attention of scholars, but there is still much issue.
Particularly, nonferrous metal prices have been subjected to frequent structural changes or regime shifts due to economic and geo-political events. WATKINS and MCALEER [14] predicted and simulated copper and aluminum futures price volatility by the AR(1)-GARCH(1,1) model. The results showed that the price fluctuations of nonferrous metals may be affected by the special events within the industry. Thus, considering structural changes in the prices is necessary when we study the volatility of nonferrous metal prices. In this paper, we use the iterative cumulative square and algorithm (ICSS algorithm, INCLAN and TIAO [15]) to identify the points of structural changes in the variance of nonferrous metals returns [16-18]. Furthermore, we evaluate the impact of structural changes on volatility cluster using a univariate GARCH model. And we use the DCC-GARCH model proposed by ENGEL [19] to measure the dynamic correlation between the volatility of the nonferrous metals price [20,21]. We construct the DCC-GARCH model with structural changes and without structural changes to measure the volatility correlation of nonferrous metal prices. In addition, the copper, aluminum and zinc are the most important nonferrous metal industry, and their prices are closely related to the global industrial output, so we use copper, aluminum and zinc as the object of our study in this paper.
2 Methodology
The dynamic conditional correlation GARCH model (DCC-GARCH) was proposed by ENGEL [19]. The model can not only study the volatility clustering of individual variables, but also analyze the strength of the relationship between the two variables. The model assumes that the return on assets at the t period follows a mean of 0, and the conditional multidimensional normal distribution of covariance matrix Ht:
 (1)
(1)
where rt is a k��1 vector, Ht is conditional covariance matrix, Dt is a k��k diagonal matrix which is composed of the time varying standard deviation  of the single variable GARCH model, and Rt is time varying correlation coefficient matrix. can be obtained by the single variable GARCH model:
 (2)
(2)
where ��i is a constant,  is p order ARCH terms,
  is q order AR terms. ENGEL [19] suggested that the link of the asset volatilities can be expressed as the following dynamic correlation structure:

 (3)
(3)
 (4)
(4)
 (5)
(5)
where  ,
, 
 is the unconditional covariance of ��t; ��1m and ��2n are estimation coefficients for dynamic conditional correlation models. If they are significantly not equal to 0, there is a dynamic conditional correlation coefficient among different assets.
  is a diagonal matrix of
  on the diagonal. The dynamic conditional correlation coefficient among different variables is expressed by the elements
  on Rt.
Following ENGEL��s result [19], the DCC-GARCH model is divided into two steps. The first step is to estimate the univariate GARCH model, and the second step is to estimate the DCC model based on the first step. The likelihood function which estimates this model can be written in the following form:
 (6)
(6)
where  represents the estimated result of the conditional variance in the first step
 (7)
(7)
And f is the estimation of conditional correlation coefficient based on the first step estimation
 (8)
(8)
In order to construct the DCC-GARCH model with structural changes, we need to regard detect point mutation of ICSS algorithm as a dummy variable is introduced into the univariate GARCH model.
The univariate GARCH model can be written as
 (9)
(9)
Then, the ICSS algorithm is used to detect the mutation point as dummy variable, which is introduced into the univariate GAHCH model, and gain the univariate GAHCH model with structural changes:
 (10)
(10)
N mutation points are obtained by using the ICSS algorithm. The two-mutation point interval region is called the volatility regime, which can get the n+1 wave mechanism. In the first i+1, the virtual variable takes one, and the other is set to zero.
ENGEL [19] believed that the DCC-GARCH model can effectively describe the dynamic mechanism between the financial variables, and the influence of the reaction variables. In order to analyze the mutual influence of nonferrous metals, we use the DCC-GARCH model to measure the interaction among three kinds of nonferrous metals. The DCC-GARCH model used in this paper is as follows:
 (11)
(11)
where ��i,j,t is the dynamic correlation coefficient for the DCC-GARCH model, Rt is the dynamic correlation matrix, and  is the diagonal matrix of the dynamic correlation matrix. ��1m and ��2n are the coefficients of the DCC-GARCH model.
3 Data and descriptive statistics
The authors consider three time series of China��s nonferrous metals (copper, aluminum and zinc) provided by the WIND Commodity Database. Taking into account the zinc began to trade at March 26, 2007, the data are from March 26, 2007 to June 30, 2015, including 2011 daily data.
In this paper, the price series are converted into the logarithmic percentage return series for all sample indices, i.e., R_Xt=ln Xt-ln Xt-1, where ln Xt represents the logarithmic series for eliminating the abnormal variance and reducing the volatility of the data. R_Xt represents the return series, i.e., rt in Eqs. (9) and (10).
The descriptive statistics and the results of ADF test are listed in Table 1. As listed in Table 1, the means of all return series are small, and the corresponding standard deviations of returns are substantially higher. The standard deviation of zinc return series is the largest, which indicates that the return volatility of zinc is the largest. The results of skewness, kurtosis, and Jarque-Bera tests show that the distributions of nonferrous metals returns are not normally distributed and their returns are ��left-skewed�� and ��fat tail��. In addition, the results of ADF test show that all the return sequences significantly reject the null hypothesis of unit root exists, so all the return series are stationary.
4 Empirical analysis
4.1 Structural changes test
Following INCLAN and TIAO [15], WEN et al [22], and EWING and MALIK [23], we use the ICSS algorithm to test the structural changes of the nonferrous metal return sequence. The returns of the nonferrous metals series with structural changes and ��3 standard deviations are illustrated in Figs. 1, 2 and 3. In these figures, all the nonferrous returns have many points of structural changes in volatility. And copper return sequence has 6 structural change points, while aluminum return sequence has 14 structural change points, and the zinc return sequence has 5 structural change points.
The ICSS algorithm detection results of three kinds of nonferrous metal price return sequence are listed in Tables 2, 3 and 4. The copper return series in March 26, 2007 to June 30, 2015 period have 6 structural change points in Table 2. In all structural change points, there are two change points in 2008, while there are only 1 structural change in China��s rapid economic recovery and development in 2009, 2010 and 2011. This indicates that the impact of the financial crisis on copper return sequence is huge.
As can be seen from Table 3, the aluminum return sequence has 14 structural change points, resulting in 15 volatility regimes. Most of points appeared in 2007, 2008, and 2009. Meanwhile, the variance of each volatility regimes is quite large during the financial crisis.
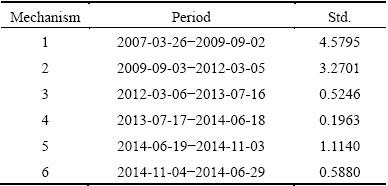
In Table 4, zinc has 5 structural change points. There is no structural change point in 2012. This is due to the fact that the run time of zinc futures market is short in 2008, so the financial crisis did not have a clear influence on zinc market.
Table 1 Summary statistics
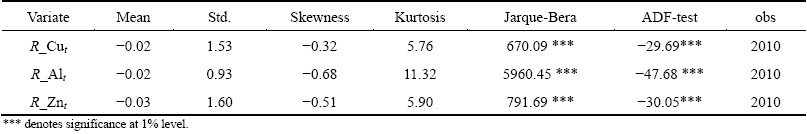
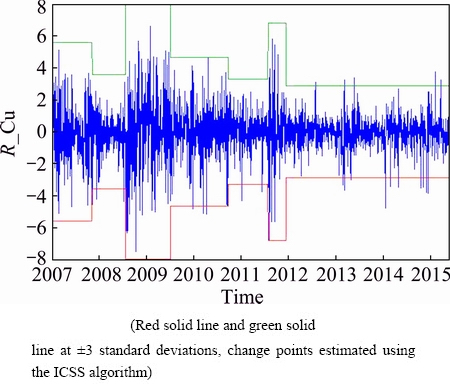
Fig. 1 Daily return of copper
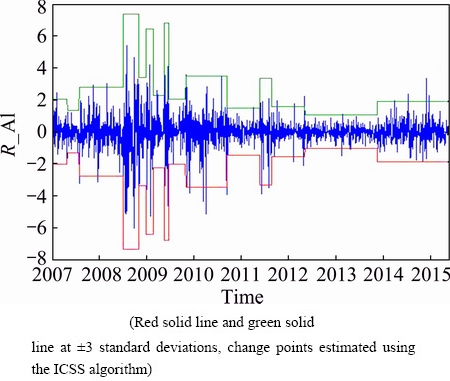
Fig. 2 Daily return of aluminum
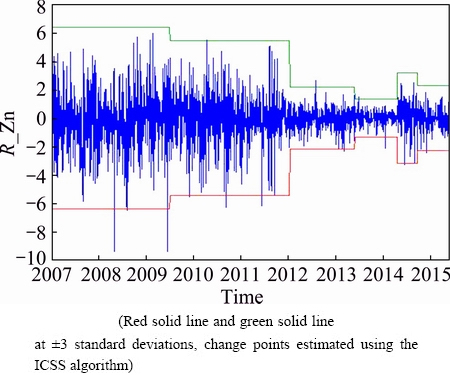
Fig. 3 Daily return of zinc
During the 2008 financial crisis, both copper and aluminum had a number of change points. That is due to the global economic downturn caused by the financial crisis, resulting in demand of nonferrous metals declining. As a result, China��s nonferrous metals prices decline sharply, and generate a number of prices change points. Afterwards, with the recovery of the global economy in 2009, the market demand for nonferrous metals and other commodities increases gradually.
Table 2 Structural changes in volatility: R_Cut series
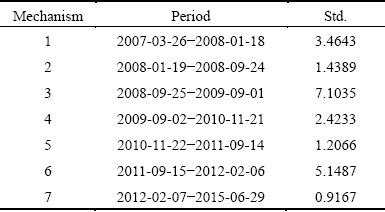
Table 3 Structural changes in volatility: R_Alt series
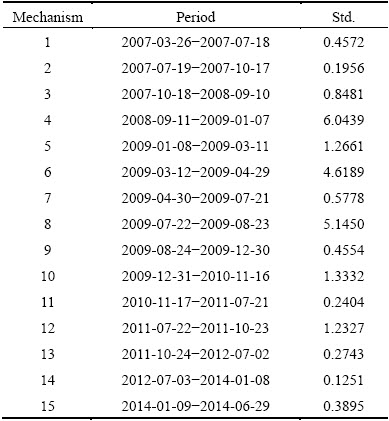
Table 4 Structural changes in volatility: R_Znt series
Moreover, the loose fiscal policy prompts the rise of the nonferrous metal prices. At the same time, China enters the golden era of the development of manufacturing industry, the demand for nonferrous metals increases, resulting in nonferrous metal price return structural mutation. But not for much longer, China��s economic growth started to slow down in 2013, which led to the nonferrous metal price change in 2013 and 2014. As can be seen from these tables, the financial crisis period has brought the most change points, which shows that the financial crisis has the most obvious influence on the price volatility of nonferrous metals. At the same time, comparing the standard deviation of volatility regimes, we find that the volatility risk in the crisis period is far greater than in the other periods.
4.2 Analysis of volatility clustering under structural changes
For further investigation of nonferrous metal return volatility structure, structural changes are introduced to the univariate GARCH model. Analyzing the coefficient structural changes of the univariate GARCH model with structure changes, we study the influence of the structural changes on the return series of the nonferrous metal. The estimation results of the univariate GARCH model without the structural changes and with the structural changes are listed in Tables 5, 6 and 7. The left panel of these three tables presents the results from fitting a GARCH model. The right panel of the tables shows the results of a GARCH model with structural changes.
Table 5 Estimation results of univariate GARCH model: R_Cut
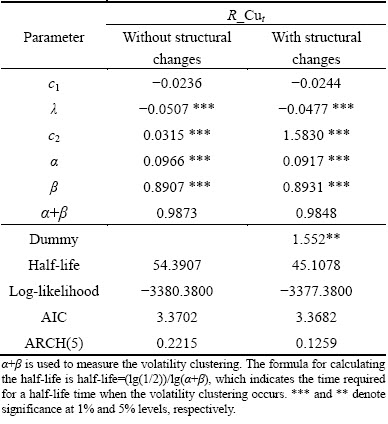
In Table 5, it can be seen that coefficients �� and �� of the GARCH model are significant. The ��+�� of the univariate GARCH model without structural changes is 0.9873, which suggests that copper market has volatility clustering phenomenon. However, the ��+�� is 0.9848 in GARCH model with structural changes. When the structural changes are accounted for, the ��+�� becomes small. This means that the volatility clustering of the copper weakens, which indicates that the volatility of copper comes from external shocks. The estimate result of dummy coefficient is 1.552 in GARCH model with structural changes, which also indicates that the external shocks have the influence on the volatility. In addition, we choose half-life index proposed by EWING and MALIK [23]. The change of half-life index reflects the impact of the external shock caused by the sudden event or the new information from the market. In Table 5, we find the half-life of shocks changes dramatically from about 54 days to about 45 days when the structural changes are taken into account. This implies that a shock is expected to lose half of its original impact in few days after accounting for structural changes.
Table 6 Estimation results of univariate GARCH model: R_Alt
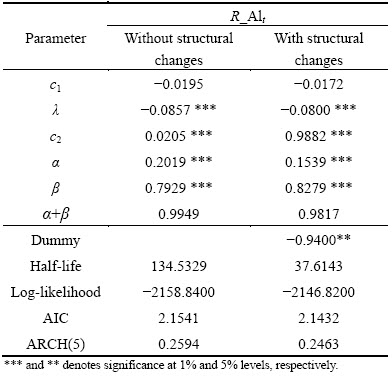
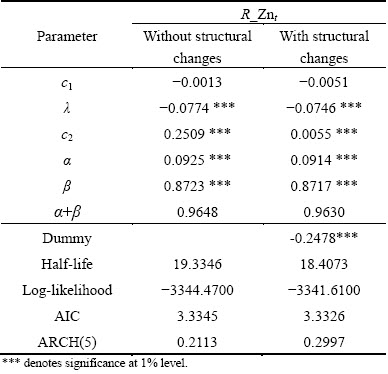
Table 7 Estimation results of univariate GARCH model: R_Znt
For aluminum return series, the estimate result of ��+�� in the univariate GARCH model without structural changes is 0.9949, showing that volatility clustering phenomenon exists in the aluminum returns sequence, which is more aggregate than that of copper market. The ��+�� of the univariate GARCH with structural changes is 0.9817, indicating that the return sequence volatility clustering phenomenon drops when considering structural changes. Compared with copper, aluminum is more vulnerable to the impact of external shocks. Meanwhile, the dummy coefficient of the structure change model with change points is -0.94, which shows that external shocks have a negative impact on the volatility. The impact of external shocks on the aluminum price volatility in the half-life decreases from the 134 weeks to 37 days, which is a sharp decline.
For zinc series, the ��+�� of the univariate GARCH model without structural changes is 0.9648, also indicating that volatility clustering phenomenon exists in zinc volatility structure sequence. And zinc volatility clustering phenomenon is the weakest among the three kinds of nonferrous metals. In the case of univariate GARCH model with structural changes, the ��+�� is 0.9630, which implies that the external shocks affect the volatility of zinc market. The dummy coefficient of the univariate GARCH model with structural changes is -0.2478, which shows that external shocks have a negative impact on the volatility. In addition, the half-life of the external shock to zinc prices falls from 19 days to 18 days.
From the these three tables, we can find that when the structural changes of nonferrous metal prices return are ignored, the nonferrous metal prices sequences present a large number of volatility clustering phenomena. However, the volatility clustering of various nonferrous metals drops to a certain degree when the structural changes are taken into consideration. These results suggest that external shocks affect the volatility clustering of nonferrous metals.
For volatility clustering reflecting by half-life index, the results are similar to the findings of AGGARWAL et al [16], EWING and MALIK [23]. Ignoring the structure change will overestimate the single market volatility clustering, indicating that the market volatility clustering mostly comes from the impact of external shocks. At the same time, according to the level of weakening of nonferrous metal prices fluctuation agglomeration, it can be found that aluminum price volatility clustering decreasing degree is the largest compared with copper and zinc after considering structure change. This shows aluminum has more significant response to external shocks, thus indicating that the aluminum is the most sensitive to the external shock.
Additionally, the ARCH test results are not significant, indicating that all the GARCH models have effectively eliminated the conditional variance of the original sequence. After considering the structure changes, the estimation result of log-likelihood (maximum likelihood function value) of model increases and AIC values decrease, which demonstrates that considering the structural changes in the univariate GARCH model performs better than ignoring structural changes in the basic univariate GARCH model.
4.3 Analysis of volatility dynamic correlation under structural changes
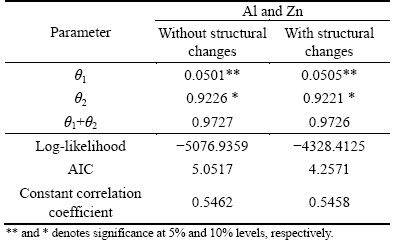
The estimatation results of the DCC-GARCH model without structural changes and with structural changes are presented in Tables 8, 9 and 10. As shown in the three tables, the coefficient is significantly at 10% of the significance levels in the two models. Dynamic conditional correlation coefficients are found among nonferrous metal markets, namely volatility in nonferrous metal price returns transfer intensity changes along with the time change.
From the table in the log-likelihood and AIC, it can be seen that the DCC-GARCH model with structural changes performs better than the DCC-GARCH model without structural changes, which consists with the finding of EWING and MALIK [23] whom found that the BEKK model considering structural changes performed better than the BEKK model ignoring structural changes, namely in the ARCH type models with sequence change will improve the model performance.
Table 8 Estimation results of DCC-GARCH model: Cu and Al
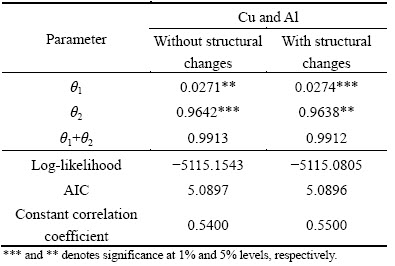
Table 9 Estimation results of DCC-GARCH model: Cu and Zn
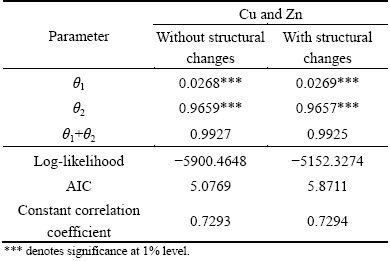
Table 10 Estimation results of DCC-GARCH model: Al and Zn
The dynamic conditional correlation coefficients of volatility of the nonferrous metals are described in Figs. 4, 5 and 6. As can be seen from these three figures, the volatilities of copper and aluminum, copper and zinc, aluminum and zinc prices are volatile with time variation.
As can be seen from Fig. 4, the volatility dynamic correlation of copper and aluminum is time-varying. During the financial crisis, the volatility correlation coefficients of copper and aluminum decrease. However, the correlation between the two markets rises to 0.8 in the economic recovery period around 2010. After the economic recovery and rapid development period, the relevance of copper and aluminum declines.
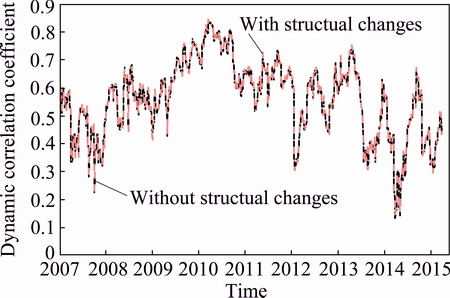
Fig. 4 Dynamic correlation coefficient of cooper price and aluminum price
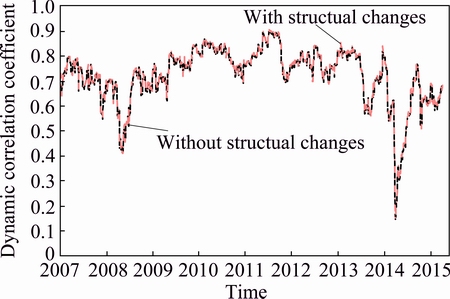
Fig. 5 Dynamic correlation coefficient of cooper price and zinc price
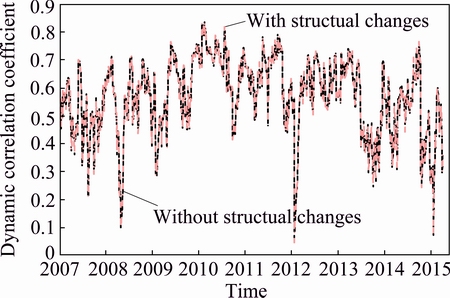
Fig. 6 Dynamic correlation coefficient of aluminum price and zinc price
As can be seen from Fig. 5, the dynamic correlation of copper and aluminum weakens during the financial crisis, and the minimum correlation coefficient is 0.4. Nevertheless, with the economic recovery, the correlation between the two markets rises to a relatively stable state. Since the beginning of September 2013, the correlation has a relatively large range of fluctuations. In general, there is a downward trend in the volatility dynamic correlation. In June 2014, the correlation decreases to 0.15.
As can be seen from Fig. 6, the dynamic correlation of aluminum and zinc is high. During the financial crisis, the volatility correlation reaches 0.6 (April 30, 2008). However, the dynamic correlation of aluminum and zinc falls to 0.09 in July 15, 2008. During the economic recovery period, the correlation between aluminum and zinc has increased, and the volatility of the two shows a downward trend since 2013.
As can be observed from the three figures, among three couple of markets there exists frequent and high volatility dynamic correlation. In addition, three couples of price dynamic correlation decreases during the financial crisis. The dependence is enhanced during the upside economic period, while the correlation appears in decreasing during the economic slowdown. The reason why there is frequent and violent volatility correlation in nonferrous metals is that the three nonferrous metals have a strong alternative and complementary. The markets show high volatility during the economic downturn period. Meanwhile, the investor��s risk-averse level increased and commodity futures price dumped, which results in nonferrous metals and other commodities prices sharply diving. Simultaneously, the degree of correlation between the volatility of nonferrous metals also decreases when the market demand for nonferrous metals falls. Nevertheless, the demand for nonferrous metals in manufacturing and other industries increases in the economic recovery period. The complementary and alternative features of nonferrous metals gradually are obvious, and the correlation among the volatility of nonferrous metals prices begin to increase. Until 2013, with the emergence of China��s economic development short board, nonferrous metals are affected by the excess capacity, energy saving and emission reduction factors. And the nonferrous metals prices have been volatile, which causes the three nonferrous metal prices volatility correlation to increase.
Furthermore, it can be observed that there exists a positive dynamic fluctuation correlation among three couple of price series, and nonferrous metal prices rise and fall at the same time. Similarly, for a certain alternative among the three nonferrous metals, the prices have positive correlation, then show the same rise and fall. For the three groups of price volatility dynamic correlation, that of copper and zinc is relatively flat and maintains at a high correlation, but that of aluminum and zinc, and that of aluminum and copper are more intense. This is mainly due to the sensitivity of aluminum prices.
We can see that considering structural changes and ignoring structural changes, the overall trend of the volatility correlation of nonferrous metals is not significant. These results suggest that volatility dynamic correlation of nonferrous metals has received little effect of the external information, which means that volatility dynamic correlation of nonferrous metal mainly depends on the inner link of the nonferrous metal itself.
5 Conclusions
1) A number of structural change points appear in the return series of copper, aluminum and zinc, and aluminum has the most change points among these three nonferrous metals. Additionally, more change points appear during the financial crisis period. And the volatility risk in nonferrous metals is the largest during the financial crisis.
2) The price of nonferrous metals has obvious volatility clustering. Furthermore, the degree of volatility clustering of the nonferrous metals declines by considering the structural changes, which shows that the external shocks have a certain impact on the volatility of nonferrous metals.
3) There is frequent and high positive volatility dynamic correlation in the three nonferrous metals market. Moreover, the volatility correlation changes with the economic cycle. Nevertheless, when considering the structural changes in DCC-GARCH model, the volatility dynamic correlation among the price of nonferrous metals has been virtually unchanged, which shows that the dynamic correlation of the nonferrous metals is mainly determined by the intrinsic link of the nonferrous metals.
4) A close correlation exists in various nonferrous metals prices. When investors invest a kind of nonferrous metal futures, they should consider the price of other nonferrous metal market.
References
[1] ZHONG M, CHEN J, ZHU X, HUANG J. Strategic equilibrium price analysis and numerical simulation of preponderant high-tech metal mineral resources [J]. Transactions of Nonferrous Metals Society of China, 2013, 23: 3153-3160.
[2] PENG D, WANG J, RAO Y. Applications of nonferrous metal price volatility to prediction of China��s stock market [J]. Transactions of Nonferrous Metals Society of China, 2014, 24: 597-604.
[3] MCMILLAN D G, SPEIGHT A E. Non-ferrous metals price volatility: A component analysis [J]. Resources Policy, 2001, 27: 199-207.
[4] MASTERS M W, WHITE A K. The accidental hunt brothers�Cact 2 index speculators have been a major cause of the recent drop in oil prices [R]. Working Paper, 2008.
[5] GONG X, HE Z, LI P, ZHU N. Forecasting return volatility of the CSI 300 Index using the stochastic volatility model with continuous volatility and jumps [J]. Discrete Dynamics in Nature and Society, 2014, 2014: 1-10.
[6] BOSCHI M, PIERONI L. Aluminium market and the macroeconomy [J]. Journal of Policy Modeling, 2009, 31: 189-207.
[7] CHEN M. Understanding world metals prices��Returns, volatility and diversification [J]. Resources Policy, 2010, 35: 127-140.
[8] CUMMINS M, DOWLING M, LUCEY B M. Behavioral influences in non-ferrous metals prices [J]. Resources Policy, 2015, 45: 9-22.
[9] XU X E, FUNG H. Cross-market linkages between US and Japanese precious metals futures trading [J]. Journal of International Financial Markets, Institutions and Money, 2005, 15(2): 107-124.
[10] CHENG H, HUANG J, GUO Y, ZHU X. Long memory of price�Cvolume correlation in metal futures market based on fractal features [J]. Transactions of Nonferrous Metals Society of China, 2013, 23: 3145-3152.
[11] XIARCHOS I M, FLETCHER J J. Price and volatility transmission between primary and scrap metal markets [J]. Resources, Conservation and Recycling, 2009, 53(12): 664-673.
[12] TODOROVA N, WORTHINGTON A,  M. Realized volatility spillovers in the non-ferrous metal futures market [J]. Resources Policy, 2014, 39: 21-31.
[13] YUE Y, LIU D, SHAN X U. Price linkage between Chinese and international nonferrous metals commodity markets based on VAR-DCC-GARCH models [J]. Transactions of Nonferrous Metals Society of China, 2015, 25: 1020-1026.
[14] WATKINS C, MCALEER M. Pricing of non-ferrous metals futures on the london metal exchange [J]. Applied Financial Economics, 2006, 16: 853-880.
[15] INCLAN C, TIAO G C. Use of cumulative sums of squares for retrospective detection of changes of variance [J]. Journal of the American Statistical Association, 1994, 89: 913-923.
[16] AGGARWAL R, INCLAN C, LEAL R. Volatility in emerging stock markets [J]. Journal of Financial and Quantitative Analysis, 1999, 34: 33-55.
[17] KOKOSZKA P, LEIPUS R. Change-point estimation in ARCH models [J]. Bernoulli, 2000, 6: 513-539.
[18] HAMMOUDEH S, LI H. Structural changes in volatility in emerging markets: The case of gulf Arab stock markets [J]. International Review of Financial Analysis, 2008, 17: 47-63.
[19] ENGLE R. Dynamic conditional correlation: A simple class of multivariate generalized autoregressive conditional heteroskedasticity models [J]. Journal of Business & Economic Statistics, 2002, 20: 339-350.
[20] WEN F, HE Z, DAI Z, YANG X. Characteristics of investors�� risk preference for stock markets [J]. Economic Computation and Economic Cybernetics Studies and Research, 2014, 3: 235-254.
[21] BAUWENS L, LAURENT S, ROMBOUTS J V. Multivariate GARCH models: A survey [J]. Journal of Applied Econometrics, 2006, 21: 79-109.
[22] WEN F, GONG X, CAI S. Forecasting the volatility of crude oil futures using HAR-type models with structural breaks [J]. Energy Economics, 2016, 59: 400-413.
[23] EWING B T, MALIK F. Volatility transmission between gold and oil futures under structural changes [J]. International Review of Economics & Finance, 2013, 25: 113-121.
��ɫ�����г��еĽṹͻ��Ͳ����������
�� ��������
���ϴ�ѧ ��ѧԺ����ɳ 410083
ժ Ҫ��ͨ����������ṹͻ��ͺ��Խṹͻ���GARCH��DCC-GARCHģ�ͣ�̽��ͭ������п3����ɫ����������֮��IJ����ۼ����Լ���������ԡ����������ͭ������п�����ʶ����ڶ���ṹͻ��㣬���ҽ���Σ���ڼ���ɫ�����IJ�����������Խṹͻ���ʹ�õ�����ɫ�����۸�IJ����ۼ����߹��������IJ����ۼ��̶ȱ��߹��̶ȴ�������������ɫ�����۸������������ʸ������ܵ�ͻ���¼�������ⲿ�����Ӱ�죻��ɫ�����۸�֮��������ԵĶ�̬��������ԣ���������п֮��IJ������������ṹͻ�������ɫ����֮��IJ�������Բ�û��������Ӱ�졣
�ؼ��ʣ�ͭ��п��������ɫ�����۸ṹͻ�䣻DCC-GARCH ģ�ͣ������ʶ�̬�����
(Edited by Sai-qian YUAN)
Foundation item: Project (71072079) supported by the National Natural Science Foundation of China
Corresponding author: Zhen-hua HU; Tel: +86-13607438318; E-mail: csuhuzhenhua@163.com
DOI: 10.1016/S1003-6326(16)64395-9
Abstract: The GARCH and DCC-GARCH models are used to study the volatility aggregation and dynamic relevance of China��s three kinds of nonferrous metals (copper, aluminum and zinc) prices incorporating structural changes. The results show that copper, aluminum and zinc returns have many structure breaks points, and nonferrous metals have the great volatility risk during financial crisis. From the results of GARCH with and without structural changes, it is found that the volatility clustering of single nonferrous metal is overvalued when ignoring the structural mutation, and the return of aluminum is the most overvalued, indicating that aluminum market is more susceptible to external shock. Furthermore, it is also found that dynamic volatility correlation exists in the three prices of nonferrous metals, and the structural changes have no significant effect on the volatility correlation of the three nonferrous metals.
