
J. Cent. South Univ. (2017) 24: 2685-2692
DOI: https://doi.org/10.1007/s11771-017-3681-8

Flexural failure experiment on cracked PC simply supported box girders
CAO Guo-hui(�ܹ���)1, ZHANG Wang(����)2, PENG Xi-rong(��ϸ��)1, ZHANG Sheng(��ʤ)2
1. College of Civil Engineering, Hunan City University, Yiyang 413000, China;
2. College of Civil Engineering and Architecture, Changsha University of Science & Technology,Changsha 410114, China
 Central South University Press and Springer-Verlag GmbH Germany, part of Springer Nature 2017
Abstract:
Long-term load and flexural failure experiments are carried out on two prestressed concrete (PC) simply supported box girders. In the long-term load experiment, girder-1 (G1) is in an elastic state, while girder-2 (G2) is in a cracking state. To investigate the influence of cracking on the flexural behaviors of PC simply supported box beams, the experiment results are analyzed from many aspects, such as load�Cdeflection, load�Cstrain, and failure mode. Experiment results show the following: 1) the shrinkage and creep of concrete have considerable influences on the long-term deflection and strain of the two girders; 2) in the flexural failure experiment, the cracks and ultimate loads of the two girders are close. The rigidity degeneration of G2 is significantly faster than that of G1, and thus G2 shows nonlinear characteristics earlier; 3) to prove the validity and rationality of the current code, the cracking load and ultimate load of the two girders are calculated according to the current code.
Key words:
PC box girders; long-term load experiment; flexural behaviors; cracks; static performance��
1 Introduction
Prestressed concrete (PC) box girders are widely applied in modern bridge-building because of their high rigidity, light weight, and stress fit distribution. Owing to obsolete design codes, incomplete construction technology, and overload operations, damages such as cracking and excessive deflection at midspan are common in existing PC box girder bridges [1�C5]. Therefore, an investigation into the mechanical properties of PC box girder bridges is necessary. Such investigation will deepen our understanding of the failure mode and mechanism of PC box girders, as well as provide scientific foundations for the designs and evaluations of bearing capacity of PC box girders.
In recent years, significant progress has been made in the study on the flexural behaviors of PC box girders. To investigate the failure mode and the factors that influence the mechanical behaviors of PC box girders, some models are adopted in flexural failure experiments [6�C9]. However, significant differences in terms of working conditions and load types exist between the models and the existing bridges. In studying the mechanical behaviors of bridges in service for years, the use of existing bridges as experiment objects is a more reasonable approach. Some failure experiments of decommissioned PC box bridges were conducted by researchers because of the opportunity of bridge demolition [10�C16]. The performance degradation laws of existing PC box bridges were revealed based on these experiments. Meanwhile, failure experiments on decommissioned bridges have weaknesses, such as limited experiment opportunities, high costs, and complex impact factors. Thus, further investigations into the effects of a single disease on the mechanical properties of bridges become inconvenient.
In this study, long-term load and flexural failure experiments are conducted on two PC box girders. In the long-term load experiment, girder-1 (G1) is in an elastic state, while girder-2 (G2) is in a cracking state. The influence of cracking on the flexural behaviors of PC box girders is evaluated according to the results of the flexural failure experiment.
2 Model overview
2.1 Model design and production
Two PC simply supported box girder models with the same size were constructed. The specific parameters of these girders were as follows: length of 600 cm, height of 36 cm. Six bunches of prestressed strands with a design tensile strength of 1860 MPa were allocated for the girders. Many reinforcements with smooth surfaces and a design yield strength of 300 MPa (HPB300) were used as common reinforcements and stirrups. Figure 1 shows the model size and reinforcement situation. The designed value of concrete strength is 50 MPa in this experiment. Post-tensioning method is applied to the tension prestressed strands.
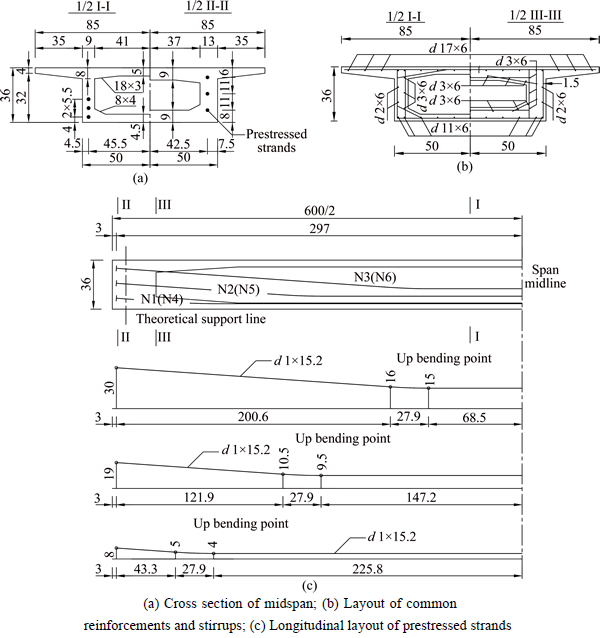
Fig. 1 Box girder model section size and reinforcement situation (Unit: cm):
2.2 Material mechanical properties
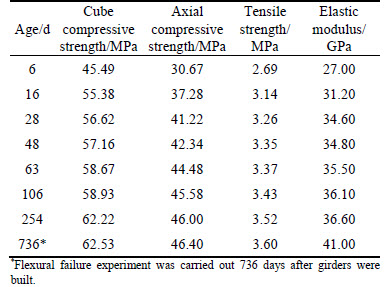
Tables 1 and 2 show the material mechanical properties of reinforcements and concrete measured according to Chinese test standards [17�C19].
Table 1 Mechanical properties of reinforcements

Table 2 Mechanical properties of concrete
3 Brief introduction of long-term load experiment
The long-term load experiment on the two girders was executed outdoors for 470 d prior to the flexural failure experiment. The load magnitudes of girder-1 (G1) and girder-2 (G2) were highway load I-grade (46 kN/m) and the load leading to cracks was at midspan (55 kN/m) respectively. After loading, G1 remained in an elastic state, while G2 was in a cracking state. The monitored parameters of the long-term load experiment included the deflections of midspan, concrete strain, and crack widths. A considerable number of dial and strain gauges were applied to measure the structural deflections and concrete strain. Figures 2 and 3 respectively show the time- history curve of the internal strains in concrete and the deflection at midspan. In this work, tensile strain was defined as positive, whereas pressure strain was defined as negative. Figure 2 illustrates that the concrete strains of G2 were significantly bigger than those of G1, whereas the growth factor of the bottom plate strain of G2 was less than that of G1. The different strains of the two girders were caused by their different load magnitudes. A certain correlation was also noted between the rule of shrinkage and creep of concrete and that of concrete strain. Figure 3 shows that the increasing deflection trends of G1 and G2 at midspan are similar. However, the deflection growth factor of G2 is less than that of G1 at midspan. This phenomenon agrees well with the rule of long-term strain, which states that the effect of stress relief caused by cracks leads to the degradation of girders�� stiffness and creep effect.
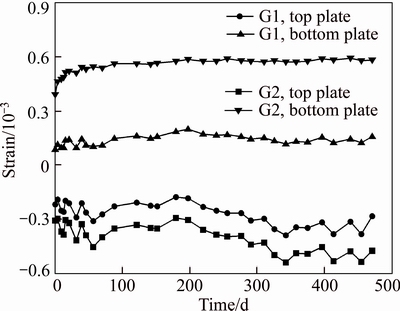
Fig. 2 Time-history curves of measured long-term strain of concrete
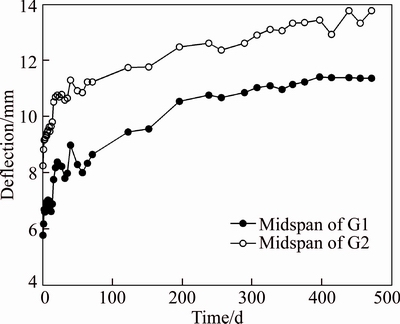
Fig. 3 Time-history curves of measured long-term deflection
4 Flexural failure experiment
Considering the limited experimental conditions in an outdoor site, the girders were transferred to an indoor experimental site, and the flexural failure experiment was conducted there.
4.1 Loading system and procedure
In the flexural failure experiment, concentrated loads were applied in two sections and then divided into four punctual loads (Fig. 4). A hydraulic jack provided the maximum load of 1000 kN, and a 20 cm stroke was used to produce loading on the girders. Load values were measured by a 1000 kN force sensor. A pre-loading experiment was conducted before the formal experiment to confirm whether the girders were in good working condition and check the reliability of the instruments. The loading increments were 20 kN at the initial stage of the experiment and then reduced to 5 kN when the load approached the calculated cracking load of 220 kN. Afterward, deflection at midspan was adopted to control the loading with a deflection increment of 5 mm. The experiment was completed when the girders reached the standard of failure or when the load could no longer be applied further.
4.2 Experiment items and methods
The parameters monitored in the failure experiment were deflections, concrete strain, stresses in anchor end of prestressed strands, support rotations, and crack spacing and width. Figures 4 and 5 show the deflections measured by dial gauges; 48 external and built-in strain gauges were used to assess the stress state of concrete in the midspan cross-section (A�CA) and the one-third cross-sections (B�CB and C�CC). Stresses in the anchor ends of N2, N4 of G1 and N3, N4 of G2 were measured by four 200 kN force sensors. Support rotations were measured by two inclinometers installed at the theoretical support line. Crack spacing and width were measured with magnifying glasses, digital microscopes, and vernier calipers.
5 Result analysis of flexural failure experiment
Table 3 shows the results of the flexural failure experiment. The loads listed in this table refer to the total load produced by the hydraulic jack in the flexural failure experiment. The maximum crack width of both G1 and G2 at midspan was about 1/50 of the calculated spans (116 mm) and reached the failure standards of 1.5 mm [20]. Given that placing extra loading on the girders was difficult after their maximum crack widths reached the failure standards, the experiment was ended for the safety of the experimental personnel.

Fig. 4 Details of loading system (Unit: cm):

Fig. 5 Locations of strain gauges for concrete:
Table 3 Results of flexural failure experiment

5.1 Deflection
Figure 6 shows the load�Cdeflection curve at midspan. The figure reveals that the load�Cdeflection curve can be divided into two stages: elastic and post-elastic. The load�Cdeflection curve grew linearly before cracking, whereas the deflection growth gradually accelerated as rigidity degenerated after cracking. The increasing trends of deflection of G1 and G2 were consistent; the differences began to appear when the load was at 160�C370 kN. In this phase, the deflection growth rate of G2 was faster than G1 after G2 cracked. When the deflection growth rate of G2 slowed down and was in accordance with G1, the load�Cdeflection curves of the two girders started to overlap again.
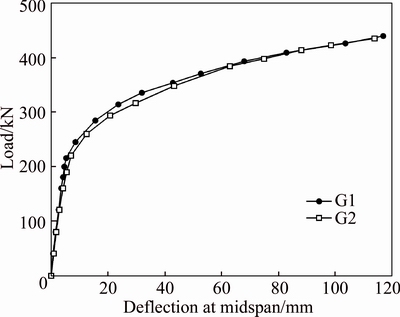
Fig. 6 Load�Cdeflection at midspan curve
5.2 Concrete strain distribution along depth of girders
Figures 7 and 8 show the concrete strain distributions along the depth of girders and the load�C neutral axis depth curve respectively. As illustrated in the figures, the concrete strains of G1 and G2 at midspan remained linear before cracking. Accordingly, the neutral axis depth of girders stabilized at about 21.5 mm. The differences of the load-neutral axis depth curves between two girders appeared when the loads were at 80�C240 kN. In this phase, the rising rate of the neutral axis depth of G2 was faster than that of G1. Owing to the fast reducing rate of stiffness and height in the compression zone, the deflection growth of G2 was faster than that of G1 at the earlier stage. By contrast, the concrete strain of G1 showed an abrupt increase after cracking. Thus, the corresponding neutral axis depth rose to 4.17 mm when the load increased from 225 kN to 245 kN. The load-neutral axis depth curves overlapped again when the load reached 250 kN.

Fig. 7 Concrete strain distribution along depth of girders:
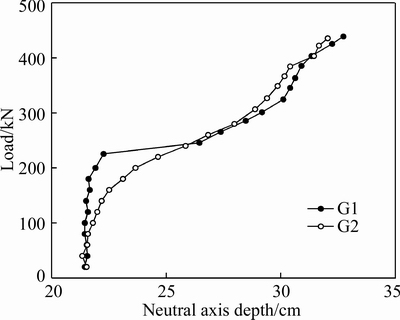
Fig. 8 Load�Cneutral axis depth curve
As shown above, concrete at the top plates of both G1 and G2 was not crushed at the end of the failure experiment. The measured concrete strains of the top plates of G1 and G2 were 1309��10�C6 and 1427��10�C6, respectively, which did not meet the ultimate strain of concrete. This result proved that the material properties of concrete were not fully utilized.
5.3 Load�Cinternal strain of concrete curve
Figure 9 shows the load�Cinternal strain of concrete curve at midspan as measured in the flexural failure experiment. As shown in the figure, the load�Cinternal strain of concrete curves at the midspan of G1 and G2 as measured in the flexural failure experiment became linear at the top plate, whereas the load-initial concrete strain appears different at the bottom plate. The tensile strains of G1 and G2 at the bottom plate shared a linear relationship before the total load reached 140 kN. When the total load reached 140 kN, the strain growth of G2 became nonlinear. On the contrary, when the total load increased to 225 kN, G1 cracked and showed an abrupt change in the slope of its load-internal strain of concrete curve, and the nonlinear relationship between its strains and load was portrayed. Owing to the influences of cracks, some differences were observed in the curves of the load-internal strain of concrete at the bottom plate of the two girders after the load went up to 260 kN.
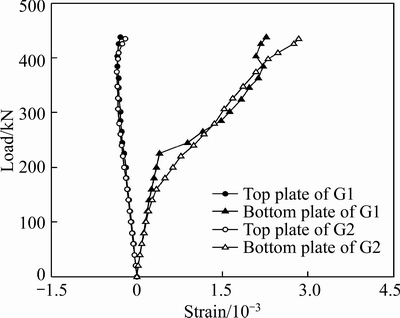
Fig. 9 Load�Cinternal strain of concrete curve
5.4 Transverse distribution of concrete compression strains at midspan
Figure 10 shows the transverse distribution of the concrete strain at midspan in the flexural failure experiment. As shown, the transverse strain distribution of G1 remained even when the total load was lower than 215 kN, and the uneven distribution of concrete strain at the internal and external flanges of the top plate appeared as loading increased. Similarly, the transverse strain distribution of G2 remained even when the total load was lower than 220 kN, and the uneven distribution of concrete strain at the internal and external flanges of the top plate also appeared as loading increased. However, the inhomogeneous degree of transverse strain distribution of G2 was less than that of G1.

Fig. 10 Transverse distribution of concrete compression strains at midspan:
5.5 Load�Cstress curves at anchor end of prestressed strands
Figure 11 shows the curve between the load�Cstress at the anchor end of prestressed strands. As shown in Fig. 11, stresses at the anchor end of N2 and N4 embedded in G1 were 1099.29 and 1043.57 MPa, and stresses at the anchor end of N3 and N4 embedded in G2 were 1028.57 and 1064.29 MPa at the beginning of the flexural failure experiment. At the initial stage of the experiment, stress at the anchor end remained nearly the same, while stress at the anchor end showed an abrupt increase when the load was increased to about 340 kN. This finding indicated that the bearing capacity of concrete and common reinforcements reached the yield stress and the anchor end of the prestressed strands showed its linearity. Stresses at the anchor end of N2 and N4 embedded in G1 were 1222.14 and 1217.86 MPa, and stress at the anchor end of N3 in G2 was 1270.71 MPa at the end of the flexural failure experiment. Stress at the anchor end of N4 was 1420 MPa, corresponding to the load of 409 KN. The stress of prestressed bar N4 embedded in G1 showed an abrupt decrease with the appearance of abnormal noises from G1 when the loading of N4 was 425 kN, indicating that the bonding between prestressed bar and concrete was damaged. The prestressed bars of girders did not yield at the end of the flexural failure experiment and still had enough bearing capacity.
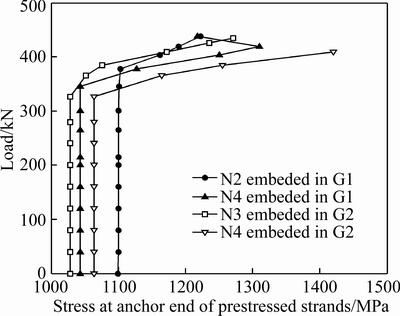
Fig. 11 Load�Cstress curves at anchor end of prestressed strands
5.6 Crack and failure mode
Figure 12 shows the final cracking pattern of girders. To facilitate comparison, the cracking patterns of the halves of G1 and G2 were drawn in one figure, the midspan section was marked with a dashed line. The pattern at the left side of the dashed line represents the measured cracks of G1, while the pattern at the right side of the dashed line represents the cracks of G2. The first crack of G1 appeared at A in Fig. 12 (the corresponding loading was 215 kN, the crack width was 0.01 mm). When the load reached 285 kN, the crack development became stable, and new cracks emerged. The maximum crack width, which appeared at B in Fig. 12, reached 5.44 mm (the corresponding load was 439 kN). The previous crack of G2, which appeared during the long-term load experiment, reappeared and was marked at the position of C in Fig. 12 (the corresponding load was 160 kN, the crack width was 0.06 mm). Apart from the previous crack of G2, the first crack occurred at D in Fig. 12 (the corresponding load was 220 kN, the crack width was 0.03 mm). Crack spacing tended to stabilize when the load was greater than 268 kN. The maximum crack width that occurred at E in Fig. 12 reached 5.46 mm (the corresponding load was 435 kN). Figure 13 shows the load�Ccrack width at the positions of B, C, and E in Fig. 12. Figure 13 illustrates that the growth rate of the crack width at A was consistent with that of E, while the crack width at the position of C was relatively slow.

Fig. 12 Final cracking pattern
As shown in Fig. 12, the crack of G2 was more fully developed than that of G1. The crack of G2 extended to the top plate at the pure moment region, while that of G1 extended itself to the intersecting area of the web and top plate. Similar to G1, the maximum crack width of G2 appeared near the loading section instead of the position of the previous crack. The primary reason for this phenomenon is that the difference in the way loading was applied during the long-term load experiment and the flexural failure experiment.

Fig. 13 Load�Ccrack width curve
Figure 14 shows that the support rotations of G1 and G2 were 3.04�� and 3.11�� respectively at the end of the flexural failure experiment. The deviation between them was within 5%. The difference between the curves of load-support rotations of two girders appeared when the load was 120�C390 kN. In this phase, the rotation growth rate of G2 was faster than that of G1.

Fig. 14 Load�Csupport rotation curve
6 Ultimate bending bearing capacity analysis
Table 4 shows that the cracking load and ultimate load of girders were calculated according to the current code [20] and then compared with the measured value. In the calculation, the measured mechanical properties of reinforcements and concrete were adopted. The result shows that the calculated value and the measured value were in agreement with the validity and rationality of the current code. The load listed in Table 4 refers to the total load produced by the hydraulic jack in the flexural failure experiment.
Table 4 Cracking load and ultimate load of girders

7 Conclusions
To investigate the influences of cracking on the flexural behavior of PC box girders, long-term load and flexural failure experiments on two PC box girder models are carried out. The following conclusions are obtained.
1) The shrinkage and creep of concrete have considerable influences on the long-term deflection and strain of two girders. The deflection growth factor of G2 is bigger than that of G1 because cracking leads to the degradation of the girders�� stiffness, and the stress relief caused by cracking decreases the creep effect at the same time.
2) In the flexural failure experiment, the cracking load and ultimate load of the two girders are adjacent. When concrete cracks, abrupt changes occur in the midspan deflection, neutral axis depth, and stress of bottom plate of G1. When G2 enters the post-elastic stage earlier than G1, the crack of G2 becomes fully developed compared with that of G1.
3) In the flexural failure experiment, the measured cracking load and ultimate load of girders are close to the values calculated according to the current code. The result proves that the code is valid and rational.
References
[1] WANG J H, SHI Z H, NAKANO M. Strength degradation analysis of an aging RC girder bridge using FE crack analysis and simple capacity-evaluation equations [J]. Engineering Fracture Mechanics, 2013, 108(8): 209�C221.
[2] LV Zhi-tao, PAN Zuan-feng. Issues in design of long-span prestressed concrete box girder bridges [J]. China Civil Engineering Journal, 2010, 43(1): 70�C76. (in Chinese)
[3] CHOI Y C, OH B H. Crack width formula for transversely post- tensioned concrete deck slabs in box girder bridges [J]. ACI Structural Journal, 2009, 106(6): 753�C761.
[4] MOON D Y, SIM J, OH H. Practical crack control during the construction of precast segmental box girder bridges [J]. Computers & Structures, 2005, 83(31): 2584�C2593.
[5] SENNAH K M, KENNEDY J B. Literature review in analysis of box-girder bridge [J]. Journal of Bridge Engineering, 2002, 7(2): 134�C143.
[6] NG C K, TAN K H. Flexural behaviour of externally prestressed beams. Part I: Analytical model [J]. Engineering Structures, 2006, 28(4): 609�C621.
[7] NG C K, TAN K H. Flexural behaviour of externally prestressed beams. Part II: Experimental investigation [J]. Engineering Structures, 2006, 28(4): 622�C633.
[8] ARAVINTHAN T, WITCHUKREANGKRAI E. Flexural behavior of two-span continuous prestressed concrete girders with highly eccentric external tendons [J]. ACI Structural Journal, 2005, 102(3): 402�C411.
[9] DENG L, GHOSN M, ZNIDARIC A, CASAS J R. Nonlinear flexural behavior of prestressed concrete girder bridges [J]. Journal of Bridge Engineering, 2001, 6(4): 276�C284.
[10] ZHANG J R, PENG H, CAI C S. Destruction testing of a decommissioned reinforced concrete bridge [J]. Journal of Bridge Engineering, 2013, 18(6): 564�C569.
[11] PENG Hui, ZHANG Jian-ren, ZHANG Ke-bo, YIN Hai-xia. Experimental study of ultimate behavior of existing bridge using destructive testing [J]. Engineering Mechanics, 2011, 28(7): 186�C195. (in Chinese)
[12] ALKHRDAJI T. Destructive testing of a highway bridge strengthened with FRP systems [D]. Missouri: University of Missouri-Rolla, 2001.
[13] ROSCHKE P N, PRUSKI K R. Overload and ultimate load behavior of post-tensioned slab bridge [J]. Journal of Bridge Engineering, 2000, 5(2): 148�C155.
[14] ALLBRIGHT K, PAREKH K, MILLER R, BASEHEART T M. Modal verification of a destructive test of a damaged prestressed concrete beam [J]. Experimental Mechanics, 1994, 34(4): 389�C396.
[15] MILLER R A, AKTAN A E, SHAHROOZ B M. Destructive testing of decommissioned concrete slab bridge [J]. Journal of Structural Engineering, 1994, 120(7): 2176�C2198.
[16] AKTAN A E, LEE K L, NAGHAVI R, HEBBAR K. Destructive testing of two 80-year-old truss bridges [J]. Transportation Research Record, 1994, 1460: 62�C72.
[17] GB/T 50081�C2002. Standard for test method of mechanical properties on ordinary concrete [S]. (in Chinese)
[18] GB/T 228�C2002. Metallic materials-Tensile testing-Part 1: Method of test at room temperature [S]. (in Chinese)
[19] GB/T 5224�C2003. Steel strand for prestressed concrete [S]. (in Chinese)
[20] JTG D62�C2004. Code for design of highway reinforced concrete and prestressed concrete and prestressed concrete bridges and culverts[S]. (in Chinese)
(Edited by FANG Jing-hua)
Cite this article as:
CAO Guo-hui, ZHANG Wang, PENG Xi-rong, ZHANG Sheng. Flexural failure experiment on cracked PC simply supported box girders [J]. Journal of Central South University, 2017, 24(11): 2685�C2692.
DOI:https://dx.doi.org/https://doi.org/10.1007/s11771-017-3681-8Foundation item: Project(51551801) supported by the National Natural Science Foundation of China; Project(14JJ4062) supported by Natural Science Foundation of Hunan Province, China
Received date: 2016-05-24; Accepted date: 2016-09-10
Corresponding author: CAO Guo-hui, Professor, PhD; Tel: +86-737-4628808; E-mail: cgfcivil@163.com
Abstract: Long-term load and flexural failure experiments are carried out on two prestressed concrete (PC) simply supported box girders. In the long-term load experiment, girder-1 (G1) is in an elastic state, while girder-2 (G2) is in a cracking state. To investigate the influence of cracking on the flexural behaviors of PC simply supported box beams, the experiment results are analyzed from many aspects, such as load�Cdeflection, load�Cstrain, and failure mode. Experiment results show the following: 1) the shrinkage and creep of concrete have considerable influences on the long-term deflection and strain of the two girders; 2) in the flexural failure experiment, the cracks and ultimate loads of the two girders are close. The rigidity degeneration of G2 is significantly faster than that of G1, and thus G2 shows nonlinear characteristics earlier; 3) to prove the validity and rationality of the current code, the cracking load and ultimate load of the two girders are calculated according to the current code.
