

DSC study on temperature memory effect of NiTi shape memory alloy
N. LIU, W. M. HUANG
School of Mechanical and Aerospace Engineering, Nanyang Technological University, Singapore 639798
Received 10 April 2006; accepted 25 April 2006
Abstract:
A systematic study on the temperature memory effect (TME) in a polycrystalline NiTi shape memory alloy was presented. The investigation was carried out through a series of differential scanning calorimeter (DSC) tests. Two types of tests were conducted, namely single-step test and multi-step test. The influence of the step temperature on the peak/trough temperatures in the subsequent heating process and the associated energy absorption/release in the phase transformations was investigated. Using a simple theoretical model, the exact mechanism behind TME was studied.
Key words:
shape memory alloy; differential scanning calorimeter; temperature memory effect; phase transformation; energy absorption/release;
1 Introduction
An incomplete transformation in some shape memory alloys (SMAs) results in an interesting phenomenon, in which the previous temperature of interruption can be memorized and shown in the later on heating process [1]. Many different terms have been used for this phenomenon [2-5]. Temperature memory effect (TME) is one of them.
The previous study in the literature is largely focused on NiTi and NiTi based SMAs, and in particular, on the transformation from the low temperature martensite phase (M) to the high temperature austenite phase (A). However, upon cooling, in some NiTi based SMAs, there is an intermediate phase between A and M, called R-phase. R-phase does not occur upon heating, so that the transformation is from M to A directly.
Despite of the intensive investigation in the past, our understanding on the origin of TME is still limited. Furthermore, there is a lack of a systematic investigation on the influence of the step-temperature(s) on the peak/ trough temperatures and the energy absorption/release upon the phase transformations.
The aim of this work is to provide a better understanding on these issues mentioned above. This was done through a series of differential scanning calorimeter (DSC) tests together. Apart from the investigation on the DSC results, a simple analytical model was used to find the mechanism behind TME.
2 Experimental
An equal-atomic polycrystalline NiTi was used in the course of this study. The material, 0.55 mm diameter wire, was placed in an oven at 500 �� for 1 h. After the heat treatment, the wire was found with good shape memory. A small piece of sample, namely 7.11 mg in mass, was cut out of the wire for DSC test. In the course of this study, a Modulated DSC 2920 (with a standard cell) was used.
The applied heating/cooling rate was 10 ��/min in all tests. As shown in Fig.1, upon cooling, R-phase occurs first and then martensite follows. In the subsequent tests, the lowest temperature in cooling is -50 ��, which is below the martensite finish temperat-
ure (Mf) (refer to Fig.1). As such, the transformation in the sample was ensured between A and M. In each test, the sample was pre-heated to 150 �� to ensure that the material was pure austenite.
Two types of tests were carried out. The first type is multi-step test, and the other is single-step test.
In the multi-step tests, the numbers of interrupted temperatures were zero (0-step), one (1-step), three (3-step), five (5-step), nine (9-step), seventeen (17-step) and thirty-three (33-step), respectively. The exact preset step temperatures are listed in Table 1. In each test, the highest temperature in the subsequent thermal cycle is
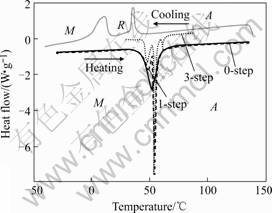
Fig.1 Typical DSC results
Solid line: completed DSC curve (0-step); dashed line: 1-step (final heating curve); dotted line: 3-step (final heating curve)
Table 1 List of step temperatures in all tests (unit: ��)
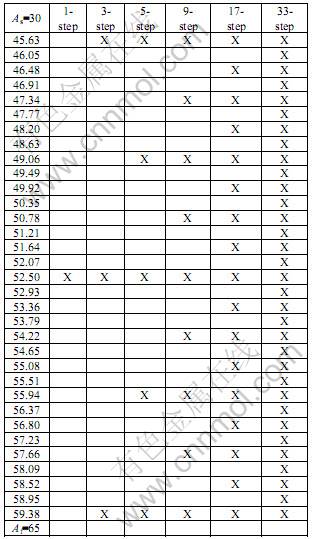
lower than that in the previous one.
In each single-step test, there is only one step temperature. Six tests were conducted and the step temperatures were 39.6, 42.2, 45.7, 52.7, 56.2 and 59.7 ��, respectively.
3 Results and discussion
Fig.1 plots some typical DSC results, and Fig.2 shows the results in the final heating process of all multi-step tests.
Some typical results of the single-step test in the first thermal cycle are plotted in Fig.3, while Fig.4 shows the DSC results of the single-step tests in the last heating process. Note that the step temperatures in the previous incomplete thermal cycles are marked and the exact step temperatures are indicated. The inserted figure is the zoom-in-view of the two cases in which the step temperatures are 39.6 �� and 42.2 ��, respectively. This is because the peak/trough temperatures of them are difficult to identify, if the same scale is used as for the rest.
Both Figs.2 and 4 plot the DSC results without any step for an easy comparison.
Based on Figs.2 and 4, the peak/ trough tempera- tures in each test are obtained. Fig.5 plots all the peal/
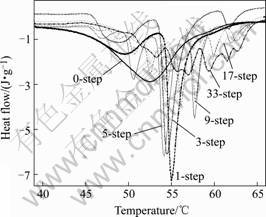
Fig.2 DSC results of last heating process
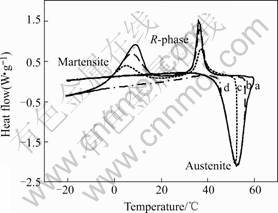
Fig.3 Typical DSC results of 1-step test in first thermal cycle
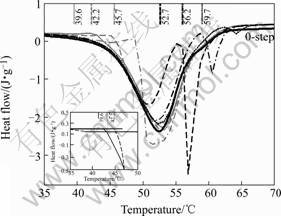
Fig.4 DSC results of 1-step tests in last heating process
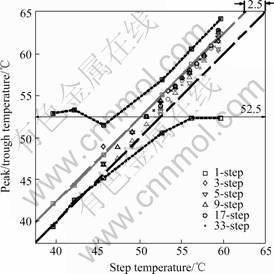
Fig.5 Curves of step temperature vs peak/trough temperature in all tests (black: peak; grey: trough)
trough temperatures against the corresponding step temperature in the previous thermal cycles. As shown in Fig.5, the symbols in black color are peaks, while these in grey color are troughs. It should be pointed out that in case that there are too many step temperatures, it becomes difficult to identify all the peak/trough temperatures. Hence, Fig.5 only includes those that can be determined.
As shown in Fig.5, the troughs in all single-step tests are about 2.5 �� higher than the previous step temperature. This is more or less similar to what has been reported in the literature, in which 2 �� higher is well observed.
In the cases of the multi-step test, as expected, the trough temperatures are also higher than the corresponding step temperature in the previous thermal cycle. However, most likely the difference is less than 2.5 ��. On the other hand, the peak temperatures are higher than the corresponding trough temperatures. But surprisingly, most of the peak temperatures in the multi-step tests are also about 2 �� higher than the corresponding step temperature in the previous thermal cycle.
Most of the previous experimental investigation shows that the start and finish transformation temperatures in the last heating process, i.e., the austenite start temperature (As) and austenite finish temperature (Af), in particular Af, may increase remarkably if TME occurs. This phenomenon is more remarkable in the multi-step cases.
However, according to Fig.6, in which As and Af are ploted against the temperature interval (Dt, which is the difference between the step temperatures in two continue thermal cycles) in the multi-step tests, Af does increase monotonically but in a rather gradual manner with the decrease of Dt, while As increases first and then decreases and eventually becomes pretty stable.
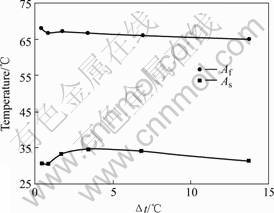
Fig. 6 Curves of As and Af vs Dt
Refer to Fig.4, the single-step cases, As seemingly increases by about 5 �� if the step temperature is very around the original As, while Af apparently increases by about 2.5 �� if the step temperature is very close to the original Af. A closer-look (inserted figure in Fig.4) reveals that the exact As does not really increase much from the original one. If the step temperature is far away from the original As and Af, the step temperature does not have any apparent influence on As and Af .
From the above observations, it appears that the influence of the step temperature is rather well confined within the original transformation range.
The area underneath a peak or trough indicates the energy release or absorption in a phase transformation. We calculate the areas of the troughs in the last heating process against Dt for all multi-step tests. Since it is somehow a bit arbitrary in determining the exact As and Af, a slight variation in the calculated area is unavoidable. Despite of this, as shown in Fig.7, the variation in area is neither significant nor monotonic, i.e., the absorbed energy does not change remarkably.
It is a standard approach to evaluate the transformation process in terms of the austenite fraction (xA) from a DSC result. As shown in Figs.8 and 9, we plot the areas in the transformations from A?R and R?M (cooling part of the first thermal cycle) against xA,
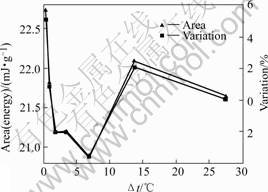
Fig.7 Curves of area (energy) and variation (taken area of 0-step as reference) vs Dt
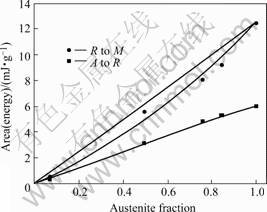
Fig.8 Curves of areas (energies) in transformations of A?R and R?M against xA in 1-step test
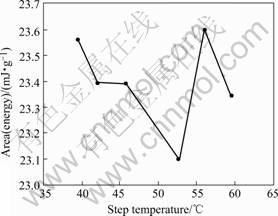
Fig.9 Curve of area (energy) in M?A transformation against step temperature in 1-step test
and area in M?A transformation (last heating) against the step temperature in the single-step tests.
Fig.8 shows that the area in the R?M transformat-
ion is about a linear function of xA. However, the area in the A?R transformation is not. Our previous investigation [6] on the transformation between A and R indicated that the TME still occurs in the A?R transformation in this SMA, but is almost negligible.
On the other hand, Fig.9 shows that the absorbed energy is more or less a constant.
From Figs.8 and 9, and together with Fig.3, it may be concluded that in this SMA, TME does not affect the associated energy requirement in all transformations significantly and its influence on the start/finish temperatures of all phase transformations is limited.
4 Mechanism for TMEFor simplification, it considered that the transformation is between A and M. The transformation conditions follow those proposed in Ref.[7]. The DSC result is assumed to be ideal as illustrated in Fig.10 (top part) in thin grey lines. Subsequently, one can get the transformation progress in term of either martensite fraction (xM) or xA (in Fig.10, bottom part, thin grey lines). If one stops heating at ts, which is at the peak of the DSC heating curve, and then cools down to below Mf, during subsequent heating, a jump in the DSC heating curve is formed, which is right at the position where ts is.
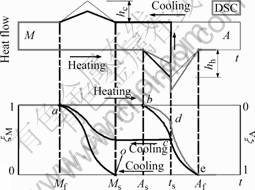
Fig.10 Schematic model
This particular case demonstrates the basic mechanism behind the TME effect. However, the real situation is more complicate, for instance, at the austenite/marteniste inter-phase, some elastic energy may be registered as evidenced by the nonlinear relationship between the area in the A?R transformation against xA in Fig.8. The elastic energy in the inter-phase produces a local elastic field and affects the transformation progress. As such, in the final heating process, a peak is resulted at a temperature slightly above ts.
5 ConclusionsIn this work, we present a series of DSC results of a NiTi SMA and investigate the influence of the step temperature on TME. We found that the step temperature does not alter the transformation temperatures remarkably. The trough temperature in the later on heating process is about 2.5 �� higher than the previous step temperature in both the single-step and multi-step tests. TME does not significantly change the energy absorption for the phase transformation in the final heating process, which indicates that TME is a local phenomenon, largely caused by the energy at the inter-phase. By applying a simple model, we reproduce a significant jump due to TME in the DSC curve.
References
[1] MADANGOPAL K, BANERJEE S, LELE S. Thermal arrest memory effect[J]. Acta Metall Mater 1994, 42: 1875-1885.
[2] AIROLDI G, CORSI A, RIVA G. Step-wise martensite to austenite reversible transformation stimulated by temperature or stress: a comparison in NiTi alloys[J]. Mater Sci Eng A,1998, 241: 233-240.
[3] HE XM, RONG LJ, YAN DS, LI YY. Temperature memory effect of Ni47Ti44Nb9 wide hysteresis shape memory alloy[J]. Scripta Mater 2005, 53: 1411-1415.
[4] MADANGOPAL K. New observations on the thermal arrest memory effect in Ni-Ti alloys[J]. Scripta Mater, 2005, 53: 875-879.
[5] WANG ZG, ZU XT. Incomplete transformation induced multiple-step transformation in TiNi shape memory alloys[J]. Scripta Mater, 2005, 53: 335-339.
[6] LIU N, HUANG W M. Comments on ��Incomplete transformation induced multiple-step transformation in TiNi shape memory alloys��[J]. Scripta Mater, 2006, in revision.
[7] AN L, HUANG W M. Transformation characteristics of shape memory alloys in a thermal cycle[J]. Mater Sci Eng A, 2006, 420: 220-227.
Corresponding author: HUANG W M; Tel: +65-67904859; Fax: +65-67911859; E-mail: mwmhuang@ntu.edu.sg
