
J. Cent. South Univ. (2013) 20: 337�C341
DOI: 10.1007/s11771-013-1493-z

Purification of indium by vacuum distillation and its analysis
LI Dong-sheng(���)1,2,3, DAI Yong-nian(������)1,2,3, YANG Bin(���)1,2,3,
LIU Da-chun(����) 1,2,3, DENG Yong(����) 1,2,3
1. National Engineering Laboratory for Vacuum Metallurgy,
Kunming University of Science and Technology, Kunming 650093, China;
2. State Key Laboratory Breeding Base of Complex Nonferrous Metal Resources Clear Utilization in
Yunnan Province, Kunming 650093, China;
3. Faculty of Metallurgy and Energy, Engineering Kunming University of Science and Technology,
Kunming 650093, China
 Central South University Press and Springer-Verlag Berlin Heidelberg 2013
Abstract:
High purity (99.999% or 5N, mass fraction) indium (In) was obtained through vacuum distillation using a 2N (99%) In as input material under a dynamic vacuum of 5 Pa. The glow discharge mass spectrometry (GDMS) was applied for the analysis of input material and the distilled indium. The results indicate that high-volatile impurities namely Cd, Zn, Tl and Pb can be removed from the indium matrix at the low fraction stage of 1 223 K for 120 min; Low-volatile impurities such as Fe, Ni, Cu, Sn can be reduced at the high fraction stage of 1 323 K for 120 min. The separation coefficient ��i and activity coefficient ��i of impurities are calculated according to the experiments to fill the inadequate data of the thermodynamics.
Key words:
vacuum distillation; indium; separation; refining��
1 Introduction
Indium is a metallic element in the IIIA column of the periodic table and is incorporated into III�CV compound semiconductor materials, such as indium arsenide (InAs) and indium phosphide (InP) [1]. It has emerged as an important strategic metal that is extensively used in electrical industries for its excellent chemical, physical and mechanical performances [2]. Indium and its compounds have numerous industrial applications, and it is extensively used in the manufacture of liquid crystal displays, semiconductors, low-temperature solders and infrared photo-detectors [3�C4]. The major uses are derived from indium metal, its alloys and indium-tin oxide (ITO) [5]. More than one-half of the world��s indium consumption is for indium-tin oxide (ITO) coatings. ITO, which is a sintered alloy containing a large portion of indium oxide and a small portion of tin oxide, is an optically transparent conductor and is used in making thin-film transistor liquid crystal displays (TFT-LCDs) for television screens, portable computer screens, cell phone displays and video monitors [6�C10].
The demand for the preparation of ultra high purity (UHP) In has been primarily promoted by the recent developments in semiconductor industry. The residual impurities even in less than 10�C6 level concentration in semiconductor materials play a major role in the electronic properties by creating deep energy levels [11�C12]. The preparation of UHP metals requires first to get a basic knowledge of the identity and the concentrations of impurities present in the starting material, which is normally a commercial grade material. Subsequently, schemes for purification by multistage processes need to be worked out, such as hydro-chemical processing, electrolysis, ion-exchange, solvent extraction, vacuum refining, zone refining and electron migration, [13�C16]. Both vacuum distillation and zone refining processes have distinct purification roles. Vacuum distillation is more viable than the time consuming zone refining, because a higher purification yield is reached in less time [17�C18].
In this work, indigenous indium was used as input material and vacuum distillation process was firstly alone employed to prepare 5N indium. This is a new process and a new technology that has the advantages of shorter flow-sheet, pollution-free and lower energy consumption.
2 Theoretical basis
The difference in vapor pressure of each metal at different temperatures was the basic principle of crude metal vacuum distillation [19]. The relationships between vapor pressure (p/Pa) of pure metals in the crude indium and temperature (T/K) are listed as
lgpCd =�C5 819T�C1�C1.257lgT+14.412 (594�C1 050K) (1)
lgpZn =�C6 620T�C1�C1.255gT+14.465 (692�C1 180K) (2)
lgpTl =�C9 300T�C1�C0.892gT+13.225 (700�C1 800K) (3)
lgpPb=�C10 130T�C1�C0.985lgT+13.285 (600�C2 023K) (4)
lgpIn =�C12 580T�C1�C0.45lgT+11.915 (429�C2 346K) (5)
lgpSn=�C15 500T�C1+10.355 (504�C2 876K) (6)
lgpCu=�C17 520T�C1�C1.21lgT+15.335 (1 357�C2 836K) (7)
lgpFe=�C19 710T�C1�C1.27lgT+15.395 (1 811�C3 135K) (8)
lgpNi=�C22 400T�C1�C2.01lgT+19.075 (1 728�C3 187K) (9)
The saturated vapor pressure of indium and other impurities under different temperatures were calculated. And they are shown in Fig.1. It was indicated that the saturated vapor pressure of Pb, Cd, Zn and Tl was higher than that of indium. These impurities with low boiling point could volatilize prior to indium during distillation. On the contrary, the saturated vapor pressure of Sn, Fe, Cu and Ni was lower than that of indium. The impurities with high boiling point would remain in residual and indium would volatilize. So, a two-step distillation method was adopted to obtain the high purity indium.
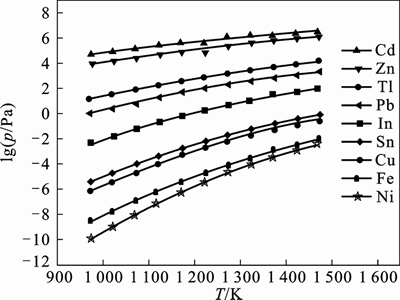
Fig. 1 lg p�CT plot of indium and impurities
3 Experimental
The vacuum distillation system consisted of an evaporator, that was made up of an isostatic fine grain high-density graphite crucible in the cylindrical shape of dimensions 50 mm��40 mm��80 mm (outer diameter�� inner diameter��height). The condenser was made up of stainless steel comprising of water cooled tubes to collect the distillate. The diagram of vacuum furnace along with
crucible, condenser and pit retort is shown in Fig.2. The crude indium to be distilled was kept in the graphite crucible and placed in the retort that was closed with condenser. The furnace was evacuated for about 3 h at 673 K to remove any moisture. A dynamic vacuum level of approximate 5 Pa was maintained in the vacuum furnace containing graphite crucible and collector using appropriate combination of rotary and diffusion pumps. As the temperature inside the chamber surpassed the boiling point, the material started evaporating and condensed at the bottom of cooled collector placed on top leaving high melting point. The experiment was conducted in two steps. In the first phase, called as low fraction stage, the distillation experiment was carried out at a comparatively lower temperature 1 223 K to remove high-volatile impurities. As the temperature in the chamber ceased to room temperature, the condenser was cleaned off. Then the balance indium material in the graphite crucible was used in the second phase, called as high fraction stage. Distillation temperature about 1 323 K was maintained for second phase and indium was condensed with variable time factors. The experimental flow sheet is shown in Fig. 3. The material left in the bottom of the crucible after high fraction experiment was called the ��Residue��. Samples
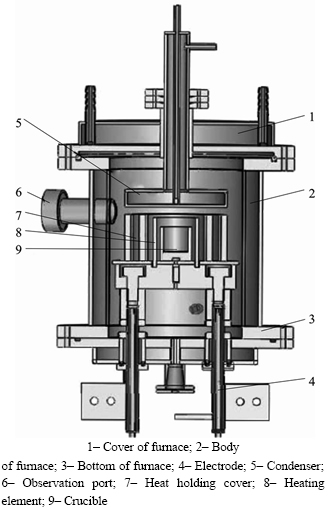
Fig. 2 Experimental equipments:
of condensate were collected at time intervals of 60, 90, 120 and 150 min in the case of low fraction experiment and 60, 120, 180 and 240 min in the case of high fraction experiment, after the melt attained the respective distillation temperature.
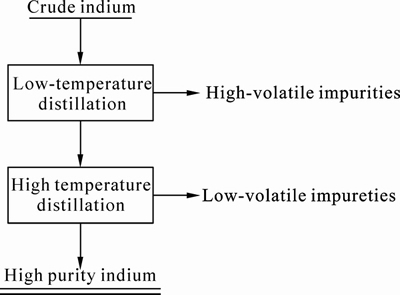
Fig. 3 Experimental flow sheet of vacuum distillation
The analytical characterization for 5N or higher purity indium is not a simple task, since very low detection limit for the majority of elements are required. The development of glow discharge mass spectrometers (GDMS) enables an analyst to routinely achieve ultra-low detection limits, down to parts per trillion (ppt) in the solid, with a minimum of sample preparation effort. Almost all elements present in a solid sample can be detected and routinely quantified. The glow discharge mass spectrometers (GDMS) is shown in Fig. 4.
4 Results and discussion
4.1 Results of GDMS
The vacuum distillation results were studied for most common impurities in indium. The impurities
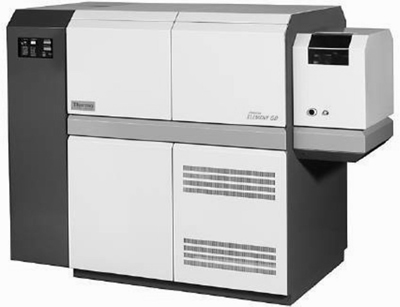
Fig. 4 Glow discharge mass spectrometers (GDMS)
contents in the input material and the vacuum distilled indium are given in Table 1. The values showed the compiled average analysis for a large number of samples around 20 experiments. Impurities C, O, and N were not shown in the analysis results, since the nonmetal elements including C, O, N can not be analyzed precisely by GDMS and C, O, N were not contained in the national standard In-05.
4.2 Behaviors of Cd, Zn, Tl, Pb in vacuum distillation of low fraction stage
The low fraction stage was carried out at time intervals of 60, 90, 120 and 150 min and it was found that in the case of distilling time of 60 min, the impurities were partially evaporated whereas as for 150 min, 21% of the material got evaporated which was not expected in the low fraction experiment. Further increase in temperature and time caused degradation in the purity of distilled indium. Thus, the distilling time of 120 min was the optimum where 17% of the material got
Table 1 Analytical data of vacuum distilled indium (10�C6, mass fraction)
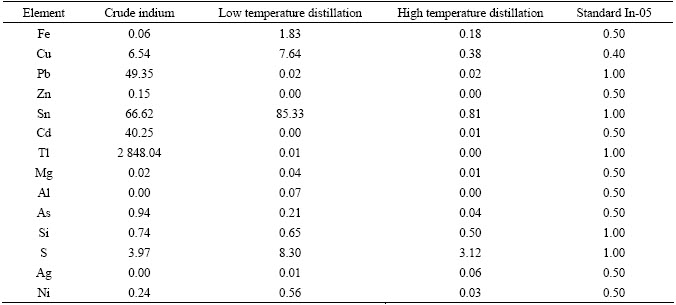
evaporated, which implied that not much indium was evaporated. From the analysis data of the experiment, it can be seen that the contents of Cd and Zn were almost undetectable, the content of Tl content was 10�C8, and the content of Pb was 2��10�C8 in the residue. This is because the saturated vapor pressure of Cd and Zn was 100 000 times higher than that of indium, and the saturated vapor pressure of Tl and Pb was only 90 times higher than that of indium at distillation temperature of 1 223 K. So, the contents of Tl and Pb were higher than those of Cd and Zn in the process of low fraction stage. But all the high-volatile impurities (Cd, Zn, Tl, Pb) can be drastically reduced to the standard of In-05 at 1 223K for 120 min.
4.3 Behaviors of Fe, Cu, Sn, Ni in vacuum distillation of high fraction stage
The impurities such as Fe, Cu, Sn, Ni were found difficult to be separated from indium matrix at low temperature. This can be attributed to the differences of the vapor pressures. So, if we want to remove the low-volatile impurities, higher temperature would be needed. When the temperature surpassed the boiling point of indium, the pure indium was evaporated and collected at the condenser, then the low-volatile impurities were remained in the bottom of crucible. The high fraction stage was carried out at 1 323 K and it was found that in the case of distilling time of 60 min, the material evaporation rate was too low to analyze, and when the time was 120 min, the evaporation rate reached 90%. It was seen from the analytical data that the impurities namely Ni, Fe, Cu and Sn were considerably removed in the distillated material, and the contents of them were found to be 3��10�C8, 1.8��10�C7, 3.8��10�C7 and 8.1��10�C7, respectively. All the low-volatile impurities can meet the demand for 5N indium compared to the standard of In-05. Since the saturated vapor pressure of Ni and Fe was almost 10 000 times lower than that of indium, and the saturated vapor pressure of Cu and Sn was 150 times lower than that of indium at distillation temperature of 1 323 K, there would be a little of Cu and Sn volatilized along with indium, and then condensed in the distilled indium. So, the contents of Cu and Sn were slightly higher than those of Ni and Fe among the low-volatile impurities.
4.4 Calculated evaporation rate of indium
The efficiency of purifying indium by vacuum distillation depended on evaporation rate, transportation of vapor, condensation and solidification. In addition, vacuum level, material of crucible, heating and cooling cycles of distilled indium also influenced on deciding optimum distillation process parameters. The initial evaporation rate We is calculated to be 0.170 5 g/(cm2��s) using formula We=5.83��10�C2p(M/T)1/2f , where p is vapor pressure at 1 323 K, M is molecular mass of In (115 g/mol), T is the soaking temperature (1 323 K) and f is the probability of In molecule remained on the surface which is taken as nearly unity [20].
The actual average evaporation rate (Wd) calculated from experiments (2.54��10�C4 g/(cm2s)) was around three orders less than the theoretically calculated value. The reasons could be manifold. The appearance of gradients of concentration, temperature and decrease in pressure inside the evaporating melt caused, in turn, a drop in degree of separation of components and the evaporation rate. These conditions rendered difficulties in the deduction of kinetic equations for calculating the rate and the duration of vacuum distillation. This explained the fact that the average evaporation rate was much less than the value calculated above. In addition, the slight increase in evaporation rate at the consecutive distillation stage was in agreement with the higher purity obtained.
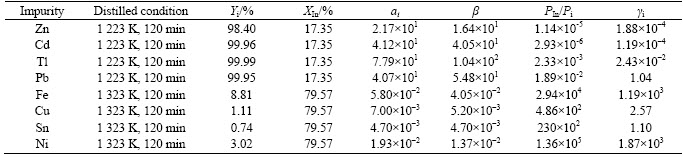
4.5 Calculated ��i and ��i of impurities according to experiments
From Ref. [21], it can be seen that ��i is the separation coefficient of A, which can be used to determine whether element A can be separated from A-In binary alloys by vacuum distillation. It is a function of the concentration for elements in the two phases, which is related to the activity coefficients and vapor pressures of the substances:
 (10)
(10)
where pIn and pi are the actual vapor pressures of In and impurity; ��In and ��i are the activity coefficients of indium and impurity, respectively. ��In��1 is presumed, since the mass fraction of indium is 99.7%.
And ��i can be also described by the evaporation coefficient and the relative molecular mass as
 (11)
(11)
where Ar(i) is the relative molecular mass of impurity, and Ar(In) is the relative molecular mass of indium.
The relationship between evaporation percentage of impurity and evaporation percentage of indium can be described as
 (12)
(12)
where Yi is the evaporation percentage of impurity, XIn is the evaporation percentage of indium, and ai is the evaporation coefficient [21].
The ��i and ��i of impurities in the crude indium can be calculated according to Eqs. (10), (11) and (12). The results are listed in Table 2.
Table 2 Calculated data of impurities in vacuum distilled indium
5 Conclusions
1) The average content of impurity elements of indigenous crude indium has been reduced, by employing the two-step vacuum distillation method, to the extent of achieving 5N indium under dynamic vacuum of 1�C5 Pa.
2) High-volatile impurities namely Cd, Zn, Tl and Pb can be removed from the indium matrix at the low fraction stage of 1 223 K for 120 min; Low-volatile impurities such as Fe, Ni, Cu and Sn can be reduced at the high fraction stage of 1 323 K for 120 min.
3) The separation coefficient ��i and activity coefficient ��i of impurities are calculated according to the experiments to fill the inadequate data of the thermodynamics.
Nomenclature
We:
initial evaporation rate
Wd:
average evaporation rate
Yi:
evaporation percentage of impurity
XIn:
evaporation percentage of indium
Ar (i):
relative molecular mass of impurity
Ar (In):
relative molecular mass of indium
��i:
separation coefficient
��i:
activity coefficient
ai:
evaporation coefficient
References
[1] SAMI V, DON I, ERKKI P. Recovery of indium from indium tin oxide by solvent extraction [J]. Hydrometallurgy, 2011, 107: 56�C61.
[2] KWAK N S, BAEK Y, TAEK S H. The synthesis of poly microbeads by suspension polymerization and the characterization of their indium adsorption properties [J]. Journal of Hazardous Materials, 2012, 203: 213�C220.
[3] ELANGOVAN E, GONCALVES G, MARTINS R, FORTUNAT O E. Sputtered wide work function indium molybdenum oxide thin films for solar cell applications [J]. Solar Energy, 2009, 83: 26�C731.
[4] TAKASHI O, KOSHIRO T, NORIZOH S, ARUMI H, YASUHIRO K. Recovery of indium from aqueous solutions by the Gram-negative bacterium Shewanella algae [J]. Biochemical Engineering Journal, 2012, 63: 29�C133.
[5] HSIEH S J, CHEN C C. Process for recovery of indium from ITO scraps and metallurgic microstructures [J]. Materials Science and
Engineering, 2009, 158: 82�C87.
[6] CHOU Wei-lung, HUANG Yen-hsiang. Electrochemical removal of indium ions from aqueous solution using iron electrodes [J]. Journal of Hazardous Materials, 2009, 172: 46�C53.
[7] NIGEL J C, CRISTIANA L C, TIMOTHY W. The mineralogy and mineral chemistry of indium in sulphide deposits and implications for mineral processing [J]. Hydrometallurgy, 2011, 108: 226�C228.
[8] SUJATHA C, RAO G M, UTHANNA S. Characteristics of indium tin oxide films deposited by bias magnetron sputtering [J]. Mater Sci Eng, 2002, 94: 106�C110.
[9] TSAI H Y, YANGM H, PAN C T, CHOU M C. Laser patterning indium (ITO) coated on PET substrate [J]. Proc SPIE, 2000, 4230: 156�C163.
[10] MEDVEDOVSKI E, ALVAREZ N, YANKOV O, OLSSON M K. Advanced indium-tin oxide ceramics for sputtering targets [J]. Ceramics International, 2008, 34: 1173�C1182.
[11] MATHEW M, GOPINATH M, KARTHA C S, VIJAYAKUMAR K P, KASHIWABA Y. Tin doping in spray paralyzed indium sulfide thin films for solar cell applications [J]. Solar Energy, 2010, 84: 888�C897.
[12] RAHEL S, YVES P, DANICK B, NICO F, ROODI D. Evaluation of thin film indium bonding at wafer level [J]. Procedia Engineering, 2011, 25: 1493�C1496.
[13] CHEN Wei-liang, CHAI Li-yuan, MIN Xiao-bo, PENG Bing, ZHANG Chuan-fu, DAI Yong-nian. Recycling of valuable metals from spent zinc-manganese batteries by vacuum metallurgy [J]. Transactions of Nonferrous Metals Society of China, 2003, 13(5): 1213�C1216.
[14] XIONG Li-zhi, HE Ze-qiang, LIU Wen-ping, MA Cheng-jin, DAI Yong-nian. Preparation of high-purity bismuth by sulphur deleadization in vacuum distillation [J]. Transactions of Nonferrous Metals Society of China, 2004, 14(6): 1210�C1214.
[15] DU Guo-shan, YANG Bin, DAI Yong-nian. Removal of Cd, Zn, Tl and Pb from Indium by vacuum distillation [J]. Yunnan Chemical Technology, 2006, 6 (33): 28�C31.(in Chinese)
[16] PRASAD D S, MUNIRATHNAM N R, RAO J V, PRAKASH T L. Purification of tellurium up to 5N by vacuum distillation [J]. Materials Letters, 2005, 6(1): 2035�C2038.
[17] WAN wen. Study on purification of crude selenium by vacuum distillation [D]. Kunming: Kunming University of Science and Technology, 2006.
[18] LEE M S, SOHN K Y. Comparison of indium purification between vacuum refining and electiowinning [J]. Journal of materials science, 2003, 38: 4843�C4848.
[19] DAI Yong-nian, YANG Bin. Vaccum metallurgy of Nonferrous metal materials [M]. Beijing: Metallurgical industry Press, 2000: 20�C21.
[20] SUDHEER C, REDDY R C, PRAKASH T L. Purification of cadmium by vacuum distillation and its analysis [J]. Materials Letters, 2004, 58(10): 1638�C1641.
[21] WANG Lin, LIU La-chun, YANG Bin, LI Xue-peng, XU Bao-qiang. Purification of crude nickel by vacuum distillation [J]. Chinese Journal of Vacuum Science and Technology, 2010, 30(3): 283�C287.(in Chinese)
(Edited by HE Yun-bin)
Foundation item: Project(2009AA003) supported by Science and Technology Innovation Plan of Yunnan Province, China
Received date: 2011�C12�C09; Accepted date: 2012�C04�C10
Corresponding author: YANG Bin, Professor, PhD; Tel: +86�C871�C5161583; E-mail: kgyb2005@163.com
Abstract: High purity (99.999% or 5N, mass fraction) indium (In) was obtained through vacuum distillation using a 2N (99%) In as input material under a dynamic vacuum of 5 Pa. The glow discharge mass spectrometry (GDMS) was applied for the analysis of input material and the distilled indium. The results indicate that high-volatile impurities namely Cd, Zn, Tl and Pb can be removed from the indium matrix at the low fraction stage of 1 223 K for 120 min; Low-volatile impurities such as Fe, Ni, Cu, Sn can be reduced at the high fraction stage of 1 323 K for 120 min. The separation coefficient ��i and activity coefficient ��i of impurities are calculated according to the experiments to fill the inadequate data of the thermodynamics.
