
J. Cent. South Univ. Technol. (2008) 15: 251-255
DOI: 10.1007/s11771-008-0047-2
![]()
Application of deviation rate in oil and gas reservoir exploration
TANG Jing-tian(������)1, ZHANG Ji-feng(�ż̷�)1, FENG Bing(�� ��)2 ,WANG Ye(�� ��)1
(1. School of Info-physics and Geomatics Engineering, Central South University, Changsha 410083, China;
2. College of Geology Engineering and Geomatics, Chang��an University, Xi��an 710054, China)
Abstract:
Three dimensional geophysical models were abstracted and established according to characteristics of oil and gas reservoir. Then direct current fields for different models were simulated with finite element software (finite element program generator) by hole-to-surface resistivity method. Numerical solution was compared with analytical one for the homogeneity earth model. And a new parameter of deviation rate was proposed by analyzing different plot curves. The results show that the relative error of solution for homogeneity earth model may attain to 0.043%. And deviation rate decreases from 18% to 1% and its anomaly range becomes wide gradually when the depth of oil and gas reservoir increases from 200 to 1 500 m. If resistivity ratio of oil and gas reservoir to sur- rounding rock decreases from 100 to 10 for the resistive oil and gas reservoir, the amplitude attenuation of deviation rate nearly reaches 8%. When there exists stratum above oil and gas reservoir, and influence of resistive stratum may be eliminated or weakened and anomaly of oil and gas reservoir can be strengthened.
Key words:
1 Introduction
It has been an arduous duty for a long time for petroleum prospecting workers to enhance the success ratio of drilling hole, speed up the exploration pace and reduce the exploration cost. Still, effective method is starved for solving special modality of the complex oil and gas reservoir, which results in many wells deserted. So in this paper deviation rate was proposed and used to improve exploration ability for oil and gas reservoir.
Because oil and gas reservoir is generally buried at deep place on the subsurface, surface electrical resistivity method does not work well[1]. Hole-to-surface method in which the point source is placed at the near target region in a hole can detect anomalous body and maximize signal about inhomogeneous body in the vicinity of a borehole, so it is an effective method to explore for deep objects[2-5]. This method has been researched by many scholars. In 1958, Russian implemented this method to determine horizontal boundary of the coal bed, and carried out some field test researches and yielded the preliminary results. BEVC and MORRISON[1] made a salt water injection experiment by bore-to-surface electrical resistivity method. ZHANG et al[6-7] discovered small reservoir in Sinkiang using groundborehole trielectrode gradient method and proposed a non-boundless trielectrode profiling method to find deep resistive oil and gas reservoir and determined its border. HE and LIU[8] employed hole-to-surface method to transmit the varied squared wave current, referred the case of oil and gas reservoir and located its range and border according to layer resistivity and layer polarization, and achieved effective results. WANG et al[9-11] implemented water trough simulation, in which power was supplied through the steel tube well, and studied the anomaly rule of the ground isoclines, which provided physical base to determine the distributed scope of different reservoirs.
Many problems on geophysics have not analytical solutions, so numerical simulation of finite element becomes a popular and effective method to solve them[12-14]. In this work, direction current fields for different models were simulated by finite element program generator[15], and a new parameter of deviation rate was proposed by analyzing different plot curves.
2 Theory
2.1 Definition of deviation rate
Fig.1 shows the basic principle of hole-to-surface resistivity method. A current source electrode is placed at the appropriate location that is either under oil and gas reservoir or above it in a well, while the other is placed at ��infinity��. Electrical potential is acquired by electrode M on the ground when plot lines are at the center of the

Fig.1 Schematic diagrams of hole-to-surface resistivity method (M��Electrical electrode of measurement; ��s��Apparent resistivity; A��Point source): (a) Section view; (b) Plane view
mouth of a well. This method can detect deep anomaly body on the subsurface by apparent resistivity anomalies.
In order to analyze the difference of a current source electrode placed under oil and gas reservoir and above it, a new parameter of deviation rate(Q) is defined as
![]() (1)
(1)
where ��sa and ��su are the apparent resistivities when a current source electrode is placed above oil and gas reservoir and under it, respectively, ��b is background resistivity.
Theoretically, when a current source electrode is placed under oil and gas reservoir, as a result of shielding role of resistive oil and gas reservoir, current density on the surface is smaller than that of background field, and the minimum value occurs on apparent resistivity curve; on the contrary, when a current source electrode is placed above oil and gas reservoir, as a result of repulsion role of resistive oil and gas reservoir, current density on the surface is larger than that of background field and the maximum value occurs on apparent resistivity curve. Thus, for existence of oil and gas reservoir, deviation rate may increase anomaly amplitude of oil and gas reservoir; for none of oil and gas reservoir, deviation rate should approach to zero.
2.2 Weak solution integral form of differential equation over direct current field
In the rectangular Cartesian coordinate system, the three dimensional partial differential equation of the direct current field is[16]
 (2)
(2)
where �� is conductivity, U is electrical potential, I is electric current, and xA, yA and zA are the coordinate components of point A.
Boundary conditions are as follows:
![]() 1) r����, U=0, where r is distance between current source point and receiver point. Electrical potential at ��infinity�� is equal to zero.
1) r����, U=0, where r is distance between current source point and receiver point. Electrical potential at ��infinity�� is equal to zero.
2) ![]() where Jn is current density,
where Jn is current density,
�� is resistivity. The current density at normal component on the ground is equal to zero.
The interior boundary condition is the natural boundary condition, so it is not considered here.
Laplacian equation is applied in the solution domain except the point source, therefore, Eqn.(2) becomes
![]() (3)
(3)
According to variational principle, Eqn.(3) may become its weak solution integral form:
![]() (4)
(4)
2.3 Numerical calculation and error analysis
A three dimensional computational program was developed to compute apparent resistivity with hole-to- surface method according to Eqns.(2)-(4) by finite element program generator (the finite element software of Flying Arrow Company)[15]. By comparing the analytical solution with numerical solution of simple models, the error of numerical by FEM is analyzed.
The finite element solution and the analytical solution are calculated respectively and compared with the uniform half space, and the precision conforms to requirement. Fig.2 shows section plot under the homogeneous earth, when the current source electrode is placed at depth of 600 m in the subsurface. In order to calculate conveniently and control the nodes, the hexahedron model of 2 000��2 000��1 600 is selected, with grid size of 50��50��50. After computation, its average relative error is 0.043% and maximal relative error is 0.18%.

Fig.2 Electrical potential profile of current source electrode placed at subsurface
3 Simulations and deviation rate analysis
3.1 Geophysical model of oil and gas reservoir
Oil and gas reservoir is the basic unit of the oil and gas accumulated in the earth��s crust, and it has the uniform pressure system and the oil-water interface. Most of the petroleum hydrocarbons moving are trapped by nonporous rocks or other barriers that would not allow it to migrate further, thus oil and gas reservoir is formed. Most reservoirs contain oil, gas and water. Gravity acts on the fluids to try to separate them in the reservoir according to their density, with gas being on top, then oil and then water. In general, these interfaces are often approximate to the level and horizontal projection lines over oil and gas interface, and oil and water interface are often parallel with contour line of structure approximately, as shown in Fig.3. This model may be abstracted as the lamellose body in the homogeneous semi-infinite space, as shown in Fig.4.

Fig.3 Schematic diagram for oil and gas reservoir
3.2 Deviation rate analysis for results of numerical simulation
3.2.1 Model of borehole encountering center of oil and gas reservoir
The resistivities of the oil and gas reservoir and surrounding rock are 500 and 80 ��?m, respectively. Current source electrode is at the depth of 5 m above the
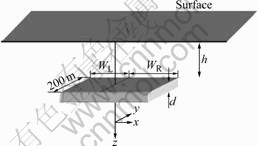
Fig.4 Finite element model of borehole located at center of oil and gas reservoir (WL=WR=100 m, d=10 m, h=200 m or 600 m or 1 500 m)
oil and gas reservoir or under it. Hexahedron is selected and the grid size is 50��50��5 in 10 m range over the object body and 50��50��50 in other regions.
It can be seen from Fig.5 that the apparent resistivity responses show great differences, and their shape takes on symmetrical distribution in the background field approximately. When current source electrode is placed above oil and gas reservoir, the apparent curve gets the maximum value because of the repulsion role of resistive oil and gas reservoir for electric current; when current source electrode is placed under resistive oil and gas reservoir, the apparent curve has the minimum value. Peak value is reduced with increasing buried depth of oil and broadening gas reservoir and anomaly range. The shape of deviation rate curve is similar to the apparent curve when current source electrode is placed above oil and gas reservoir (see Fig.6), and the amplitude is greater and is almost equal to sum of the amplitude of the apparent curve above and under oil and gas reservoir, the resolution is higher obviously compared with Fig.5.

Fig.5 Apparent resistivity response when current source electrode placed above and under oil and gas reservoir
The extreme value and steepness of deviation rate curve may be influenced by the depth of oil and gas reservoir. When the depth of oil and gas reservoir is 200
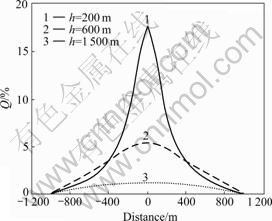
Fig.6 Deviation rate curves of oil and gas reservoir with different depths
m, deviation rate reaches 18%, and when the buried depth is 1 500 m, the maximum value is only about 1%. For the latter, the curve changes extremely mild mainly because the object body is relatively small. In numerical simulation process, in order to enhance computation speed and reduce computation time, the object body should be small, and grid cutting should be sparse relatively.
3.2.2 Model of different ratio between oil and gas reservoir and surrounding rock
Model was built and meshed with hexahedrons (see Fig.7).
From Fig.8, it can be seen that with the decrease of �� (resistivity ratio of oil and gas reservoir to surrounding rock), the maximum value of deviation rate becomes small gradually. When �� is larger than 1.00, deviation rate changes obviously, and if resistivity ratio of oil and gas reservoir to surrounding rock decreases from 100 to 10 for resistive oil and gas reservoir, amplitude attenuation of deviation rate is nearly 8%. When �� is smaller than 1.00, the two deviation rate curves are similar, which indicates that deviation rate is very sensitive to resistive anomalous body, but not sensitive to conductive one.
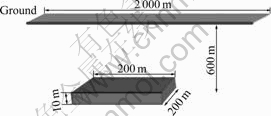
Fig.7 Schematic diagram of model under different resistivity ratios of oil and gas reservoir to surrounding rock
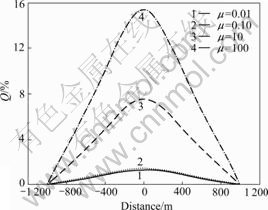
Fig.8 Deviation rate curves at different resistivity ratios of oil and gas reservoir to surrounding rock
3.2.3 Model with one resistive layer
Fig.9 shows a finite element model with one layer. There exists a depth of 100 m with layer under which there is a anomaly body in uniform half space. The resistivities for layer, anomaly body and uniform half space is 200, 500 and 80 ��?m, respectively. Mesh and other parameters are similar to previous one. As shown in Fig.10, the deviation rate changes very small when there exists a resistive layer above oil and gas reservoir. Although the resistivity of a layer is relatively large, the deviation rate is almost not disturbed by virtue of its characteristic. The results shows that the deviation rate can weaken resistive layer above anomaly body, so strong anomaly may be obtained. It is very important for us to explore deep object body. And it should be noted

Fig.9 Schematic diagram for one resistive medium layer model

Fig.10 Deviation rate curves for model with and without one layer of resistive medium
that deviation rate is invalid for conductive layer because of its suction for current.
4 Conclusions
1) The amplitude of anomaly is increased greatly by the deviation rate in hole-to-surface resistivity method. If the current source electrode is placed above resistive oil and gas reservoir and under it, respectively, the amplitude of anomaly may be increased obviously by deviation rate for resistive oil and gas reservoir, even to about twice.
2) Deviation rate is very sensitive to resistive object body. When resistivity ratio of oil and gas reservoir to surrounding rock is larger than 1.00 and it is changed by 1/10, the deviation rate changes sharply and amplitude change of deviation rate nearly approaches 8%.
3) When there exists a resistive layer for homo- genous half space, resistive layer above anomaly body can be weakened and relatively strong anomaly can be obtained by using deviation rate. So it is feasible under certain geology and geophysics condition and can provide theoretical instruction in the actual work.
References
[1] BEVC D, MORRISON H F. Borehole-to-surface electrical resistivity monitoring of a salt water injection experiment[J]. Geophysics, 1991, 56(6): 769-777.
[2] YANG F W, WARD S H. On sensitivity of surface-to-borehole resistivity measurements to the attitude and the depth to center of a three-dimensional spheroid[J]. Geophysics, 1985, 50(7): 1173-1178.
[3] POIRMEUR C, VSSEUR G. Three-dimensional modeling of a hole-hole electrical method: Application to the interpretation of a field survey[J]. Geophysics, 1988, 53(1): 85-103.
[4] WANG Zhi-gang, HE Zhan-xiang, LIU Hai-ying. Three-dimensional inversion of borehole-surface electrical data based on quasi- analytical approximation[J]. Applied Geophysics, 2006, 3(3): 141-147.
[5] MICHAEL H G, PAUL M, JOONGMOO B, JOHN W, LARRY C, PAUL B. Crosswell electromagnetic and seismic imaging: An examination of coincident surveys at a steam flood project[J]. Geophysics, 2004, 69(2): 406-414.
[6] ZHANG Tian-lun, ZHANG Bai-lin, LI Nie. Small reservoir discovery using groundborehole trielectrode gradient method[J]. Oil Geophysical Prospecting, 1997, 32(4): 520-531. (in Chinese)
[7] ZHANG Tian-lun, ZHANG Bai-lin. Looking for residual oils with non-boundless trielectrode section method using the drilling casing as electrodes[J]. Journal of Southwest Petroleum Institute, 1999, 21(1): 29-34. (in Chinese)
[8] HE Zhan-xiang, LIU Xue-jun. High-power surface-borehole electrical method in predicting reservoir boundary and its application[J]. Petroleum Exploration and Development, 2004, 31(5): 74-76. (in Chinese)
[9] WANG Zhi-gang, HE Zhan-xiang, WEI Wen-bo, DENG Ming. 3-D physical model experiments of well-to-ground electrical survey[J]. Oil Geophysical Prospecting, 2005, 40(5): 594-597. (in Chinese)
[10] WANG Zhi-gang, HE Zhan-xiang, WEI Wen-bo. Study on some problems upon 3D modeling of DC borehole-ground method[J]. Computing Technique for Geophysical and Geochemical Exploration, 2006, 28(4): 322-377. (in Chinese)
[11] WANG Zhi-gang, HE Zhan-xiang, HE Yu. Research of three-dimensional modeling and anomalous rule on borehole-ground DC method[J]. Chinese Journal of Engineering Geophysics, 2006, 3(2): 87-92. (in Chinese)
[12] DAI Qian-wei, FENG De-shan, HE Ji-shan. Finite difference time domain method forward simulation of complex geoelectricity ground penetrating radar model[J]. Journal of Central South University of Technology, 2005, 12(4): 478-482.
[13] ZHOU Guo-feng, LI Xiao-yan, SHI Yao-wu, XU Bin-shi. Three-dimensional finite element analysis of critical pre-twist strain angle for torsional axis[J]. Journal of Central South University of Technology, 2005, 12(2): 254-256.
[14] TANG Jian-guo, ZHANG Xin-ming, CHEN Zhi-yong, DENG Yun-lai. Finite element simulation of influences of grain interaction on rolling textures of fcc metals[J]. Journal of Central South University of Technology, 2006, 13(2): 117-121.
[15] WAN Shui, NIELSEN M P. Generating finite element program of navier-stokes equation by means of FEPG [J]. Journal of Ship Mechanics, 2007, 11(3): 328-332.
[16] XU Shi-zhe. Finite element method in geophysics [M]. Beijing: Science Press, 1994: 159-160. (in Chinese)
(Edited by CHEN Wei-ping)
Foundation item: Projects(2006AA06Z105, 2007AA06Z134) supported by the National High-Tech Research and Development Program of China
Received date: 2007-06-25; Accepted date: 2007-07-30
Corresponding author: ZHANG Ji-feng, Doctoral candidate; Tel: +86-13467538541; E-mail: zjf0201@126.com
