
Trans. Nonferrous Met. Soc. China 31(2021) 2532-2544
Time-varying impact of political risk on copper prices
Jing TANG1, Jian-bai HUANG1,2, Hong-wei ZHANG2,3, Yu-mei LUO1
1. School of Business, Central South University, Changsha 410083, China;
2. Institute of Metal Resources Strategy, Central South University, Changsha 410083, China;
3. School of Mathematics and Statistics, Central South University, Changsha 410083, China
Received 28 August 2020; accepted 26 June 2021
Abstract:
Using the International Country Risk Guide (ICRG) index to represent countries�� political risk, the time-varying effect of political risk on copper prices was examined based on the time-varying parameter structural vector autoregression with stochastic volatility (TVP-SVAR-SV) model. The empirical results show that the impact of political risk on copper prices is time-varying and has tended to increase gradually in recent years. There are significant country-level differences in the impact of political risk on copper prices. Political risk has a stronger and longer-lasting impact on copper prices in exporting countries. In terms of risk sources, external and internal conflicts contribute most to international copper price fluctuations in the sample period. The impact of political risk on copper prices reaches an extreme level during the international financial crisis, the European debt crisis, and the election of Donald Trump.
Key words:
political risk; copper prices; time-varying impact; TVP-SVAR-SV model;
1 Introduction
In recent years, global political events have occurred frequently, including the rise of emerging economies, Ukraine��s political crisis, Britain��s exit from the European Union (Brexit), and the recent U.S.-China trade frictions. These political events are gradually reshaping the world economic structure and increasing political risk, which have affected the global economy and inevitably impacted the global bulk commodity market. Metal commodities are important bulk commodities in trade and play vital roles in the industrial manufacturing and economic activity worldwide [1,2]. In particular, copper is an important national strategic resource, and any political turmoil will affect the metal price. Against this complex and turbulent international political and economic background, exploring the time- varying impact of political risk on copper prices is important to better understand and predict price changes so that we can take timely measures to hedge and manage risks.
The research concerning the impact of political risk on the commodity market is mainly conducted from the following three perspectives. The first category investigates the impact of political risk on commodity price changes before and after the occurrence of specific political events, mainly by using dummy variables with traditional econometric methods [3-5]. For example, ZHANG et al [6] and LEE et al [7] analyzed the impacts of a series of political events or major emergencies, such as the Gulf War, and the Iraq War, on crude oil prices. GAO [8] argued that the core of geopolitics is overseas resource trade and maritime routes for resource transportation. The second category analyses the influence of political factors by mining historical commodity price data. The commonly used methods include the decomposition method and the entropy method. For example, ZHANG et al [9] and ZHANG et al [10] analyzed the impacts of the Iranian Revolution, Gulf War, and Iraq War on crude oil prices based on the ensemble empirical mode decomposition (EEMD) model and empirical mode decomposition (EMD) model. MARTINA et al [11] applied the entropy method to analyze the impacts of six extreme political and economic events on crude oil prices during the period from 1986 to 2010. The third category use a political risk index as a proxy for the country��s political risk to analyze its impact on the crude oil market [12-15]. For example, CHEN et al [12] used the International Country Risk Guide (ICRG) index as a measure of a country��s political risk level and showed that political risk in OPEC countries had a significantly positive impact on Brent crude oil prices. LEE et al [15] suggested that country risk shocks had significantly delayed positive impacts on oil prices in oil-exporting countries.
A large number of studies concerning the impact of political risk on bulk commodities have made certain achievements but have some limitations. First, the existing research on political risk in commodity markets is mainly concentrated on the oil market, but little research has focused on bulk strategic metal commodities such as copper. As an important bulk commodity, copper plays an important fundamental and supportive role in the national economy, and it has different attributes than other commodities such as oil [16]. Second, the existing research on the impact of political risk on bulk commodity prices mostly uses the vector autoregression (VAR) model or SVAR model to evaluate the impact of political risk on crude oil prices from a static or linear perspective without considering the dynamic characteristics of the relationship. The dynamic characteristics of the relationship can provide timely predictive information for investors, corporate managers and policymakers [17-20]. Third, the existing research mainly focuses on the impact of political risk on prices but lacks an in-depth analysis of the sources of political risk and country-level differences.
Therefore, using the time-varying parameter structural vector autoregression with stochastic volatility (TVP-SVAR-SV) method, in this work, the time-varying effect of political risk on copper prices is investigated. Furthermore, country-level differences and various sources of political risk are considered. Compared with the previous literature, this study makes three major contributions. First, based on a dynamic and nonlinear perspective, political risk is incorporated into the research framework to comprehensively analyze the time- varying impact of political risk on copper prices. Second, the ICRG political risk index scores of the main copper-importing countries (China, the United States, Germany, and Korea) and copper- exporting countries (Chile, Japan, Russia, and India) are used to analyze the heterogeneous impact of political risk on international copper prices across countries. Third, considering the difference in the impact of political risk from different sources, the heterogeneous impact of different types of political risk on copper prices is investigated and the underlying causes of political risk are analyzed that lead to the fluctuation of international copper prices.
2 Data and empirical methodology
2.1 Data specifications
To systematically investigate the impact of political risk on copper prices, this paper uses the ICRG index to measure political risk. Due to data availability, the data from August 2004 to January 2018 is used. Political risk and other factors affecting copper futures prices are described as follows.
(1) Political risk. Given data availability and the fact that the copper supply, demand, and price changes are mainly influenced by importing and exporting countries, the ICRG political risk indexes of four copper-importing countries (China, the United States, Germany, and Korea) and four copper-exporting countries (Chile, Japan, Russia, and India) are considered in the analysis. The ICRG index has twelve components, and a larger value of a component suggests that the country has lower political risk. However, not all twelve components of the ICRG index affect copper prices. Five components of the ICRG political risk index are selected for analysis, including political stability, the socio-economic environment, the investment environment, internal conflict, and external conflict. The impact of the share of copper production is considered, and the integrated political risk index is calculated as follows:
 (1)
(1)
where wi is the share of the total copper production of country i in the sample period; PRIij is the political risk sub-index j of country i; and  is the maximum value of political risk sub-index j.
The ICRG political risk index of eight copper-importing and exporting countries is shown in Fig. 1. The values of the political risk indicators range from 0 to 100. A higher indicator represents lower risk. The ICRG political risk scores of Germany, the United States, Korea, Japan, and Chile are above 70, indicating that their political risk is relatively low; by contrast, the ICRG political risk scores of China, Russia, and India are below 70, suggesting higher risk of them (Fig. 1).
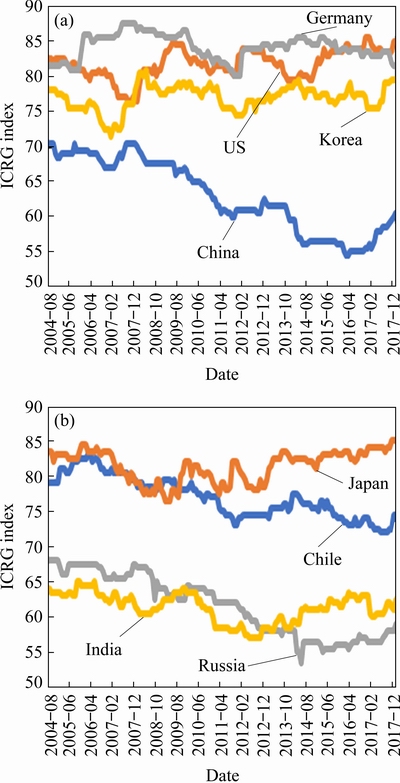
Fig. 1 Political risk index of top four copper-importing countries (a) and four copper-exporting countries (b)
(2) Other factors. The other indicators include copper prices, the copper supply, copper demand, and speculation that may affect international copper price fluctuations. In this paper, the 3-month copper futures price on the London Metal Exchange (LME) is selected as the representative of international copper prices, and the monthly refined copper output provided by the ICSG is used to represent copper supply. Because the refined copper output changes seasonally, the X-12 method is used for seasonal adjustment. The Kilian index, which reflects global economic change, can be used as an effective indicator of global copper demand. We use the percent position held by non-commercial traders (NCPP) to measure the speculation, which is calculated as Eq. (2) [21]. To eliminate heteroscedasticity, all variables are transformed into logarithmic values. Except for the Kilian index from http://www-personal.umich.edu/~lkilian/, all data are obtained from the Wind database.
 (2)
(2)
where NCL, NCS and NCSP denote the non- commercial long, short and spread positions, respectively, and TOI denotes total open interest. The data are sourced from the commodity futures trading commission (CFTC).
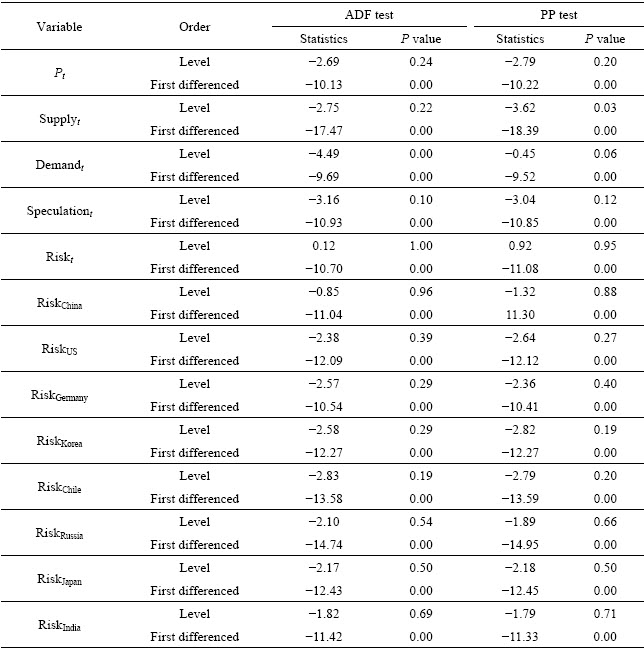
Before establishing the TVP-SVAR-SV model, we first examine the stationarity of the variables using the augmented Dicky-Fuller (ADF) and Phillips-Perron (PP) tests. The level values, first-differenced values, and corresponding P values of all the variables in the ADF and PP tests are shown in Table 1. The results show that all the level variables are non-stationary at the 1% significance level. However, all variables in the first-differenced term are stationary. Therefore, this paper uses the first differences of all variables for modelling.
2.2 TVP-SVAR-SV model
In this paper, the TVP-SVAR-SV model proposed by NAKAJIMA [22] is used to assess the time-varying impact of political risk on copper prices. This model, which is an extension of the SVAR model, can predict the time-varying characteristics of variable coefficients and help us distinguish whether the changes in economic variables are caused by structural factors or shock factors.
Considering the effects of political risk, the copper supply, copper demand, and speculative factors on copper prices, the five-variable SVAR model below was first constructed based on the research frameworks of CHEN et al [12] and LEE et al [15].
Table 1 Unit root test results of all variables
 (3)
(3)
where xt=(Riskt, Supplyt, Demandt, Speculationt, Pt'), and Riskt represents political risk, Supplyt represents copper supply, Demandt represents copper demand, Speculationt represents the speculative factor, and Pt represents the copper futures price; ��, A and ��i are the coefficient matrices to be estimated; ��t represents the structural interference term, assuming that there is no correlation of the series and ��t~N (0, �צ�).
The reduced form of the VAR is represented as follows:
 ,
,  (4)
(4)
where Bi=A-1��i, and A-1�צ�t is the disturbance term.
Based on Eq. (4), a TVP-SVAR-SV model is established by accounting for the time-varying characteristics of the parameters as follows:
 , t=s+1, ��, n (5)
Compared with Eq. (4), all the parameters in Eq. (5), including the coefficients of the variables and the standard deviation of the error term, change over time rather than being fixed.
Let at=(a21, a31, a32, a41, ��, a54)��, and its element is the lower triangular element of matrix At. Let ht=(h1t, ��, h5t)�� and  , where t=s+1, ��, n. All the parameters in Eq. (3) are assumed to follow the random walk process below:
Bt+1=Bt+��bt, at+1=at+��at, ht+1=ht+��ht
In addition,
 (6)
(6)
where 
 and
and  .
.
3 Empirical results
3.1 Estimation of selected parameters
The optimal lag order is set to be 2 according to the likelihood ratio (LR) test, Akaike information criterion (AIC), and Schwarz information criterion (SC). To estimate the parameters in the model, the Markov Chain Monte Carlo (MCMC) method is used for simulation sampling to obtain the posterior distribution of the parameters. Based on the research of NAKAJIMA [21], the initial setting is as follows: ��b0=��a0=��h0=0, ��b0=��a0=10I, ��h0=100I,  ~Gamma(40, 0.02),
  ~Gamma(4, 0.02), and
  Subsequently, 100000 samples are sampled, from which the first 10000 samples are removed. Table 2 shows the mean, standard deviation, 95% confidence interval, and diagnostic statistics of the posterior distribution of the parameters in the TVP-SVAR-SV model. The mean was in the confidence interval, and the inefficiency factor was relatively low, with a maximum value of 89.900. The Geweke statistics indicate that the parameter converges to the posterior distribution. In summary, simulation sampling using the MCMC method and the subsequent estimation of the TVP-SVAR-SV model parameters are valid.
3.2 Analysis of time-varying impact of integrated political risk on copper prices
Figure 2 shows the impulse responses of copper prices following a shock to integrated political risk, supply, demand and speculation for the 3-, 6-, and 12-month lag periods. It is clear that there is significant variation in the impulse responses over time, which supports applying the TVP-SVAR-SV model. The results show that the impacts of the four shocks on international copper prices are the highest for the 3-month lag period, followed by the 6-month lag period, while the impacts are minimal for the 12-month lag period. This shows that the copper market can be effectively adjusted over time to mitigate shock effects and ensure price stability.
First, the impacts of integrated political risk on international copper prices were analyzed. As shown in Fig. 2, the impacts of integrated political risk shocks on copper prices weaken as the lag period increases and decrease to almost zero for the 12-month lag period. For the 3-month lag period, the integrated political risk of the eight copper- importing and exporting countries negatively affected copper prices from August 2004. After three distinct ��up-down�� stages, the negative impacts reached the highest level in 2016 and remained at a relatively high level. For the 6-month lag period, the integrated political risk only slightly affected copper prices, and the effect tended to decrease after August 2004.
Table 2 Estimation of selected parameters using TVP-SVAR-SV model
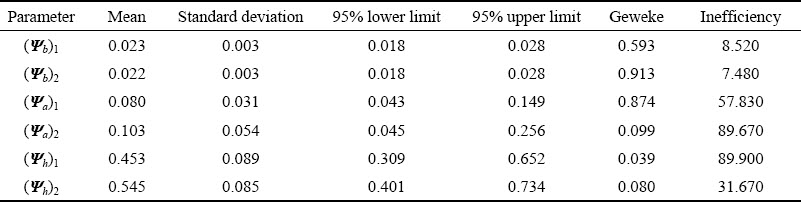
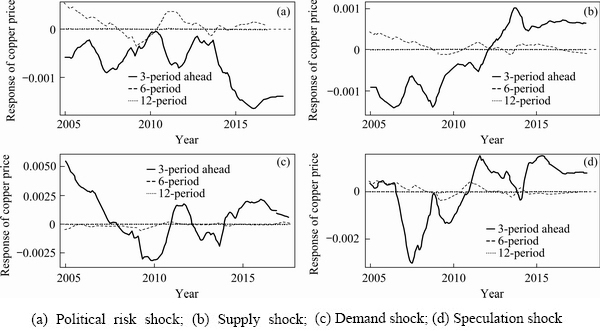
Fig. 2 Time-varying responses of copper prices to various shocks
Second, we analyzed the impacts of copper supply, demand, and speculation on international copper prices. Similar to the above results, the impacts of copper supply shocks on copper prices also weaken as the lag duration increases, decreasing to almost zero for the 12-month lag period. Different from political risk shocks, the impacts of copper supply shocks on copper futures prices gradually changed from negative to positive after 2012. For the 6-month lag period, the impacts of copper supply shocks on the copper price also presented a weakening trend. The impacts of copper demand shocks on copper prices were relatively significant only for the 3-month lag period but weakened to zero for the 6- and 12-month lag periods. For the 3-month lag period, the impact of copper demand shocks on copper prices generally decreased during the sample period, which reached its lowest point in April 2008 and then fluctuated in a cyclical pattern. The impulse response of copper prices to the impact of market speculation shocks also showed a cyclical pattern, and the impact was the strongest in approximately 2008. This finding echoed the reality that the financial market bubble reached its maximum and financial speculation prevailed in 2008, which greatly shocked the market and ultimately resulted in a rapid decline in asset prices.
Therefore, the impulse responses of copper prices to political risk, copper supply, copper demand, and speculation shocks were characterized by a significant time-varying and cyclical pattern. In addition, the impact of each influencing factor gradually decreased as the lag duration increases. The impact of speculation on copper prices changed from remarkably negative to positive and became even more significant at special time points such as the 2008 financial crisis. Political risk has a non-negligible impact on international copper futures; in particular, the impact had tended to increase in recent years.
Furthermore, the impact of integrated political risk on copper prices at specific times was analyzed. According to the above analysis, the impact of political risk on copper prices was time-varying for different lag periods and was more significant at some specific times. A retrospective review of global political and economic events revealed that the major political and economic events corresponding to these special times are the 2008 international financial crisis, the European debt crisis, and the election of Donald Trump. To further characterize the impact of political risk on copper prices at specific times, the impulse responses of copper prices to the impacts of various shocks at the specific times of September 2008, July 2011, and January 2017 corresponding to the international financial crisis, the European debt crisis, and the election of Donald Trump were analyzed (Fig. 3).
As shown in Fig. 3, during the international financial crisis, the European debt crisis, and the election of Donald Trump, political risk shocks caused an immediate positive response in international copper prices in the current period, with the response reaching peaks of 0.010, 0.018 and 0.012, respectively. Then, the response declined rapidly and became negative in half a month, with the response reaching its minimum in the first month. Then, the negative response declined gradually and became positive in the second month. Finally, the positive response declined and disappeared in approximately five months.
For speculation shocks, the responses of international copper prices were similar to those to political risk shocks. The difference was that the impacts of speculation shocks on copper prices in the current period were the highest during the international financial crisis, followed by the European debt crisis, and the lowest impacts were during the election of Donald Trump. In contrast to the political risk and speculation shocks, the responses of international copper price to supply shocks were negative in the current period and reached a peak, and then the response declined gradually and turned positive in the first month. Then, the positive response declined and disappeared in approximately four months. For demand shocks, the responses of international copper prices during the international financial crisis, the European debt crisis, and the election of Donald Trump were very different. During the international financial crisis, a shock to demand caused an immediate positive response in international copper prices in the current period, with the response reaching a peak of 0.035. Then, the response declined rapidly and lasted for approximately three months. During the European debt crisis, the responses of international copper prices to demand shocks were negative in the current period but became positive in the first month and then disappeared in approximately four months. During the election of Donald Trump, the responses of international copper prices were relatively weak.
3.3 Analysis of time-varying impacts of political risk on copper prices across countries
To explore the time-varying impacts of political risk shocks across countries, the TVP-SVAR-SV model is established based on the political risk indicator values in different countries. It is then used to analyze the impact of the political risk of each country on international copper futures prices for different lags and different time points. Figure 4 presents the impact of political risk in four copper-importing countries, China, the United States, Germany, and Korea, on copper prices. For all four countries, the impact shows a significant time-varying pattern, and it decreases with increasing lag duration and is nonsignificant for the 6- and 12-month lags. Therefore, the time-varying impacts with a 3-month lag period are the focus of this paper.
For political risk in China, the impulse response of copper prices generally showed a trend moving from positive to negative. The impact of China��s political risk shocks can be divided into three stages. First, the impact was positive and stable from 2004 to 2010. The second stage was from 2010 to 2013, during which the impact changed from positive to negative and continued to increase. The third stage was from 2013 to 2018, during which the impact remained negative and strong. In terms of different time points, the impact of political risk shocks from China was the strongest in January 2017 during the election of Donald Trump, weaker in July 2011 (during the European debt crisis), and weakest in September 2008 (during the international financial crisis).
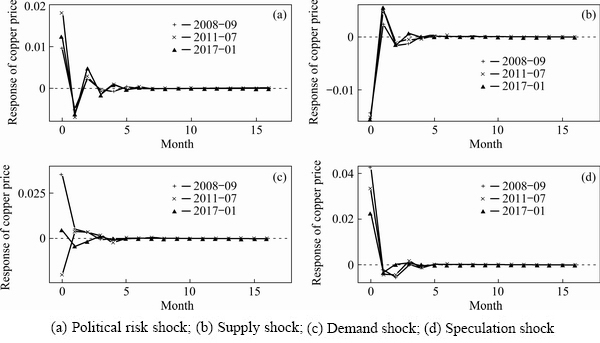
Fig. 3 Impulse responses of copper prices to various shocks at specific time
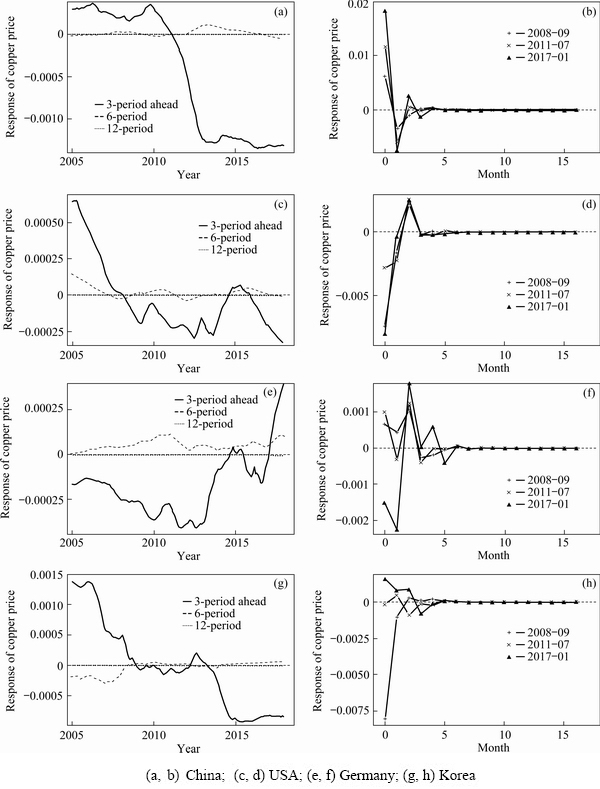
Fig. 4 Time-varying impulse responses of copper prices to political risk in different import countries
Regarding the United States�� political risk, the impulse response of copper prices showed an overall trend moving from positive to negative. First, the positive impact of the United States�� political risk shocks decreased from 2004 and reached zero in approximately 2009. After fluctuating in a small range, the negative impact increased from approximately 2015. The impact of the United States�� political risk shocks was the highest in January 2017 (the Trump election), weaker in September 2008 (the international financial crisis), and weakest in July 2011 (the European debt crisis).
Regarding Germany��s political risk, the impulse response of copper prices experienced two decreasing periods and two increasing periods. The first decreasing period was from 2004 to 2013, during which the impact of Germany��s political risk on copper prices fluctuated and became more negative. The second decreasing period was from 2015 to 2017, during which the impact changed from positive to negative. The two increasing periods were from 2013 to 2015 and from 2017 to 2018. The impact of Germany��s political risk was remarkably characterized by a relatively sharp rise during the increasing periods. The impulse response graph of copper prices to Germany��s political risk shocks appears different at the specific times emphasized in this analysis. The strongest response was in January 2017 (Trump election), followed by July 2011 (the European debt crisis) and September 2008 (the international financial crisis).
The impact of Korea��s political risk on copper prices was positive but continued to decrease from 2004 to 2009, eventually reaching almost zero. It began to decrease in 2013 and remained stable after 2015. The impact of Korea��s political risk was negative and the highest in September 2008 (during the financial crisis), but it was positive in January 2017 when Trump came to power, and the impact was nonsignificant in July 2011 (the European debt crisis).
The impulse response of copper prices to the political risk in four copper-exporting countries, Chile, Russia, Japan, and India, is shown in Fig. 5. Compared with copper-importing countries, the time-varying impact of the copper-exporting countries�� political risk on international copper futures is more obvious. In addition, the impact of the copper -exporting countries�� political risk lasted longer than that of the copper-importing countries. As shown in Fig. 5, the impact of Russia��s and India��s political risk for the 6-month lag significantly differed from zero.
Regarding Chile��s political risk, the impulse response of copper prices trended to decrease remarkably. Since 2004, the impact of Chile��s political risk shock has gradually declined from positive to zero. After 2010, it began to decrease until 2015 and remained at a stable level. The impact of Chile��s political risk shock on copper prices varied at different time. During the international financial crisis and election of Donald Trump, the impact of Chile��s political risk shock on copper prices was positive during the current period and subsequently oscillated between positive and negative; the impact was negative during the European debt crisis.
The time-varying impacts of Russia��s and Japan��s political risk shocks on copper prices were relatively similar. Both showed large volatility, presenting a ��decreasing-increasing-decreasing�� pattern. At the three specific times focused on in this analysis, Japan��s political risk demonstrated basically the same level of impact; that is, the impact was the highest in the current period and then became negative and slowly approached zero. The impact of Russia��s political risk showed a different pattern at the three specific time. In September 2008, it was positive in the current period and gradually decreased to zero over the lagged period. At the other two time, the impact reached its peak after one lag period.
Regarding India��s political risk, the impulse response of copper prices was always positive and exhibited greater volatility. The impact of India��s political risk on copper prices decreased first until it reached the lowest point in 2007, then gradually increased to its peak in 2012 and later decreased. The impact was inconsistent at the three specific times, negative and strong in the current period during the international financial crisis in September 2008 but low during the other two periods. The impact was basically at the same level in the first and second lag periods at the three specific time points.
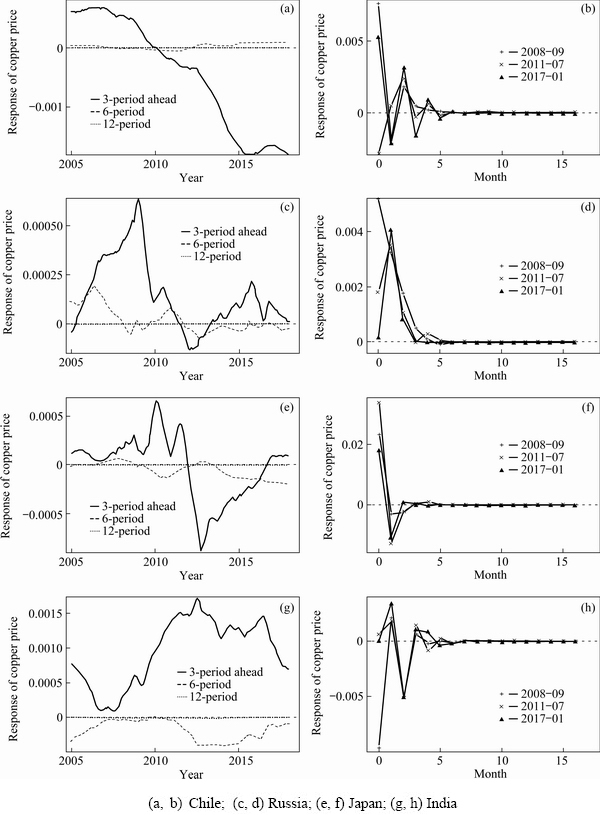
Fig. 5 Time-varying impulse responses of copper prices to political risk in different export countries
3.4 Analysis of time-varying impact of political risk from different sources on copper prices
To distinguish and compare the impacts of political risk shocks from different sources on copper prices, a TVP-SVAR-SV model considering political risk from different sources was established. The impact of political risk shocks from different sources on copper prices varied significantly over time (Fig. 6). In general, the impacts of the political risk from five different sources have been increasing in recent years.
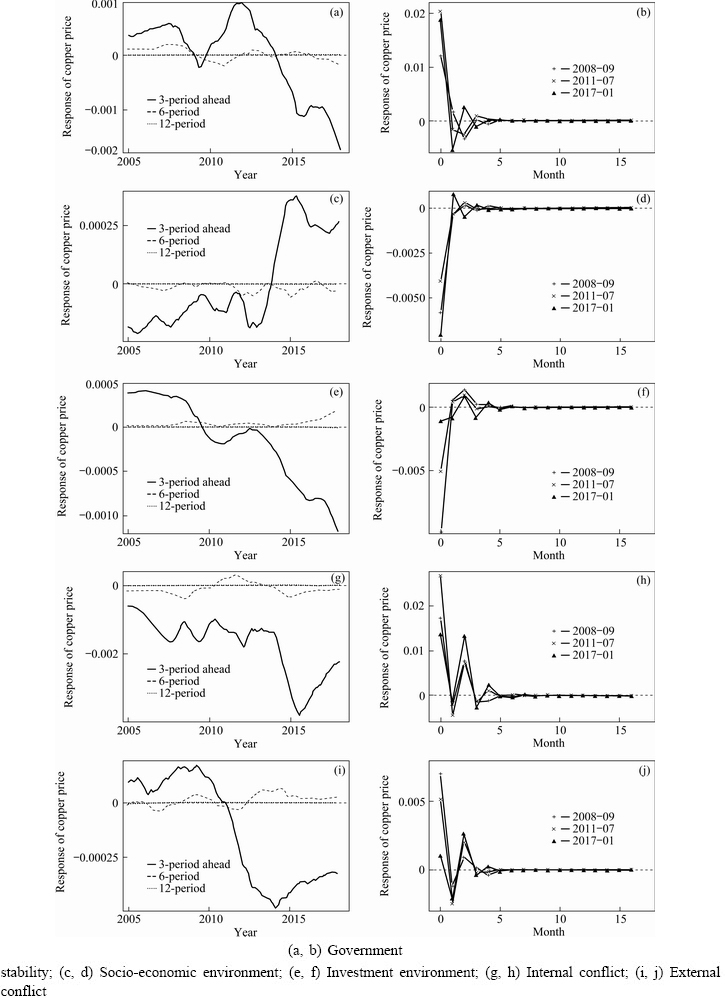
Fig. 6 Time-varying impulse responses of copper prices to political risks from different sources
The impacts of political risks from two sources, government instability and investment environment, on copper prices showed a similar trend, changing from initially positive to negative and then continuing to increase. This finding indicates that the political risk generated by the government instability and investment environment increasingly affected copper prices, and the impacts gradually increased. According to the impulse response of copper prices, the impact of political risk shocks derived from government instability changed with the lag period in a basically consistent pattern at the three specific time points; that is, it reached its peak in the current period, became negative during the first lag period, and eventually slowly decreased to zero. The impact was the strongest during the European debt crisis, followed by the election of Donald Trump and the international financial crisis. Regarding the political risk from the investment environment, the responses of copper prices at the three times were also consistent. However, the impact of political risk from the investment environment was the opposite of that of the political risk from government instability in the current period and the first lag period. The impact was the strongest during the international financial crisis, followed by the election of Donald Trump, and it was the lowest during the European debt crisis.
The impacts of the political risk shocks derived from internal conflicts and external conflicts both experienced a ��stable-decreasing- increasing�� process. The impact of internal conflicts was always negative for the 3-month lag period; it sharply decreased during 2014-2015 and then began to rebound. The impact of external conflicts shifted from positive to negative and began to rise after reaching its lowest point in 2014. According to the impulse response at specific time points, the impacts of internal conflicts and external conflicts during the three specific times demonstrated the same trend in the lag periods. They both reached the maximum in the current period and then fluctuated and weakened to zero over time.
Compared to the political risk from other sources, the risk from the socio-economic environment affected copper prices in a different pattern. Before 2013, the impact was always negative and fluctuating. During 2013-2015, the impact demonstrated a sharp increase and became positive, followed by a decline after reaching its peak in 2015. The impulse response curves of copper prices reveal that the impact of political risk shocks derived from the socio-economic environment at the three specific time points was high and negative in the current period and then quickly decreased towards zero, indicating that the impact had a short duration.
4 Conclusions
(1) Overall, political risk has a time-varying impact on copper prices, and this impact has gradually strengthened since 2014. The results of the TVP-SVAR-SV model show that the impact of political risk changed significantly over time for the 3-month lag period from August 2004 to January 2018 and became more negative after 2014.
(2) There are significant country-level differences in the impact of political risk on copper prices. Oil-exporting countries�� political risk shocks could affect copper prices for longer, and the impact remarkably fluctuated over time. In addition, the impact of political risk from various sources has affected copper prices in an increasingly remarkable time-varying pattern in recent years.
(3) The impact of political risk on copper prices varies with different lags and at different times. The impact gradually weakened as the lag duration increased, indicating that the impact of political risk on copper prices is more significant in the short term and weaker in the medium and long terms. In addition, the impact reached its highest value during the global financial crisis, the European debt crisis, and the election of Donald Trump. Overall, the impact was strongest during the European debt crisis, followed by the election of Trump, and it was the weakest during the global financial crisis.
Acknowledgments
The authors are grateful for the financial supports from the National Natural Science Foundation of China (Nos. 71633006, 71874210, 71874207, 71974208), the Natural Science Founda-tion of Hunan Province, China (No. 2020JJ5784), and the Innovation-Driven Foundation of Central South University, China (No. 2020CX049).
References
[1] TODOROVA N, WORTHINGTON A, SOUCEK M. Realized volatility spillovers in the non-ferrous metal futures market [J]. Resources Policy, 2014, 39: 21-31.
[2] GONG X, LIN B Q. Structural breaks and volatility forecasting in the copper futures market [J]. Journal of Futures Markets, 2018, 38(3): 290-339.
[3] COLEMAN L. Explaining crude oil prices using fundamental measures [J]. Energy Policy, 2012, 40: 318-324.
[4] KARALI B, RAMIREZ O A. Macro determinants of volatility and volatility spillover in energy markets [J]. Energy Economics, 2014, 46: 413-421.
[5] ZHANG H. Geopolitical events, financial crisis, and global crude oil price system: An empirical analysis based on endogenous structural mutation [J]. Chinese Review of Financial Studies, 2017, 9(3): 25-50. (in Chinese)
[6] ZHANG X, YU L A, LI J Q, WANG S Y. Estimating the effects of extreme events to crude oil price [J]. Systems Engineering-Theory & Practice, 2009, 29(3): 10-15. (in Chinese)
[7] LEE Y H, HU H N, CHIOU J S. Jump dynamics with structural breaks for crude oil prices [J]. Energy Economics, 2010, 32(2): 343-350.
[8] GAO S Q. Analysis of natural resource elements in world geopolitical and economic transformation [J]. Social Sciences Abroad, 2009(1): 49-57. (in Chinese)
[9] ZHANG X, LAI K K, WANG S Y. A new approach for crude oil price analysis based on Empirical Mode Decomposition [J]. Energy Economics, 2008, 30(3): 905-918.
[10] ZHANG X, YU L, WANG S Y, LAI K K. Estimating the impact of extreme events on crude oil price: An EMD-based event analysis method [J]. Energy Economics, 2009, 31(5): 768-778.
[11] MARTINA E, RODRIGUEZ E, ESCARELA-PEREZ R, ALVAREZ-RAMIREZ J. Multiscale entropy analysis of crude oil price dynamics [J]. Energy Economics, 2011, 33(5): 936-947.
[12] CHEN H, LIAO H, TANG B J, WEI Y M. Impacts of OPEC's political risk on the international crude oil prices: An empirical analysis based on the SVAR models [J]. Energy Economics, 2016, 57: 42-49.
[13] ZHANG H W, WANG Y, YANG C, GUO Y Q. The impact of country risk on energy trade patterns based on complex network and panel regression analyses [J]. Energy, 2021, 222: 119979.
[14] HUANG J B, DING Q, ZHANG H W, et al. Nonlinear dynamic correlation between geopolitical risk and oil prices: A study based on high-frequency data [J]. Research in International Business and Finance, 2021, 56: 101370.
[15] LEE C C, LEE C C, NING S L. Dynamic relationship of oil price shocks and country risks [J]. Energy Economics, 2017, 66: 571-581.
[16] SHI B, ZHU X, ZHANG H, ZEGN Y. Volatility�Cvolume relationship of Chinese copper and aluminum futures market [J]. Transactions of Nonferrous Metals Society of China, 2018, 28(12): 2607-2618.
[17] ZHOU M J, HUANG J B, CHEN J Y. The effects of geopolitical risks on the stock dynamics of China's rare metals: A TVP-VAR analysis [J]. Resources Policy, 2020, 68: 101784.
[18] CHAI G, YOU D, CHEN J Y. Dynamic response pattern of gold prices to economic policy uncertainty [J]. Transactions of Nonferrous Metals Society of China, 2019, 29(12): 2667-2676.
[19] ZHAO L, WEN F H, WANG X. Interaction among China carbon emission trading markets: Nonlinear Granger causality and time-varying effect [J]. Energy Economics, 2020, 91: 104901.
[20] HUANG J B, LI Y, ZHANG H, GUO Y Q. The effects of uncertainty measures on commodity prices from a time-varying perspective [J]. International Review of Economics & Finance, 2021, 71: 100-114.
[21] CHEN Jin-yu, ZHU Xue-hong, ZHONG Mei-rui. Nonlinear effects of financial factors on fluctuations in nonferrous metals prices: A Markov-switching VAR analysis [J]. Resources Policy, 2019, 61: 489-500.
[22] NAKAJIMA J. Time-varying parameter VAR model with stochastic volatility: An overview of methodology and empirical applications [R]. Institute for Monetary and Economic Studies, Bank of Japan, 2011.
���η��ն�ͭ�۲�����ʱ��Ӱ��
�� ��1���ƽ���1,2���ź�ΰ2,3������÷1
1. ���ϴ�ѧ ��ѧԺ����ɳ 410083��
2. ���ϴ�ѧ ������Դս���о�Ժ����ɳ 410083��
3. ���ϴ�ѧ ��ѧ��ͳ��ѧԺ����ɳ 410083
ժ Ҫ�������ҷ���(ICRG)ָ����Ϊ�������η��յIJ�ȣ������������ʱ������ṹ�����Իع�(TVP-SVAR-SV)ģ�ͣ��о����η��ն�ͭ�۲�����ʱ��Ӱ�졣������������η��ն�ͭ�۲�������ʱ��Ӱ�죬��������Ӱ���ڽ�����������ǿ�����ƣ����η��ն�ͭ�۲�����Ӱ����й��������ԣ����г��ڹ������η��ն�ͭ�۵ij��ЧӦ��ǿ�ҳ���ʱ��������ӷ�����Դ���������ⲿ��ͻ���ڲ���ͻ���µ����η��ն�ͭ�۲����Ĺ�����������η��ն�ͭ�۲�����Ӱ���ڽ���Σ����ŷծΣ����������ѡ���ڼ�ﵽ��ֵ��
�ؼ��ʣ����η��գ�ͭ�ۣ�ʱ��Ӱ�죻TVP-SVAR-SVģ��
(Edited by Xiang-qun LI)
Corresponding author: Hong-wei ZHANG, Tel: +86-15084949634, E-mail: hongwei@csu.edu.cn
DOI: 10.1016/S1003-6326(21)65673-X
1003-6326/  2021 The Nonferrous Metals Society of China. Published by Elsevier Ltd & Science Press
Abstract: Using the International Country Risk Guide (ICRG) index to represent countries�� political risk, the time-varying effect of political risk on copper prices was examined based on the time-varying parameter structural vector autoregression with stochastic volatility (TVP-SVAR-SV) model. The empirical results show that the impact of political risk on copper prices is time-varying and has tended to increase gradually in recent years. There are significant country-level differences in the impact of political risk on copper prices. Political risk has a stronger and longer-lasting impact on copper prices in exporting countries. In terms of risk sources, external and internal conflicts contribute most to international copper price fluctuations in the sample period. The impact of political risk on copper prices reaches an extreme level during the international financial crisis, the European debt crisis, and the election of Donald Trump.
