

J. Cent. South Univ. (2018) 25: 277-286
DOI: https://doi.org/10.1007/s11771-018-3736-5

Surface roughness prediction model in ultrasonic vibration assisted grinding of BK7 optical glass
ZHAO Pei-yi(������)1, ZHOU Ming(����)1, ZHANG Yuan-jing(��Ԫ��)1, QIAO Guo-chao(�ǹ���)2
1. School of Mechanical and Electrical Engineering, Harbin Institute of Technology, Harbin 150001, China;
2. School of Mechanical and Engineering, Hebei University of Technology, Tianjin 300401, China
 Central South University Press and Springer-Verlag GmbH Germany, part of Springer Nature 2018
Abstract:
Pre-knowledge of machined surface roughness is the key to improve whole machining efficiency and meanwhile reduce the expenditure in machining optical glass components. In order to predict the surface roughness in ultrasonic vibration assisted grinding of brittle materials, the surface morphologies of grinding wheel were obtained firstly in the present work, the grinding wheel model was developed and the abrasive trajectories in ultrasonic vibration assisted grinding were also investigated, the theoretical model for surface roughness was developed based on the above analysis. The prediction model was developed by using Gaussian processing regression (GPR) due to the influence of brittle fracture on machined surface roughness. In order to validate both the proposed theoretical and GPR models, 32 sets of experiments of ultrasonic vibration assisted grinding of BK7 optical glass were carried out. Experimental results show that the average relative errors of the theoretical model and GPR prediction model are 13.11% and 8.12%, respectively. The GPR prediction results can match well with the experimental results.
Key words:
surface roughness; prediction model; ultrasonic vibration; optical glass; GPR regression��
Cite this article as:
ZHAO Pei-yi, ZHOU Ming, ZHANG Yuan-jing, QIAO Guo-chao. Surface roughness prediction model in ultrasonic vibration assisted grinding of BK7 optical glass [J]. Journal of Central South University, 2018, 25(2): 277�C286.
DOI:https://dx.doi.org/https://doi.org/10.1007/s11771-018-3736-51 Introduction
Optical glass materials are typical hard and brittle materials. Because of their unique superior performance, they are widely used in the field of optics, micro-electronics, biomedicine, inertial confinement fusion (ICF), aerospace and national defense [1�C4]. Ultrasonic vibration assisted grinding has been used for precision machining of brittle materials due to the fact that the cutting force and cutting heat can be significantly reduced [5�C7]. The effect of the process parameters on the process performances has been investigated experimentally [8�C10].
The surfaces finish of optical glass components are always produced by polishing and lapping because of the engineering demands of no-damage surfaces. However, to improve the whole machining efficiency and meanwhile reduce the expenditure, the previous machining process is always chosen as grinding. The surface quality generated by grinding, especially the most important representative factor, surface roughness, determines the follow-up processing time and also, the maximum subsurface damage determines the follow-up processing margins. Hence, the grinding process will be one of the most important steps of optical glass machining process. Meanwhile, the grinding process is highly complex and hard to control, it is necessary to perform further studies to achieve a more comprehensive knowledge of surface forming in grinding process and a better prediction of surface roughness.
Over the last two decades, in order to assess the surface roughness in grinding optical glasses, empirical and theoretical prediction models of surface roughness have been developed by researchers. Empirical surface roughness models are based on quite a few experimental data, and usually are functions of machining parameters and cutting tool parameters. DABNUN [11] developed a prediction model for surface roughness in terms of cutting speed, feed rate and cutting depth based on 12 sets of turning experiments. Empirical surface roughness model has the advantage of less effort required and more success in the industry, but the inherent disadvantage is that the empirical surface roughness model lacks of theoretical basis, and only is accurately described for the experiments in paper, cannot be well used for other machining conditions.
To make the prediction results more accurate, the analytical surface roughness model has been tried out by quite a few researchers. The analytical surface roughness models are always based on the description of microstructure of grinding wheel and the analysis of machined surface forming mechanism and analytical models are deductively derived from fundamental principles. ALI et al [12] developed a surface roughness prediction model based on the fuzzy theory. ZHANG et al [13] proposed an analytical surface roughness model considering the influence of random distribution of abrasives, grinding conditions and ultrasonic vibration. According to his experimental validation, the prediction results can match well with the experimental results. However, the brittle fracture was not taken into consideration, which restricts the application field of the prediction model. The analytical model has the advantage of easily using under other machining conditions and generality. The analytical models have the disadvantage that they have to make different degrees of hypothesis during the prediction, and always divorce from the actual machining process. Hence, due to the highly complexity of ultrasonic vibration assisted grinding process, the prediction results of analytical model may exist different degrees of errors.
Although the potential of ultrasonic vibration assisted grinding has been recognized, and lots of empirical and analytical surface roughness prediction models have been developed, there are few reports on the prediction model for surface roughness that both considering actual machining process and surface forming mechanism in machining optical glasses by this technology. To overcome the problems, empirical method and analytical method should be taken into consideration together. After the surface roughness being calculated by analytical model, it is important to further correct the results through the actual machining experiments. Thus, the introduction of a regression method is essential. A general regression method for calculating the correction coefficient is least square method. Though the least square method is widely used, and the regression precision is high, it has obvious disadvantage that the prediction precision is low. Compared to other regression method, Gaussian processing regression (GPR) has the advantages such as easy to implement, hyper-parameter adaptive acquisition, flexible interpretation in nonparametric inference, and also has the advantage in non-linear fields [14, 15].
In the present work, the surface morphologies of grinding wheel were obtained by using LSCM (OLS 3000), the grinding wheel model was developed, the abrasive trajectories in ultrasonic vibration assisted grinding was also investigated, the theoretical model for surface roughness was developed based on the above analysis. The correction prediction model was developed by using GPR method. 32 sets of experiments of ultrasonic vibration assisted grinding of BK7 optical glass material were carried out to validate the prediction results.
2 Development of theoretical surface roughness model
2.1 Modelling of diamond grinding wheel
In order to predict the machined surface roughness, both the surface morphologies of grinding wheel and the forming mechanism of machined surface should be investigated.
The method to develop the grinding wheel model was roughly the same with other researchers [16]. The diameter of grinding wheel used in the present work was 4 mm, the LSCM instrument was used to acquire the height data of grinding wheel, the ranges on X and Y directions were both 1278.75 ��m, and the step was 1.25 ��m. To eliminate the random error, 6 sampling points were selected randomly on the surface of grinding wheel, and the height data were averaged. The grinding wheel used in the present work and the LSCM instrument are shown in Figures 1 and 2.
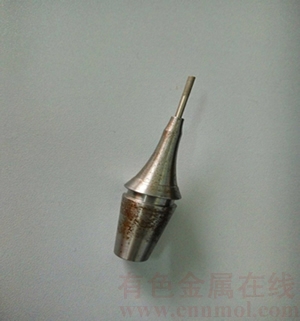
Figure 1 Photo of grinding wheel used in present work
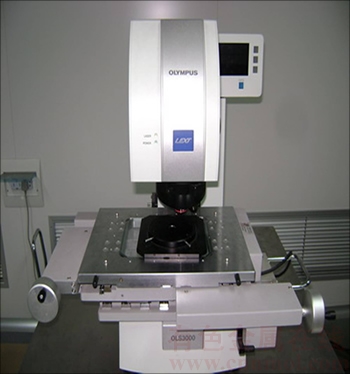
Figure 2 Photo of LSCM instrument
To eliminate the curvature error, the least square method was used and the final binomial for grinding wheel can be written as:

 (1)
(1)
where x and y are the coordinates of sampling points.
2.2 Algorithm of randomly distribution of abrasives
In order to make the prediction results more accurate, the randomness of abrasive on grinding wheel should be taken into consideration.
The shape of abrasive was assumed as spherical firstly, and all the abrasives array orderly, the spacing between each abrasive is lr, the average abrasive diameter is dg, the abrasive arraying before randomly distribution processing is shown in Figure 3.
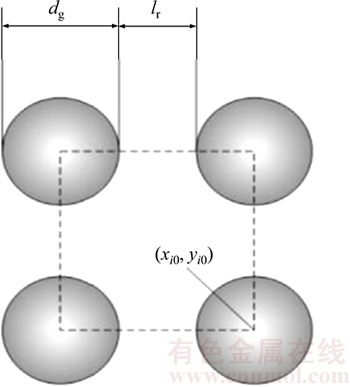
Figure 3 Abrasive arraying before randomly distribution processing
The volume fraction of the abrasives can be written as the ratio of the cross-sectional area of average abrasive diameter and the area of dashed box:
 (2)
(2)
Thus the initial spacing between each abrasive lr can be derived as:
 (3)
(3)
To introduce the randomness of distribution, let all the abrasives vibrate along horizontal direction. The initial position of the abrasive Gi is (xi0, yi0), the displacement of abrasives along X and Y directions after each vibration are ��x and ��y, respectively. Thus, after nth vibration, the position of abrasive Gi can be written as:
 (4)
(4)
where ��xn [�Clr, lr], ��yn[�Clr, lr].
To make sure that there are no overlaps between abrasives, the following conditions should be met:
 (5)
(5)
According to the researches by LIU et al [17], and aiming at the average abrasive diameter in the present work, the vibration times n was selected as 1000. MATLAB was used to calculate the final coordinates of the abrasives. After the 1000th vibration, the abrasives on the grinding wheel can be treated as randomly distributed.
2.3 Kinematics analysis of abrasive in ultrasonic vibration assisted grinding
The mechanical movements in ultrasonic vibration assisted grinding process can be divided into rotation movement of master axis, feed movement along cutting direction and ultrasonic vibration movement along axis direction. In order to clarify the compound movement of abrasive in ultrasonic vibration assisted grinding, each movement should be analyzed separately. The movement of abrasive in ultrasonic vibration assisted grinding process can be shown in Figure 4.
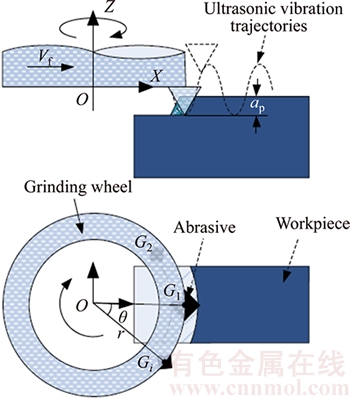
Figure 4 Movement of abrasive in ultrasonic vibration assisted grinding process
The rotation movement of master axis, feed movement along cutting direction and ultrasonic vibration movement along axis direction can be written as Eqs. (6)�C(8), respectively:
 (6)
(6)
 (7)
(7)
 (8)
(8)
where ri (mm) is the distance between abrasive Gi and center of grinding wheel, n (r/min) is rotation speed, v (mm/min) is feed rate, t (s) is grinding time, A (��m) is ultrasonic vibration amplitude, f (Hz) is ultrasonic vibration frequency and hi is height of abrasive Gi.
Thus the space movement equations of abrasive Gi can be derived as:
 (9)
(9)
where �� is the angle between the abrasive G1 and Gi.
The ri and �� can be respectively written as follows:
 (10)
(10)
 (11)
(11)
2.4 Theoretical model for surface roughness
Lots of researchers have pointed out that, in the grinding of optical glass materials, quite a few micro and macro cracks with different morphologies and distribution can be found on machined surfaces [18, 19]. It was also pointed out that the cracks morphologies, cracks sizes and the cracks amounts present different changing law when changing different grinding parameters. Hence, the brittle fracture and crack propagation processes are particularly complicated. Considering the randomness of the cracks morphologies, crack sizes and the crack amounts, the influence of brittle fracture on surface roughness was ignored temporarily in the development of theoretical model for surface roughness.
The forming process of machined surface outline along feed direction is shown in Figure 5.
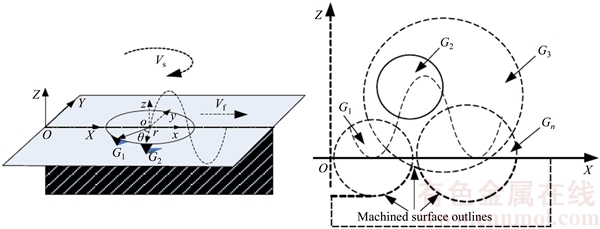
Figure 5 Forming process of machined surface outline along feed direction in ultrasonic vibration assisted grinding
The coordinate OXYZ was set at the machining starting point, and the coordinate oxyz was set at the center point of the end face of grinding wheel that the protrusion heights of all the abrasives are zero. The abrasive trajectory can be written as gi(x, z), i=1, 2, ��, n. The coordinate oxyz was then transferred into the coordinate OXYZ, and meanwhile the feed movement was superposed in the abrasive trajectory. Thus the new abrasive trajectory can be rewritten as Gi(x, z), i=1, 2, ��, n. It is believed that there exist much probability in the interaction effects between abrasives, however, the final outlines of machined surfaces always consist of the deepest trajectories of abrasives. Thus, the interaction effects between abrasive G1 and G2 can be written as:
 (12)
(12)
And the final outlines of machined surfaces can be written as:

i=1, 2, ��, n (13)
Let the final outlines of machined surfaces propagate along radial direction, the final morphologies of machined surfaces can be obtained.
After obtaining the final morphologies of machined surfaces, the surface roughness Sa can be calculated as follows:
 (14)
(14)
2.5 Development of prediction model by using GPR method
Because the brittle fracture was ignored in the theoretical model for surface roughness, there may exist tiny errors between theoretical results and the real values. Thus, Gaussian processing regression method was used to reduce the errors. The theoretical results can be written as Sat, and the GPR prediction results can be written as Sac.
A Gaussian processing that can describe the function distribution is a collection of random variables. For the regression problem in the present work, the regression model can be written as:
 (15)
(15)
where f is unknown function and �� is the noisy signal.
To make the regression problem more simple and convenient, let the distribution of noisy signal be N(0, ��n2). Thus the prior on noisy observations can be written as:
 (16)
(16)
where In is n-dimensional unit matrix.
And therefore the prior joint distribution of the variables Sat and Sac can be formulated as follows:
 (17)
(17)
where Sat* is the new theoretical prediction result and Sac* is the new prediction value.
Then the posterior distribution of the prediction value Sac* can be obtained:
 (18)
(18)
where
 (19)
(19)

 (20)
(20)
The covariance functions used in the present work is the Matern distance measure, which is formulated as follows:

 (21)
(21)
where ��f2 is the signal variance, and the matrix M=diag (I) is scaling factors. The hyper-parameters collection ��= {M, ��f2, ��n2} can be obtained by using the maximum likelihood method.
The log term of the posterior distribution of the prediction value Sac* can be expressed as:

 (22)
(22)
Then, the partial derivatives of the log likelihood can be obtained, and in order to achieve the hyper-parameters, the optimization techniques such as conjugate gradient ascent [20] were used in the present work. After obtaining optimum solutions of hyper-parameters, GPR prediction result and its covariance of surface roughness can be obtained by using Eqs. (19) and (20).
3 Experimental validation and discussion
3.1 Validation experiments of theoretical surface roughness model
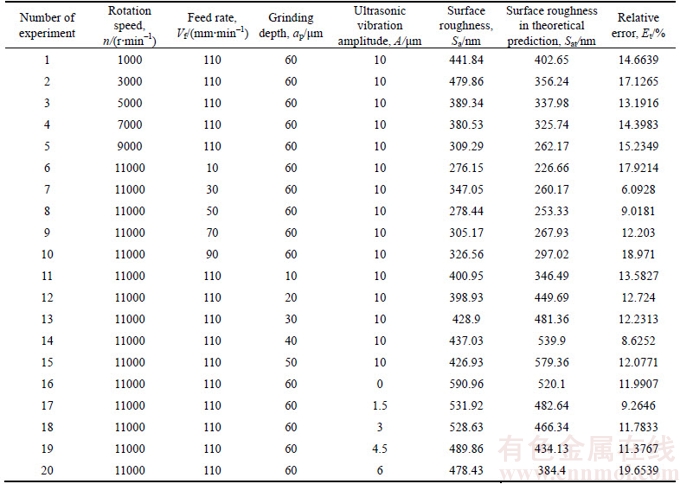
In order to verify the validity of the theoretical results for surface roughness, the ultrasonic vibration assisted grinding experiments of BK7 optical glass were carried out on a 5-axis precision ultrasonic vibration center (DMG Ultrasonic 70-5 linear). The cutting tool oscillates along the axial direction of the spindle at a frequency of 30 kHz during the experiments. A diamond wheel whose diameter is 4 mm was used as the grinding tool. Rectangular shaped BK7 optical glass samples with 50 mm in length, 50 mm in width and 6 mm in thickness were used as the workpiece. The grinding parameters and ultrasonic vibration parameters used in experiments are listed in Table 1.
Due to the huge amount of computation, the MATLAB software was used in both the theoretical calculation and GPR prediction for surface roughness. The theoretical results are also listed in Table 1.
Table 1 Grinding parameters and ultrasonic vibration parameters used in experiments
The relative error of theoretical results (Et) is defined as:
 (23)
(23)
And the average relative error of theoretical results (EAt) is calculated by:
 (24)
(24)
Figure 6 shows the comparison of theoretical and experimental results. It can be seen from Figure 6 that the whole changing tendency of theoretical and experimental results are roughly the same. But there exists a deviation to some extent between two kinds of results in several experiments. By using Eq. (24), the EAt in theoretical results is 13.11%.
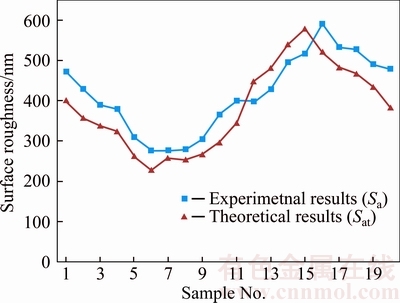
Figure 6 Comparison of theoretical and experimental results
The main reason of this deviation is that, in actual grinding process, the brittle fracture will strongly influence the morphologies and protrusion heights of machined surface. Figure 7 shows the surface morphologies when n=11000 r/min, Vf=110 mm/min, ap=10 ��m and A=10 ��m. It can be seen from Figure 7(a) that brittle fracture is in a large proportion and, some brittle fractures with large size distributed randomly on machined surface.
Several researchers have focused on the fracture forming mechanism in machining process of brittle materials [21], in this research, the fracture induced by one abrasive grain can be simplified as a half ellipse with three half-axis lengths of CL, CH and L/2, as shown in Figure 8, where CL is the lateral crack length, mm; CH is the lateral crack depth, mm; L is the effective cutting distance that an abrasive grain travels during effective cutting time ��t. In Figure 7(a), the zones marked as S1 and S4 are half well-developed half ellipse while zones S2 and S3 are well-developed half ellipses. Among them, zone S2 is induced by an abrasive grain whose protrusion height is relatively small while zone S3 is induced by an abrasive grain whose protrusion height is relatively big.
Figure 7(b) shows the zoomed image of zone S3. In Figure 7(b), Zone A marked as the yellow dotted block is the fracture zone, zone B and zone C are other two zones randomly selected on machined surface. Thus, in coordinate OXYZ established in Figure 5, the protrusion heights of zone A will be much lower than that of zone B and zone C. And according to the calculating method of surface roughness illustrated in Eq. (15), the sum of absolute value of protrusion heights in zone A and zone C will become bigger than that in zone B and zone C. That is:
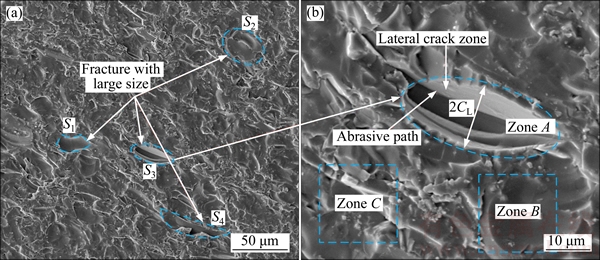
Figure 7 Surface morphologies when n=11000 r/min, Vf=110 mm/min, ap=10 ��m and A=10 ��m
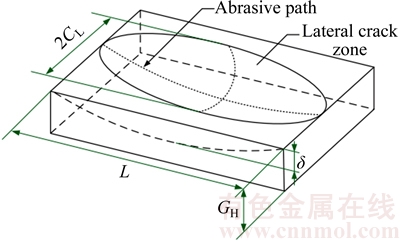
Figure 8 Fracture zone for one abrasive grain

 (25)
(25)
However, if the fracture sizes are roughly similar, the sum of protrusion heights on machined surface in experiments may be smaller than that in theoretical results. According to the analysis above, there will exist a deviation to some extent between two kinds of results in several experiments.
3.2 Validation experiments of GPR prediction model
In order to verify the validity of the proposed GPR surface roughness prediction model, another 12 sets of ultrasonic vibration assisted grinding experiments of BK7 optical glass were carried out. The experimental condition was the same with the validation experiments in section 3.1. The grinding parameters and ultrasonic vibration parameters used in experiments are listed in Table 2. And the GPR prediction results are also listed in Table 2.
The GPR prediction relative error is defined as:
 (26)
(26)
And the average GPR prediction relative error (EAc) of the prediction results is calculated by:
 (27)
(27)
Figure 9 shows the comparison of GPR prediction and experimental results. It can be seen from Figure 9 that the deviation between two kinds of results becomes much smaller than that in the validation experiments of proposed theoretical prediction model. By using Eq. (27), EAc in prediction results is 8.12%. From the prediction results, it can be seen that the correction prediction model for surface roughness is a good approach to achieve this object.
4 Conclusions
1) A theoretical surface roughness model has been developed to relate the grinding wheel morphologies and machining parameters to the abrasive trajectories in ultrasonic vibration assisted machining of glass materials.
2) The prediction model for surface roughness is developed by using GPR method due to the influence of brittle fracture on machined surface roughness.
Table 2 Grinding parameters and ultrasonic vibration parameters used in experiments
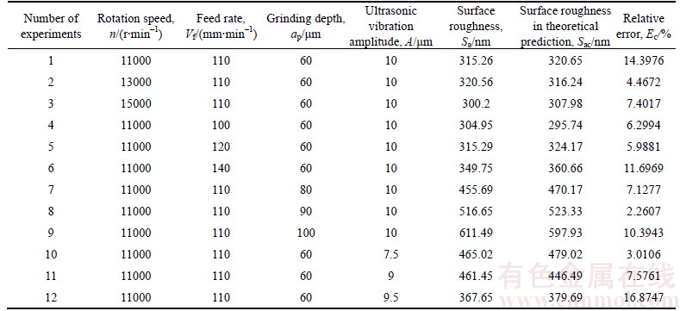
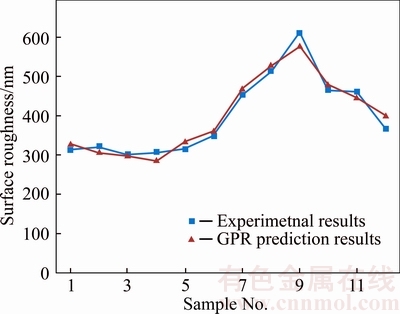
Figure 9 Comparison of GPR prediction and experimental results
3) The experimental results show that the maximum relative error and average relative error of the theoretical surface roughness model are 19.65% and 13.11%, respectively.
4) The maximum relative error and average relative error of the GPR surface roughness prediction model are 16.87% and 8.12%, respectively.
5) In actual grinding process, the brittle fracture with large size in height direction will strongly influence the morphologies and protrusion heights of machined surface.
6) The GPR prediction results can match well with the experimental results. It is believed that the prediction model for surface roughness is reliable.
In order to improve the accuracy of surface roughness prediction model, some other covariance functions should be compared to the one used in this work in the further work.
References
[1] BRINKSMEIER E, MUTLUGUNES Y, KLOCKE F, AURICH J C, SHORE P, OHMORI H. Ultra-precision grinding [J]. Manufacturing Technology, 2010, 59(2): 652�C671. DOI: 10.1016/j.cirp.2010.05.001.
[2] ONO T, MATSUMURA T. Influence of tool inclination on brittle fracture in glass cutting with ball end mills [J]. Journal of Materials Processing Technology, 2008, 202(1�C3): 61�C69. DOI: 10.1016/j.jmatprotec.2007.08.068.
[3] FANG Feng-zhou, ZHANG G X. An experimental study of optical glass machining [J]. International Journal of Advanced Manufacturing Technology, 2004, 23(3, 4): 155�C160. DOI: 10.1007/s00170-003-1576-3.
[4] ZHOU Ming, WANG X J, NGOI B K A, GAN J G K. Brittle-ductile transition in diamond cutting of glasses with the aid of ultrasonic vibration [J]. Journal of Materials Processing Technology, 2002, 121(2, 3): 243�C251. DOI: 10.1016/j.jmatprotec.2009.03.002.
[5] LIU Kui, LI Xiao-ping, RAHMAN M. Characteristics of ultrasonic vibration-assisted ductile mode cutting of tungsten carbide [J]. International Journal of Advanced Manufacturing Technology, 2008, 35(7, 8): 833�C841. DOI: 10.1007/s00170- 006-0761-6.
[6] FANG Feng-zhou, NI Hao, GONG Hu. Rotary ultrasonic machining of hard and brittle materials [J]. Nanotechnology & Precision Engineering, 2014, 12(3): 227�C234. DOI: 10.13494/j.npe.20130106.
[7] MAHADDALKAR P M, MILLER M H. Force and thermal effects in vibration-assisted grinding [J]. International Journal of Advanced Manufacturing Technology, 2014, 71(5�C8): 1117�C1122. DOI: 10.1007/s00170-013-5537-1.
[8] ZHANG Jian-hua, ZHAO Yan, TIAN Fu-qiang, ZHANG Shuo, GUO Lan-shen. Kinematics and experimental study on ultrasonic vibration-assisted micro end grinding of silica glass [J]. International Journal of Advanced Manufacturing Technology, 2015, 78(9): 1893�C1904. DOI: 10.1007/s00170- 014-6761-z.
[9] FENG Ping-fa, LIANG Gui-qiang, ZHANG Jian-fu. Ultrasonic vibration-assisted scratch characteristics of silicon carbide-reinforced aluminum matrix composites [J]. Ceramics International, 2014, 40(7): 10817�C10823. DOI: 10.1016/j.ceramint.2014.03.073.
[10] HE Yu-hui, ZHOU Qun, ZHOU Jian-jie, LANG Xian-jun. Comprehensive modeling approach of axial ultrasonic vibration grinding force [J]. Journal of Central South University, 2016, 23(3): 562�C569. DOI: 10.1007/s11771- 016-3103-3.
[11] DABNUN M A, HASHMI M S J, EIBARADIE M A. Surface roughness prediction model by design of experiments for turning machinable glass�Cceramic (Macor) [J]. Journal of Materials Processing Technology, 2005, 164�C165: 1289�C1293. DOI: 10.1016/j.jmatprotec.2005.02.062.
[12] ALI Y M, ZHANG Liang-chi. Surface roughness prediction of ground components using a fuzzy logic approach [J]. Journal of Materials Processing Technology, 1999, s89�C 90(99): 561�C568. DOI: 10.1016/S0924-0136(99)00022- 9.
[13] ZHANG Jian-hua, WANG Li-ying, TIAN Fu-qiang, ZHAO Yan, WEI Zhi. Modeling study on surface roughness of ultrasonic-assisted micro end grinding of silica glass [J]. International Journal of Advanced Manufacturing Technology, 2016, 86(1): 1�C12. DOI: 10.1007/s00170- 015-8181-0.
[14] PARK C, HUANG Jian-hua Z, DING Yu. Domain decomposition approach for fast Gaussian Process Regression of large apatial data sets [J]. Journal of Machine Learning Research, 2011, 12: 1697�C1728.
[15] MACKAY D J. Gaussian processes-a replacement for supervised neural networks [J]. Stochastic Modelling & Applied Probability, 1999, 11(3): 1�C5.
[16] QIAO Guo-chao, DONG Guo-jun, ZHOU Ming. Simulation and assessment of diamond mill grinding wheel topography [J]. International Journal of Advanced Manufacturing Technology, 2013, 68(9): 2085�C2093. DOI: 10.1007/s00170- 013-4807-2.
[17] LIU Yue-ming, WARKENTIN A, BAUER R, GONG Ya-dong. Investigation of different grain shapes and dressing to predict surface roughness in grinding using kinematic simulations [J]. Precision Engineering, 2013, 37(3): 758�C764. DOI: 10.1016/j.precisioneng.2013.02.009.
[18] GU Wei-bin, YAO Zhen-qiang, LIANG Xin-guang. Material removal of optical glass BK7 during single and double scratch tests [J]. Wear, 2011, 270(3, 4): 241�C246. DOI: 10.1016/j.wear.2010.10.064.
[19] CHENG Jun, GONG Ya-dong, WANG Jin-sheng. Modeling and evaluating of surface roughness prediction in micro- grinding on soda-lime glass considering tool characterization [J]. Chinese Journal of Mechanical Engineering, 2013, 26(6): 1091�C1100. DOI: 10.3901/CJME.2013.06.1091.
[20] RASMUSSEN C E. Gaussian processes in machine learning [M]. Advanced Lectures on Machine Learning. Springer, Berlin Heidelberg New York, 2004: 63�C71. DOI: 10.1007/ 978-3-540-28650-9-4.
[21] CONG Wei-long, PEI Zhi-jian, SUN X, ZHANG C L. Rotary ultrasonic machining of CFRP: A mechanistic predictive model for cutting force [J]. Ultrasonics, 2014, 54(2): 663�C675. DOI: 10.1016/j.ultras.2013.09.005.
(Edited by FANG Jing-hua)
���ĵ���
BK7��ѧ����������ĥ���ӹ�����ֲڶ�Ԥ��ģ��
ժҪ���ڹ�ѧ��������ӹ������У��Լӹ�����ֲڶȽ���Ԥ���������������칤����Ч�ʺͼ�С����ӹ��ɱ��Ĺؼ���ΪԤ����Բ��ϳ�����ĥ�������еļӹ�����ֲڶȣ����Ȼ�ȡ���ʯɰ�ֱ����ʵ������ò������ɰ�ֱ������ֻ�����ģ�ͣ�������������ĥ��������ĥ�����˶��켣�������ӹ�����ֲڶȵ�����Ԥ��ģ�͡������ӹ������в��ϴ��Զ��ѶԼӹ�����ֲڶ�Ӱ�����أ���˲��ø�˹���̻ع飨GPR������������Ԥ��ģ�ͽ�����������Ϊ��֤����ģ�ͺ�GPRģ�͵�ȷ�ԣ�����32��BK7��ѧ����������ĥ���ӹ�ʵ�顣�������������ģ�ͺ�GPRԤ��ģ�͵�ƽ�����ֱ�Ϊ13.11%��8.12%��GPRԤ��ģ������Ԥ������ʵ��ֵ�ǺϽϺá�
�ؼ��ʣ�����ֲڶȣ�Ԥ��ģ�ͣ���������ѧ��������˹���̻ع�
Foundation item: Project(51375119) supported by the National Natural Science Foundation of China
Received date: 2016-05-24; Accepted date: 2016-12-27
Corresponding author: ZHANG Yuan-jing, PhD Candidate; Tel: +86�C13654509846; E-mail: 11b908080@hit.edu.cn
Abstract: Pre-knowledge of machined surface roughness is the key to improve whole machining efficiency and meanwhile reduce the expenditure in machining optical glass components. In order to predict the surface roughness in ultrasonic vibration assisted grinding of brittle materials, the surface morphologies of grinding wheel were obtained firstly in the present work, the grinding wheel model was developed and the abrasive trajectories in ultrasonic vibration assisted grinding were also investigated, the theoretical model for surface roughness was developed based on the above analysis. The prediction model was developed by using Gaussian processing regression (GPR) due to the influence of brittle fracture on machined surface roughness. In order to validate both the proposed theoretical and GPR models, 32 sets of experiments of ultrasonic vibration assisted grinding of BK7 optical glass were carried out. Experimental results show that the average relative errors of the theoretical model and GPR prediction model are 13.11% and 8.12%, respectively. The GPR prediction results can match well with the experimental results.
