

Dynamic fracture of Ti-6Al-4V alloy in Taylor impact test
REN Yu1, TAN Cheng-wen1, 2, ZHANG Jing1, WANG Fu-chi1
1. School of Materials Science and Engineering, Beijing Institute of Technology, Beijing 100081, China;
2. Laboratory of Advanced Materials Behavior Characteristics, Beijing Institute of Technology and
Institute of Space Medico-Engineering, Beijing 100081, China
Received 1 February 2010; accepted 19 April 2010
Abstract:
The dynamic fracture behaviors of Ti-6Al-4V alloy at high strain rate loading were investigated systemically through Taylor impact test, over the range of impact velocities from 145 m/s to 306 m/s. The critical impact velocity of fracture ranges from 217 m/s to 236 m/s. Smooth surfaces and ductile dimple areas were observed on the fracture surfaces. As the impact velocity reached 260 m/s, the serious melting regions were also observed on the fracture surfaces. Self-organization of cracks emerges when the impact velocity reaches 260 m/s, while some special cracks whose ��tips�� are not sharp but arc and smooth, and without any evidence of deformation or adiabatic shear band were also observed on the impact end surfaces. Examination of the sections of these special cracks reveals that the cracks expand along the two maximum shear stress directions respectively, and finally intersect as a tridimensional ��stagger ridge�� structure.
Key words:
Ti-6Al-4V alloy; dynamic fracture behavior; adiabatic shear band; Taylor impact test;
1 Introduction
Ti-6Al-4V alloy is the most widely used titanium alloy[1], due to its attractive specific strength, low density, corrosion resistance and so on. The dynamic mechanical behaviors of Ti-6Al-4V alloy on the impact loading conditions have been widely investigated over the past decade, and most focused on the deformation and fracture manners of this alloy which underwent traditional split Hopkinson bar (SHB) test or ballistic test[2-5]. But only few authors researched fracture phenomena and fracture mechanisms for this alloy in the Taylor impact test which involves higher strain rate loading condition than SHB.
In a Taylor impact test, a deformable flat-nosed cylinder made of the investigated material is fired against a fixed, rigid target. This test was originally used to determine the dynamic yield stress of materials (Taylor, 1948)[6], but as large plastic deformation, high strain rate and elevated temperature are involved, the Taylor test is also widely used to verify or modify the material constitutive equations[7-10]. Adiabatic shear bands (ASBs), cracks or fragments will be generated in the Taylor test if the specimen impacts the rigid target at a sufficiently high impact velocity. STEVENS and BATRA[11] found that in tungsten heavy alloy (WHA), shear bands form near the transition between the mushroomed region and the relatively undeformed portion of the rod, and the initial softening rates of materials can affect formation of shear bands[11]. COUQUE et al[12] observed shear cracks along the maximum shear stress direction of the tungsten alloy Taylor specimen, and found a linear dependence between the impact velocity and the shear crack length. LIU et al[13] found that the different behaviors of adiabatic shear bands due to the distinct microstructures could influence the fracture manners of Ti-6Al-4V alloy in Taylor test. TENG et al[14] simulated the fracture process in Taylor test and three different fracture modes, the confined fracture inside the cylinder, the shear cracking on the lateral surface and the petalling, were obtained numerically.
In this work, we investigated systematically fracture phenomena and fracture mechanisms of the Ti-6Al-4V alloy with bimodal microstructure by a series of Taylor impact tests.
2 Experimental
2.1 Material and specimens
In the current study, all specimens were made of the conventional commercial Ti-6Al-4V alloy, whose chemical compositions are listed in Table 1. Before being tested, the alloys are in the bimodal (��+��) state at room temperature after the following heat treatment process: annealed at 950 ��C for 1 h in the ��+�� region, and cooled down in the air to room temperature. Fig.1 shows the typical metallography of the bimodal microstructure of the alloy, consisting of the predominant equiaxed ��, whose grain size is between 20 and 50 ��m, and acicular ���� and transformed �� matrix, whose length is between 30 and 40 ��m.
Table 1 Chemical compositions of Ti-6Al-4V alloy (mass fraction, %)
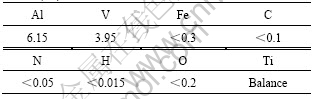
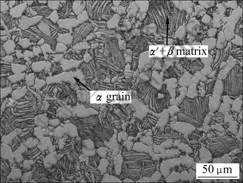
Fig.1 Optical microstructure of Ti-6Al-4V alloy before test
The cylindrical specimens (see Fig.2(a)) are 7.8 mm in diameter and 25 mm in length, and the ratio of length to diameter is approximate 3.2. A lathe was employed to
cut the specimens from the alloy bars, and then the two ends of each specimen were ground to ensure an adequate planeness for the subsequent Taylor impact test.
2.2 Taylor impact test
A traditional Taylor impact test device was used, as shown in Fig.2(b). The cylinder was fired with a powder gun against a rigid 603 Armored Steel target and a counter was employed to get the velocity of the specimen before impacting on the rigid target. The tests were performed over a broad range of impact velocities, from 145 m/s to 306 m/s. After being impacted, the deformed projectiles were all recovered; and if the specimen fractured, the fragments split away from the cylinder would be also recovered as more as possible.
The impact end surfaces of the recovered projectiles were carefully examined by optical microscope (OM). For this, the heads of the deformed specimens and the fragments of the fractured cylinders were mounted, polished, and then etched in a solution of 2% HF, 10% HNO3, and 88% H2O (volume fraction) for about 10 s before observation. In addition, the fracture surfaces of the fractured cylinders were also observed detailedly by scanning electron microscope (SEM).
3 Results
3.1 Macro-morphologies of Taylor cylinders
According to the analysis of TAYLOR[6], the distortion of the specimen is entirely confined to the head of the projectile, and the total plastic strain (��p) of the portion which has yielded would be
![]() (1)
(1)
where L0, L1 and L2 are the original length of specimen, the residual length of specimen after impact and the final length of the undeformed segment of the projectile, respectively.
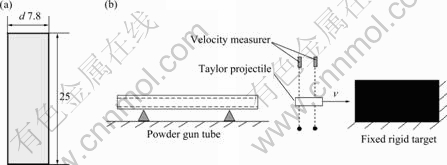
Fig.2 Shape and dimensions of cylinder specimen used for Taylor impact test (unit: mm) (a) and schematic diagram of Taylor impact test device (b)
Since the deceleration is assumed uniform, the duration of impact, T, is given by
![]() (2)
(2)
where v is the impact velocity.
So that the mean strain rate of the specimen (![]() ) in a Taylor impact test can be calculated with measurement of the recovered deformed projectile, and the equation is given as
) in a Taylor impact test can be calculated with measurement of the recovered deformed projectile, and the equation is given as
![]() (3)
(3)
In this work, the impact velocity ranges from 145 m/s to 306 m/s, and the mean rate of strain of each specimen is calculated and listed in Table 2, ranging from 1.17��104 s-1 to 2.01��104 s-1.
According to the plastic deformation and fracture characteristics, which are also listed in Table 2, the projectiles with the increase of impact velocity can be classified into three main stages, as shown in Fig.3. When the impact velocity is low, ranging from 145 m/s to 214 m/s, only plastic deformation is observed on the head of the projectiles, which is called ��only plastic deformed stage��. As shown in Fig.3(a), in this stage, there are several clusters of plastic flow lines observed on the lateral surface of the projectile along the direction of compression. Fig.4 presents the relationship between the impact velocity (v) and the total plastic strain of the yielded portion (��p) which is calculated by Eq.(1). It can be seen from Fig.4 that the extent of plastic deformation
of the head of specimen is approximate linear dependence on the increase of the impact velocity in only plastic deformed stage. As the impact velocity increases, the alloy begins to fracture and turns into the ��critical fractured stage��. The critical impact velocity of fracture
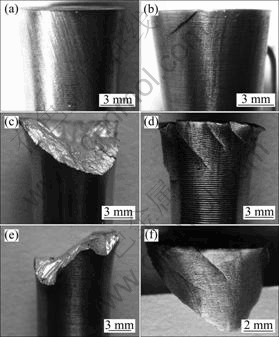
Fig.3 Morphologies of plastic deformed and fractured projectiles with increase of impact velocity: (a) v=198 m/s; (b) v=224 m/s; (c) and (d) v=260 m/s; (e) v=282 m/s; (f) Fragment splitting away from cylinder, v=282 m/s
Table 2 Experimental parameters and results
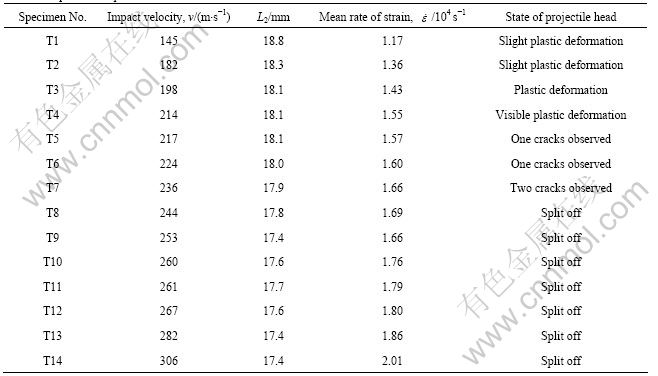
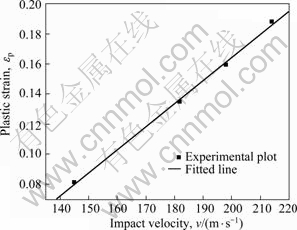
Fig.4 Approximate linear dependence between the impact velocity (v) and the plastic strain of the specimen (��P) when impact velocity being low
ranges from 217 m/s to 236 m/s. Fig.3(b) presents the typical specimen in this stage: only one or two cracks can be examined on the head lateral surface of the projectile with an angle of about 45�� with the impact end surface, which is the evident characteristic of specimens in critical fractured stage. When the impact velocity exceeds 236 m/s, specimens fracture seriously, and the head of all projectiles splits off. Fig.3(c) shows the specimen loaded with the velocity in ��complete fractured stage��. The specimen presents a typical sheared fracture surface and Fig.3(d) reveals that more than one parallel cracks can be observed on the head lateral surface of the projectile in this stage. As we further increase the impact
velocity to larger than 260 m/s, the fracture surface of projectiles is rugged, and cracks also appear on the lateral surface of the fragment splitting away from the cylinder, as shown in Figs.3(e) and (f).
Some researchers[15-19] have noticed that, on certain loading conditions, such as the radial collapse of a thick-walled cylinder, the shear bands do not expand randomly, but with a well established and characteristic pattern, which is called ��self-organization��. In the current test, we also observed a similar phenomenon. Fig.3(d) shows some regularly distributed cracks emerging on the lateral surface of the projectile when the impact velocity exceeds 236 m/s. As we further increase the impact velocity, the distribution of cracks around the edge of the impact end surface is also not random, but symmetrical. Fig.5 presents the main cracks almost expanding towards the centre of the specimens on the impact end surface as a ��self-organization�� pattern. At the same time, the higher the impact velocity achieves, the more symmetrical the cracks distribute. The cracks expand along the shear bands, so the regularly spaced adiabatic shear bands result in these self-organized cracks.
3.2 Observation of fracture surfaces
Microscopic analyses of fracture surface of the recovered cylinders in the complete fractured stage were carried out by SEM, as shown in Fig.6. In a relatively low impact velocity range, the fracture surface can be classified into two main areas, namely the ��smooth and smeared surface�� and the ��ductile dimple area��, which
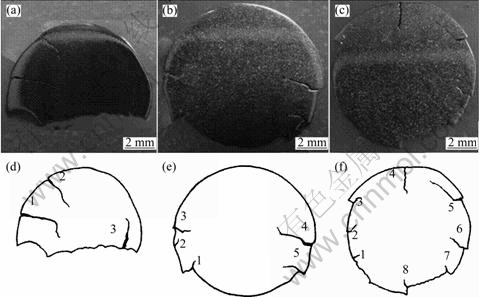
Fig.5 Distribution of cracks on impact end surface with different impact velocities: (a) v=261 m/s; (b) v=267 m/s; (c) v=282 m/s; (d), (e), (f) Schematic diagrams of (a), (b) and (c), respectively
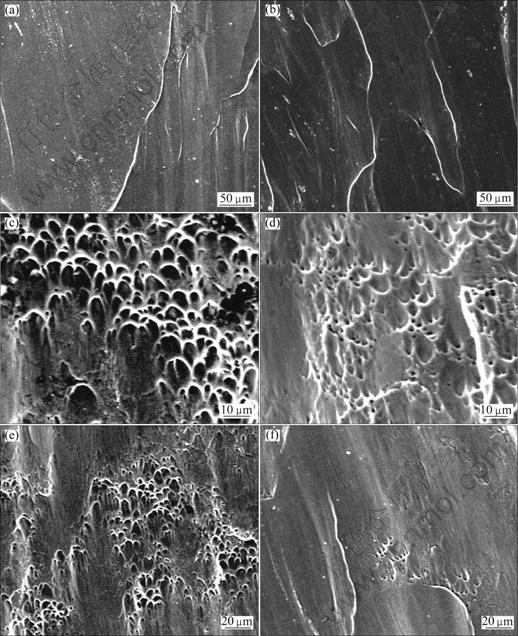
Fig.6 SEM fractographs of fracture surface with relatively low impact velocities: (a) Smooth smeared surface, v=244 m/s; (b) Smooth smeared surface, v=253 m/s; (c) Ductile dimple area, v=244 m/s; (d) Ductile dimple area, v=253 m/s; (e) Boundary between these two areas, v=244 m/s; (f) Boundary between these two areas, v=253 m/s
have been reported by other investigators[2, 13] (see Figs.6(a)-(d)). The smooth and smeared surface corresponds to the upper and center location of the fracture surface. Meanwhile, the ductile dimple area is on the side and nether fringe of the fracture surface and around the smooth and smeared area. On the whole fracture surface, the area of smooth and smeared surface is larger than ductile dimple area, and the boundary between these two areas is dim. In addition, as shown in Figs.6(e) and (f), several clusters of dimples distributing along the edges of the smooth surfaces were observed, and in certain areas, some elongated dimples were also
observed.
Fig.7 and Fig.8 present fracture surfaces of projectile loaded with higher impact velocities. As shown in Fig.7, when the impact velocity exceeds 260 m/s, there appears a new area, namely the ��serious melting region��, besides the ��smooth and smeared surface�� and the ��ductile dimple area��. These serious melting regions were always observed on the upper side of the smooth and smeared surface, which indicates that a significant melting of the original shear area material takes place prior to shear fracture of the specimen. In addition, in Figs.7(b) and (c), a large number of
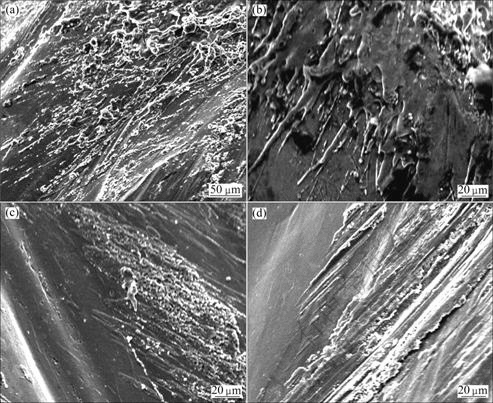
Fig.7 SEM micrographs of serious melting regions on fracture surface with high impact velocities: (a) v=260 m/s; (b) Amplificatory micrograph of (a); (c) v=282 m/s; (d) v=306 m/s
��splat-like and knobbly�� deposits and ��splash�� structures were observed, implying pressing and rubbing caused by mating displacement between the fragment and the fracture surface of the specimen in the shear fracture process, which maybe results in splashing of the melting alloy drops along the shear fracture direction, and Fig.7(d) reveals the trace of rubbing evidently.
Figs.8 (a) and (b) show the smooth and smeared surfaces under a high speed impact condition. By comparing with the instance at a relative low impact velocity, it presents no significant changes. But as shown in Figs.8(c) and (d), more and more dense and elongated dimples were observed, which indicates that the tensile stress within the shear band augments as the impact velocity increases. In the high impact velocity range, the boundaries between the smooth area and the ductile dimple area become clear. Besides, Figs.8(e) and (f) reveal that some relatively small smooth planes appear in the ductile dimple area, even the smooth areas and the ductile dimple areas emergence alternately in certain areas.
As is known to all, if metal or alloy is loaded with high strain rate, the plastic work will convert into heat in an ultra short time and result in the adiabatic temperature rise of the material. At the same time, inside the adiabatic shear band, where the highly localized deformation takes place, the temperature rises more sharply. In the present test, the sudden temperature rise within the ASB even exceeds over the melting point of the Ti-6Al-4V alloy, and makes for the absolute melting of the alloy in the main shear plane, as shown in Fig.7. The melted alloy liquid is propelled by the shear stress and flows on the shear plane along the direction of maximal shear stress, ultimately forms the main smooth and smeared surface on the center of the fracture surface (see Figs.6(a), 6(b), 8(a) and 8(b)). Meanwhile, on account of the tensile stresses in the tension zone surrounding the shear zone[4, 20], the ductile dimple areas form and distribute around the smooth and smeared surface. When the impact velocity reaches a relatively high speed, some small smooth planes appear in the ductile dimple area at the boundaries between the smooth surface and the dimple areas, as shown in Fig.8(e). Those small smooth surfaces may be caused by rubbing between the fragment and the fracture surface while the fracture surfaces are still soft due to the high temperature in the shear region[13]. On the other hand, the augment of the tensile stress, as a result of the increase of the impact velocity, accounts for the more elongation of the ductile dimples and then results in the alternate emergence of the smooth areas and the ductile dimple areas (Fig.8(f)). In addition, as shown in Fig.9, the
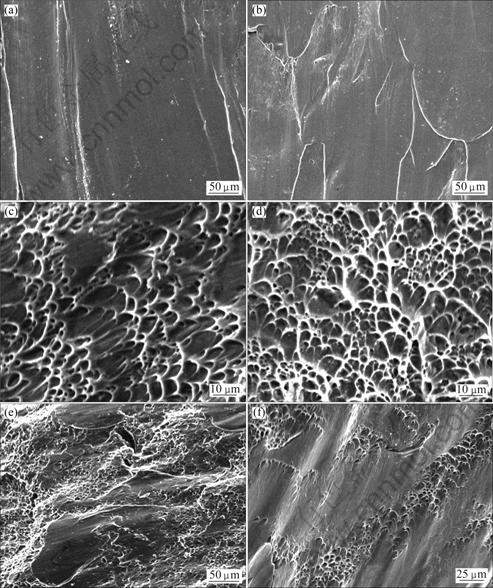
Fig.8 SEM fractographs of fracture surface with high impact velocities: (a) Smooth and smeared surface, v=282 m/s; (b) Smooth and smeared surface, v=306 m/s; (c) Ductile dimple area, v=282 m/s; (d) Ductile dimple area, v=306 m/s; (e) Small smooth planes in ductile dimple area, v=282 m/s; (f) Alternate smooth areas and ductile dimple areas, v=306 m/s
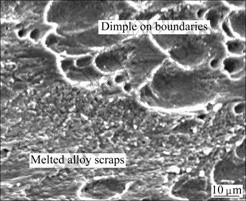
Fig.9 SEM micrograph of melted alloy scraps filling in dimples at impact velocity of 306 m/s
mating displacement between the fragment and the fracture surface of the specimen can also ��transport�� scraps of the melted alloy from the melting regions to the boundaries between the smooth surface and the dimple areas, and those melted alloy scraps filling in the dimples can also form some smooth planes on the boundaries between the smooth surface and the dimple areas.
3.3 Adiabatic shear bands and cracks
The metallographic analyses of the impact end surface of specimens in the ��critical fractured stage�� and the ��complete fractured stage�� were studied by optical microscope. Fig.10 shows the single white adiabatic shear band without branching off, which is observed in the critical fractured stage specimens. By comparing with those formed on the SHB loading condition, reported in Ref.[13], the shear bands formed in the Taylor test are narrower and longer due to the more acute shear localization deformation in Taylor impact condition. Several dispersive voids distribute along the shear bands, which indicates that the specimen is in the initial step of fracture.
Fig.11 shows that some developed cracks and more shear bands were observed in the complete fractured stage specimens with increasing impact velocity. These shear bands are longer than those in the critical fractured stage specimens. A few dispersive voids and a series of long and narrow small cracks distribute along the shear
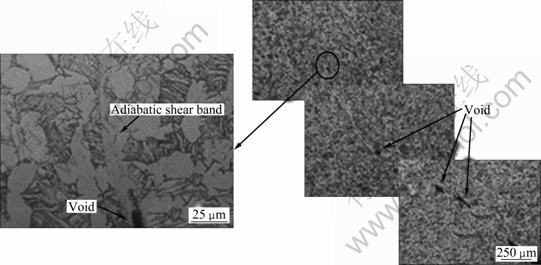
Fig.10 Optical micrographs of adiabatic shear band on impact end surface of critical fractured stage specimen at impact velocity of 236 m/s
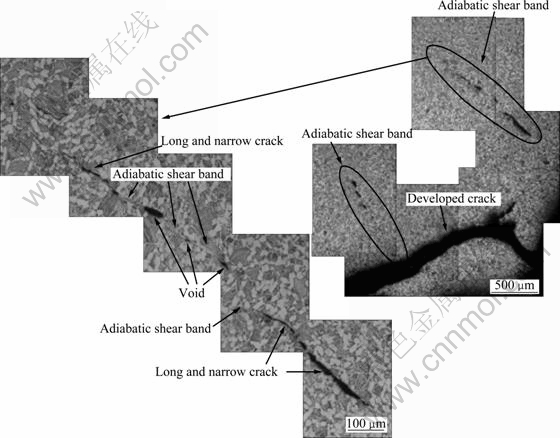
Fig.11 Optical micrographs of main crack and adiabatic shear bands branching off from main crack at impact velocity of 253 m/s
band, which imply the nucleation, growth and coalescence of voids along adiabatic shear bands is the major reason for the fracture of the Taylor projectiles.
When the impact velocity reaches 260 m/s, some interesting phenomena are noticed. Besides developed cracks and relatively small normal cracks with shear bands on the tip of crack, as shown in Fig.11, there are some distinct cracks. Fig.12 presents these special cracks, whose tips are not sharp but arc and smooth, and any evidence of deformation or ASB are not observed in the microstructures surrounding these tips of cracks. A more detailed discussion about these special cracks is given in section 4.
4 Discussion
To investigate the expansion mode of the cracks within the specimens, the longitudinal sections of the fragment splitting away from the projectile were also examined systemically by optical microscope. Fig.13 shows that three sections were cut from one of the cracks on the impact end surface of the specimen along the ��expansion direction�� of the crack. On section 1, which is far from the crack ��tip��, there is a developed crack with an adiabatic shear band in the front of it, and the crack makes an angle of about 45�� with the impact end surface, denoted as crack 1. This crack expanded on a shear plane (denoted as shear plane 1) along the direction of the maximum shear stress, as reported in Refs.[12, 14], and linked another crack with the shear band finally. On the section 3 which is the nearest to the crack ��tip��, a similar adequately grown crack was observed. But this crack expanded on the opposite direction against the crack 1. According to the uniform view direction of section 1 and section 3, it identifies that this is a new crack, denoted as crack 2, expanding along another shear plane (shear plane 2). There is also an adiabatic shear band in the front of the crack 2 and some long and narrow cracks caused by microvoids connection were observed. On the section 2 which locates between section 1 and section 3, the junction of crack 1 and crack 2 is presented clearly. According to the diverse extension length of crack 1 on the section 1 and section 2, we can make sure that the crack 1 expanded from external and upside to inside and lower side of the specimen, at the same time, the crack 2 expanded from internal and upper to external and downward of the specimen verified by the diverse extension length of crack 2 on the section 2 and section 3. The two shear planes are cuneiform and make an angle of about 45�� with the impact end surface. Finally, these two cracks intersected and formed a tridimensional ��stagger ridge�� structure. The normal
stress forms two maximum shear stresses on the opposite direction with an angle of 90��; so the two cracks, which expanded respectively along the shear plane 1 and the shear plane 2, intersected even at an angle of about 90��, as shown on section 2 in Fig.13.
The cracks on the impact end surface are actually a cross-section and top-view of the real three-dimensional stagger ridge structure, meantime, the view of the sections is a series of side-view of the real three-dimensional stagger ridge structure. So the single crack on the impact end surface is corresponding to the vertical view of a roof ridge and is the intersection line between the two shear planes practically. Therefore, the ��tip�� of the crack on the impact end surface is in fact the origination site of another crack (such as crack 2 discussed above). We could not observe any evidence of deformation or ASB in the microstructures surrounding these tips of cracks (see Fig.12) because the crack expands along the opposite direction.
Fig.14 presents the expansion of cracks and the forming process of the tridimensional stagger ridge structure schematically. As shown in Fig.14(a), the stagger ridge structure consists of two shear planes. These two shear planes intersect at an angle of 90��, and the intersecting sides of these two shear planes are not coincident absolutely. Fig.14(b) shows the expanding process of cracks and forming process of the tridimensional ��stagger ridge�� structure. Firstly, two cracks nucleate on the two different maximum shear stress planes (marked as shear plane 1 and shear plane 2, respectively). Then, these two cracks expand head-on along the maximum shear stress planes. Finally, these two cuneiform cracks encounter and intersect as a three-dimensional ��stagger ridge�� structure. And on the impact end surface, the intersecting line looks like a single crack. Based on the above discussion, under certain loading conditions, some ��special cracks�� without adiabatic shear band on its tip can form due to the complicated stress state. So, we should not simply consider that there is independent between those cracks and adiabatic shearing, and more in-depth studies are required.
In addition, it is recognized that the shear stress field in the specimen during the loading process is so complicated that there maybe exist many shear planes on the different shear directions[14]. These shear planes intersect each other and the cracks expand through the specimen along these shear planes, resulting in more than one fragments splitting away from the specimen, and finally forming a rugged fracture surface, as shown in Fig.3(e).
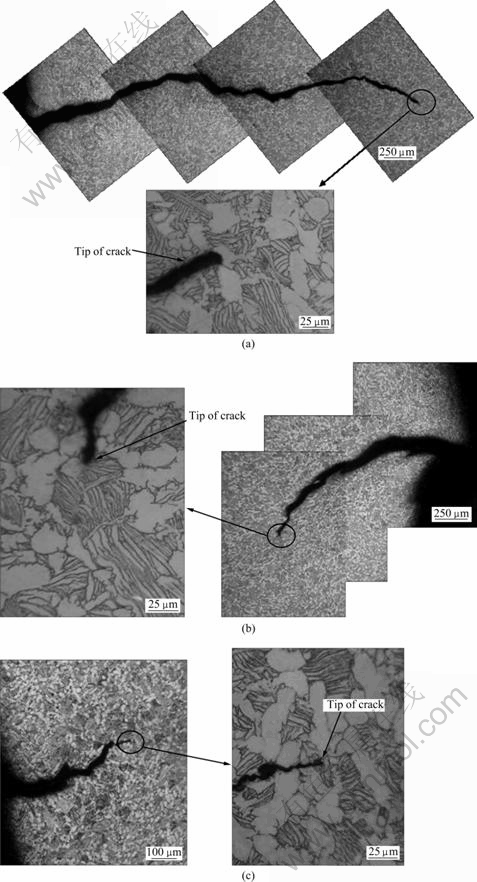
Fig.12 Optical micrographs of crack without any deformation or ASB surrounding tip of it: (a) v=261 m/s; (b) v=267 m/s; (c) v=282 m/s
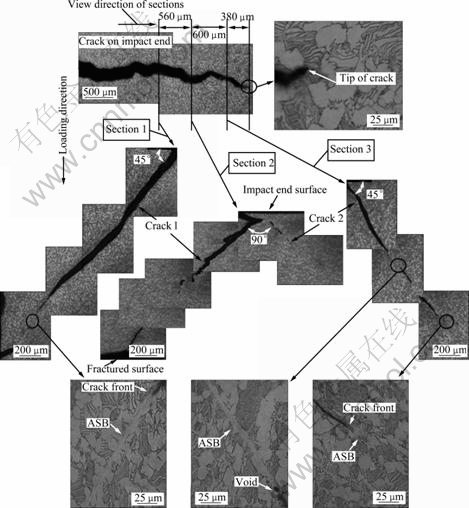
Fig.13 Optical micrographs of sections of crack on impact end surface at impact velocity of 260 m/s
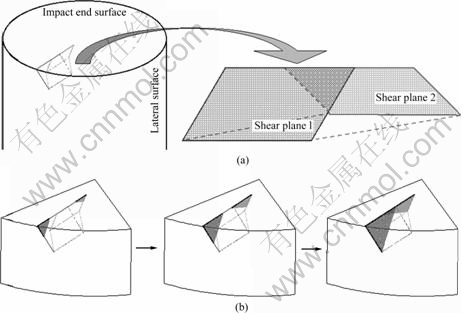
Fig.14 Schematic diagrams of tridimensional ��stagger ridge�� structure (a), and expanding process of cracks and forming process of tridimensional ��stagger ridge�� structure (b)
5 Conclusions
1) As the impact velocity increases, the deformation and fracture states of Taylor projectiles can be classified into three main stages, namely only plastic deformed stage, critical fractured stage, and complete fractured stage. In the complete fractured stage, the self-organization of the cracks emerges.
2) The main smooth and smeared surfaces existing on the fracture surface form due to the shear flow of the melting alloy within the main shear planes, while those relatively small smooth planes are maybe engendered by rubbing, elongating of the ductile dimples, and filling dimples with melted alloy scraps.
3) The cracks observed on the impact end surface are actually the top view of the intersection line between the two shear planes, and the ��tip�� of the crack is in fact the origination site of another crack. This proves that cracks expand along the two maximum shear stress directions respectively, and finally intersect as a tridimensional ��stagger ridge�� structure.
4) The complicated state of shear stresses results in the intersection of many shear planes, and expansion of cracks along these shear planes leads to more fragments splitting away from the head of the projectile, so a rugged fracture surface forms eventually.
Acknowledgements
The authors would like to thank the technical support of North University of China, and the help of Professor PEI Si-xing and Doctor LIANG Zeng-you in the Taylor test.
References
[1] HUANG Bai-yun. Status and developing strategy for Chinese nonferrous metal materials industry [J]. The Chinese Journal of Nonferrous Metals, 2004, 14(S1): 122-127. (in Chinese)
[2] BAR Y M, ROSENBERG Z. On the correlation between the ballistic behavior and dynamic properties of titanium-alloy plates [J]. Int J Impact Eng, 1997, 19(4): 311-318.
[3] LIAO S C, DUFFY J. Adiabatic shear bands in a TI-6Al-4V titanium alloy [J]. J Mech Phys Solids, 1998, 46(11): 2201-2231.
[4] SIA N N, GUO W G, VITALI F N, INDRAKANTI S S, GU Y B. Dynamic response of conventional and hot isostatically pressed Ti-6Al-4V alloy: Experiments and modeling [J]. Mech Mater, 2001, 33: 425-439.
[5] WANG B F, YANG Y. Microstructure evolution in adiabatic shear band intitanium alloy TC16 [J]. The Chinese Journal of Nonferrous Metals, 2007, 17(11): 1767-1772. (in Chinese)
[6] TAYLOR G. The use of flat-ended projectiles for determining dynamic yield stress [J]. Proc Roy Soc, 1948, 194(1038): 289-300.
[7] MAUDLIN P J, GRAY G T III, CADY C M, KASCHNER G C. High-rate material modeling and validation using the Taylor cylinder impact test [J]. Phil Trans R Soc Lond A, 1999, 357(1756): 1707-1729.
[8] ROHR I, NAHME H, THOMA K. Material characterization and constitutive modelling of ductile high strength steel for a wide range of strain rates [J]. Int J Impact Eng, 2005, 31: 401-433.
[9] CINNAMON J D, PALAZOTTO A N, KENNAN Z. Material characterization and development of a constitutive relationship for hypervelocity impact of 1080 steel and Vasco Max 300 [J]. Int J Impact Eng, 2006, 33: 180-189.
[10] ROHR I, NAHME H, THOMA K, ANDERSON C E Jr. Material characterisation and constitutive modelling of a tungsten sintered alloy for a wide range of strain rates [J]. Int J Impact Eng, 2008, 35: 811-819.
[11] STEVENS J B, BATRA R C. Adiabatic shear bands in the Taylor impact test for a WHA rod [J]. Int J Plasticity, 1998, 14(9): 841-854.
[12] COUQUE H, NICOLAS G, ALTMAYER C. Relation between shear banding and penetration characteristics of conventional tungsten alloys [J]. Int J Impact Eng, 2007, 34: 412-423.
[13] LIU X Q, TAN C W, ZHANG J, HU Y G, MA H L, WANG F C, CAI H N. Influence of microstructure and strain rate on adiabatic shearing behavior in Ti-6Al-4V alloys [J]. Mater Sci Eng A, 2009, 501: 30-36.
[14] TENG X, WIERZBICKI T, HIERMAIER S, ROHR I. Numerical prediction of fracture in the Taylor test [J]. Int J Solids Struct, 2005, 42: 2929-2948.
[15] GRADY D E, KIPP M E. The growth of unstable thermoplastic shear with application to steady-wave shock compression in solids [J]. J Mech Phys Solids, 1987, 35(1): 95-118.
[16] WRIGHT T W, OCKENDON H. Research note: A scaling law for the effect of inertia on the formation of adiabatic shear bands [J]. Int J Plasticity, 1996, 12(7): 927-934.
[17] MOLINARI A. Collective behavior and spacing of adiabatic shear bands [J]. J Mech Phys Solids, 1997, 45(9): 1551-1575.
[18] NESTERENKO V F, MEYERS M A, WRIGHT T W. Self-organization in the initiation of adiabatic shear bands [J]. Acta Mater, 1998, 46(1): 327-340.
[19] XUE Q, MEYERS M A, NESTERENKO V F. Self-organization of shear bands in titanium and Ti-6Al-4V alloy [J]. Acta Mater, 2002, 50: 575-596.
[20] LEE W S, LIN C F, CHENA T H, HWANG H H. Correlation of dynamic impact properties with adiabatic shear banding behaviour in Ti-15Mo-5Zr-3Al alloy [J]. Mater Sci Eng A, 2008, 475: 172-184.
Taylor�˳��������Ti-6Al-4V�Ͻ�Ķ�̬����
�� ��1, ̷����1, 2, �� ��1, ������1
1. ����������ѧ ����ѧԺ, ����100081;
2. ����������ѧ���й�����Ա����ѵ������ �Ƚ�������Ϊ��������ʵ����, ���� 100081
ժ Ҫ��ͨ��Taylor�˳��ʵ�飨ײ���ٶȷ�ΧΪ145-306 m/s���о�Ti-6Al-4V�Ͻ��ڸ�Ӧ���ʼ��������µĶ�̬������Ϊ���о��������úϽ���ٽ������ٶ�Ϊ217-236 m/s����ײ���ٶ�������260 m/sʱ�������Ͽڱ����ƽ�������������⣬���������Ե��ۻ���������ͷ���������Ʒֲ����ֳ�����֯����������ײ���������Բ��״ͷ�����������ƣ���δ������ǰ�˷��ֱ�����֯�����ȼ��д����������������Ҳ�����ھ��ȼ��д����γɵģ���������Ӧ�������κˡ���չ���������ཻ�γ���ά�������ݼ���״�ṹ��
�ؼ��ʣ�Ti-6Al-4V�Ͻ𣻶�̬������Ϊ�����ȼ��д���Taylor�˳��ʵ��
(Edited by LI Xiang-qun)
Foundation item: Project (51001014) supported by the Young Scientists Fund of the National Natural Science Foundation of China
Corresponding author: TAN Cheng-wen; Tel: +86-10-68912712; Fax: +86-10-62890250; E-mail: tanchengwen@126.com
DOI: 10.1016/S1003-6326(11)60703-6
