
�ѽ������п���ɢ�������϶�ߴ���ݻ�����
�� ��1����� 2, 3���Ⱞ��1�����齭1
(1. �����Ƽ���ѧ ��ľ�뻷������ѧԺ��������100083��
2. ���ϴ�ѧ ��Դ�밲ȫ����ѧԺ������ ��ɳ��410083��
3. �������⾭��ѧԺ ������ͨ�Ź���ѧ�������� ��ɳ��410205)
ժ Ҫ��
ժ Ҫ������X����CT���������˵�̽��ϸ������ǰ�������ɢ����ʿ�϶�ṹ����������MATLAB������д����Կ���ɢ����ʿ�������������϶�ߴ�ֲ�����ͳ�ƣ��о�ϸ�����������п���ɢ�������϶�ߴ��ݻ����ɼ�����ܽ�Һ�������Ե�Ӱ�졣�о��������������ɢ����ʿ�϶�ߴ�ֲ������ȣ��ֲ���Χ�㣬��������̬���ɷֲ��������������еȿ�϶�ʹ��϶�������ӣ�С��϶�������٣��ײ������еȿ�϶Ҳ�������ӣ���С��϶�������٣�������϶�������٣�������϶�����仯�����ԣ�������ƽ����϶�ߴ�Ƚ���ǰ���������϶�������ӣ���ǿ�˽��ѵ������������ԣ�ϸ���������ƺͳ����Կ�϶�ߴ��ݻ�Ӱ��̶����
�ؼ��ʣ�
ϸ���ѽ�������ɢ���������϶�ߴ���CT������ͼ�������
��ͼ����ţ�TF18 ���ױ�־�룺A ���±�ţ�1672-7207(2009)06-1712-06
Pore size evolution of granular ore media during heap leaching
SONG Xin1, YANG Bao-hua2, 3, WU Ai-xiang1, WANG Hong-jiang1
(1. School of Civil and Environment Engineering, University of Science and Technology Beijing,Beijing 100083, China;
2. School of Resources and Safety Engineering, Central South University, Changsha 410083, China;
3. College of Electrical and Information Engineering, Hunan International Economics University, Changsha 410205, China)
Abstract: The pore structure characteristics of granular ore media before and after bacteria heap leaching were detected by X-ray computed tomography. Based on MATLAB software, the cross sectional and longitudinal pore size distributions of granular ore media were calculated to investigate the evolution of granular ore media��s pore size distribution during heap leaching and its influences on permeability. The results show that intergranular pores are inhomogeneous. The pore size ranges widely and assumes a normal distribution. After leaching, the amounts of middle and large pores at top zone increase, while the amount of small pores decreases. The amount of middle pores at bottom zone increases, small pores decrease, cross sectional large pores decrease, and the longitudinal large pores have no obvious change. Average pore size increases after leaching, so the ratio of large pores increases and the permeability anisotropy is strengthened. The transport and precipitation of fine particles is the most critical factor for the evolution of pore size distribution.
Key words: bacteria heap leaching; granular ore media; pore size; CT technology; image analysis
�ѽ�ϵͳ�еĿ���ɢ�����ɲ�ͬ��������״��������Ŀ�ʯ�����ѻ����ɵ���ɢ����ʣ����γɵĿ�϶�ṹ�dz�����[1]���ڽ��������У�����ɢ������ܶ������ص�Ӱ��[2-4]�����������ء���ѧ���ء��������صȣ���Щ����֮��������ֱ�ӵ��¿���ɢ���϶�ʡ���϶�ߴ缰��϶��ͨ�Եȿ�϶�ṹ���������仯���Ӷ���һ��Ӱ�쵽�ܽ�Һ������Ч�����������ʼ����ս����ʡ���ˣ�̽����϶�ṹ�ڶѽ������е��ݻ����ɣ������ڽ�һ���˽��ܽ�Һ�ڶ��е��������ɣ�����ָ�����Ѽ���߽���Ч��������Ҫ���塣���ڶѽ���ϵ��϶�ṹ�ݻ������о�����ͳ�����鷽��ֻ�ܲ����������϶��[5]���������ͼ������ɢ��������϶�ߴ�Ƚṹ��������ˣ�������������϶�ṹ���ݻ����ɡ���������������ϲ�ɨ�輼��CT(Computed tomography)�������˵�̽���о������ڲ��ṹ�������ѱ�Ӧ���ڶ���ʿ�϶��������������������ʯ����ײ��ϵ�[6-11]�������ڶѽ��п���ɢ����ʿ�϶�ṹ���о����٣�Lin��[12-13]�����˳����о����Զѽ��п���ɢ����ʵĿ�϶�ʽ����˷������ڴˣ�����������CT������ͼ�������������������˿���ɢ�����ϸ������ǰ�����������������϶�ߴ缰��ռ�ֲ����ɣ����Կ�϶�ߴ�仯�������з�����
1 ʵ ��
1.1 ԭ ��
ʵ�����õĿ������Խ���ʡ����ͭ���ԭ������ѧԪ�ط���������������仯ѧ�ɷּ���ѧ�������1�ͱ�2��ʾ��
��1 �����Ļ�ѧ�ɷ�
Table 1 Chemical composition of ore sample w/%

��2��������ͭ�Ļ�ѧ����
Table 1 Chemical phases of Cu in ore sample w/%

1.2 ʵ�鷽��
�������Ͽ�����������������飬���õ��ܽ���Ϊ�л�������������Ϊ500 mm���ھ�Ϊ60 mm�����ȣ����ܽ�����װ����ͬ�����Ŀ��������������ֲ���ͼ1��
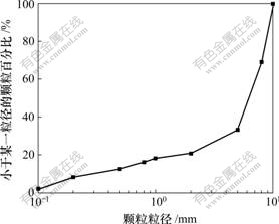
ͼ1 ��ͭ����������ֲ�
Fig.1 Particle size distribution of sulfide copper ore samples
Ϊ�˼�С�߱�ЧӦ������������������10 mm��Ϊ����Բ���ھ���1/6�����ţ�����CT�����ܽ�������ȫ��ɨ�裬ɨ��ϲ���Ϊ0.75 mm��ɨ������Լ700�Ŷ�άCTͼ���ܽ����еĿ���ɢ�����90 dϸ���������飬���������������ͬ�������ܽ�������ȫ��ɨ�裬�Ӷ���ý��������ɢ����ʿ�϶�ṹͼ��
1.3 ��϶�ߴ���㷽��
��������õĶ�άCTͼ�����Ƚ���ͼ��Ԥ����[14]������CT�Ҷ�ͼ��ת���ɶ�ֵ��ͼ��ͼ2���Բ�������ߴ��Բ���ͽṹԪ�ضԶ�ֵ��ͼ�������̬ѧ�����㣬�����ͳ�Ƴ���϶�ߴ�ķֲ����������Ƕ�ͼ���Ƚ��и�ʴ��Ȼ��������͡�����ÿһ�������㣬������������ֵ�ĺͣ��ڴ˻����ϣ����Լ���ijһ�ߴ�Ŀ�϶����ռ���п�϶�����İٷֱȡ����ڿ�϶����״��һ���ߴ粻�ȣ���ˣ���ȷ�����ÿһ����϶��ֱ�������ô��㷨������Ŀ�϶�ߴ�ʵ�����ǿ�϶��Բ����ֱ����
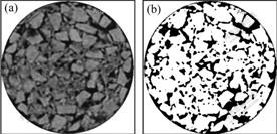
(a) ԭʼ�Ҷ�ͼ��(b) ��ֵ��ͼ��
ͼ2 ͼ��Ԥ��������
Fig.2 Preprocessing of CT images
2 ���������
2.1 �����϶�ߴ�ֲ�
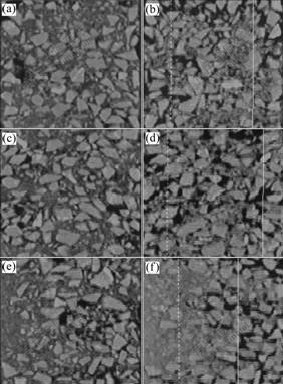
��Խ���ǰ������õ�CTͼ���ܽ������Ϊ475��250��22 mm����3��λ�ã��ֱ�ѡ��1��ͼ��(��ͼ3)�����У�ͼ3(a)~(c)��ʾΪ����ǰ�����ϡ��С��º����ͼ��ͼ3(d)~(f)��ʾΪ����������ϡ��С��º����ͼ��ͼ�����Ԥ�����Կ�϶�ʺͿ�϶�ߴ���м��㣬�ó�ͼ3(a)~(f)��ʾͼ��Ŀ�϶�ʷֱ�Ϊ34.03%��25.32%��28.66%��41.03%��27.12%��17.87%��
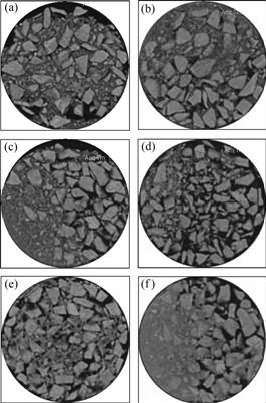
(a) ����ǰ�������ϲ�ͼ��(b) ���������ϲ�ͼ��(c) ����ǰ�������в�ͼ��
(d) ���������в�ͼ��(e) ����ǰ�������²�ͼ��(f) ���������²�ͼ��
ͼ3 ����ǰ�������ɢ����ͺ����ͼ��
Fig.3 Typical cross sectional images of granular media before and after leaching
Ϊ�˶Խ��������в�ͬʱ��Ͳ�ͬλ�õ�ɢ����ʺ����϶�ߴ���бȽϣ��ֱ�����˺����϶�ߴ�Ա�ͼ����ͼ4��ͼ5����ͼ4��֪���ڽ���֮ǰ���ܽ����ڿ���ɢ����ʵĿ�϶�ߴ�ֲ������ȣ��ܽ����ײ��������һЩ���϶(ֱ����5 mm)�����в�������ֿ�϶ֱ����С��4 mm�����������������϶�ߴ�ֲ���Խ���ǰ���ȣ�ֱ��Ϊ2 mm���ҵ��еȿ�϶�ֲ���Χ��㣬ͬʱ���ײ�����Ĵ��϶�������٣����������в�����(�����Ƕ�������)�Ĵ��϶�����������ӡ���ͼ5��֪�����������ڽ������еȿ�϶(ֱ��Ϊ1.8~3.0 mm)�ʹ��϶(ֱ����5.0 mm)���������������ӣ���С��϶(ֱ����1 mm)������ȴ������С���ڵײ�������϶������С��С��϶������������С�����ǣ��еȿ�϶(�ߴ�Ϊ1.80~3.96 mm)�������������ӡ��Խ���ǰ�����͵ײ�����Ŀ�϶�ߴ�ֲ�������̬�ֲ���ϣ����ֽ������϶�ߴ���̬�ֲ����ߵķ�ֵ����ƫ�ƣ�˵�����������ƽ����϶�ߴ���������
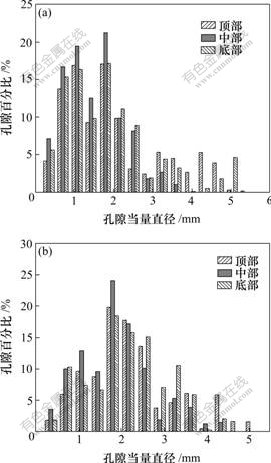
(a) ����ǰ��(b) ������
ͼ4 ����ǰ�����ܽ����ϡ��С���3�������϶�ߴ�Ƚ�
Fig.4 Comparisons of cross sectional pore size at top, middle and bottom zone before and after leaching
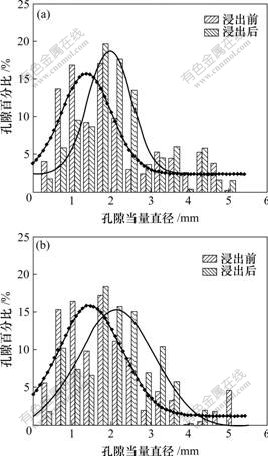
(a) �ܽ���������(b) �ܽ����ײ�
ͼ5 ����ǰ�����ܽ��������͵ײ������϶�ߴ�Ƚ�
Fig.5 Comparisons of cross sectional pore size at top and bottom zone before and after leaching
2.2 �����϶�ߴ�ֲ�
�ֱ����ܽ����ײ����в�����������ѡȡ100��ͼ�������ά�ع�[15]������ͬһ��λ���ع������ά�ṹ�������������ʿ��������ͼ6��
(a) ����ǰ������������(b) ��������������(c) ����ǰ�������в���(d) ���������в���(e) ����ǰ�������ײ���(f) ���������ײ�
ͼ6 �ܽ����п���ɢ�����ǰ����������
Fig.6 Longitudinal profiles of granular ore media before and after leaching
����ͬ��������3�������������ͼ���п�϶�ߴ���㡣Ϊ�˶Խ��������в�ͬʱ���λ�õĿ���ɢ����������϶�ߴ���бȽϣ��ֱ���������϶�ߴ�Ա�ͼ����ͼ7��ͼ8����ͼ7��֪������֮ǰ���ܽ����ڿ���ɢ��Ŀ�϶�ߴ�ֲ������ȣ������Ƕ�������С��϶(ֱ����1 mm)�ֲ�������ߣ�ͬʱҲ������һ�������Ĵ��϶(ֱ����5 mm)���в��͵ײ������϶�ߴ�ֲ���Ծ��ȣ����ֿ�϶�ߴ�С��3 mm�����������ײ����в�������������Ŀ�϶�ߴ�ֲ���Ծ��ȣ�ֱ��Ϊ2 mm���ҵĿ�϶�ֲ���㡣��ͼ8��֪�����������ڽ�����С��϶(ֱ���� 1 mm)�ʹ��϶(ֱ����5 mm)���������������٣���ֱ��Ϊ2 mm���ҵ��еȿ�϶���������������ӣ��ײ������ڽ�����С��϶(ֱ����1 mm)������ͬ���������٣����϶�����仯�����ԣ���ֱ��Ϊ2 mm���ҵ��еȿ�϶�������������ӡ�ͨ���Խ���ǰ�����͵ײ�����������϶�ߴ�ֲ�������̬�ֲ���ϣ���֪�����������϶�ߴ���̬�ֲ����ߵķ�ֵ����ƫ�ƣ�˵������������ƽ����϶�ߴ�����������������϶�ߴ�ֲ�����һ�¡�
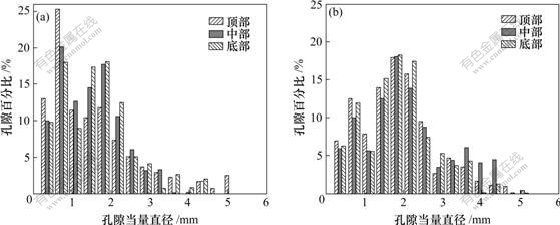
(a) ����ǰ��(b) ������
ͼ7 ����ǰ�����ܽ����ϡ��С���3�����������϶�ߴ�Ƚ�
Fig.7 Comparisons of longitudinal pore size at top, middle and bottom zone before and after leaching
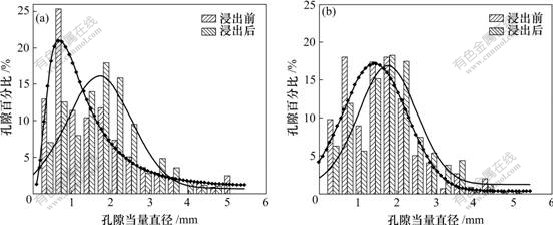
(a) �ܽ���������(b) �ܽ����ײ�
ͼ8 ����ǰ�����ܽ��������͵ײ������϶�ߴ�Ƚ�
Fig.8 Comparisons of longitudinal pore size at top and bottom zone before and after leaching
2.3 ��϶�ߴ��ݻ����������Ե�Ӱ��
�����Ϸ�����֪������ɢ�������ϸ������ǰ����Ŀ�϶�ߴ�ֲ������ȣ���������̬�ֲ����ڱ�ʵ��ļ��������£���϶����ֱ���ֲ���ΧΪ0~6 mm�����еȿ�϶�ߴ�Ŀ�϶�����Ӷ࣬ͬʱ��������һ�������Ĵ��϶���ڽ��������У���϶�ṹ���Ϸ����ݻ�����϶�ߴ�Ҳ�����仯������ͼ5��ͼ8�������������ǰ��Ϊ���Ե�һ��������С��϶������С��ƽ����϶�ߴ�����ϸ���ѽ����̿�϶�ߴ緢���仯��Ҫ�����¼������ص�Ӱ�죺
a. ����ɢ�������ˮ�������������£����巢�����κͳ�����
b. ϸ���������̰��潺״�������������
c. ϸ���ڿ������������ۼ����γ�һ����ȵ�����Ĥ��
d. ��ʼ������ϸ�������ܽ�Һ�������ơ�
��������϶��Ҫ�ܵ�1�����ص�Ӱ�죬С��϶����Ҫ�ܺ���3�����ص�Ӱ�죬���У�ϸ�����������ǶԿ�϶�ߴ�Ӱ���������ء���ϸ�������Ƶ�ijһ���沢��С��϶���ض�������������С��϶������䣬��ʱ��С��϶��������С��ͬʱ���е������ʹ������Ŀ�϶�������ӣ������Ľ�����ǿ�϶ƽ��ֱ������ƽ����϶�ߴ����ӣ�����˵������Ч��һ���ͺã���Ϊ����Ч��ͬʱ���ܿ�϶�ʵ����ص�Ӱ �죬��ײ�����������϶�ʼ�С����ͬʱƽ����϶�ߴ�ܴ�˵������һ�������ߴ�ϴ�Ŀ�϶������ǿ���ѵ������������ԣ��γ������������ӽ���ä�������ս��ͽ���Ч����
3 �� ��
a. �ڶѽ������У�����ɢ����ʿ������϶�ߴ粻�Ϸ����仯�����CT������ͼ���������ʵ�ֶԿ�϶�ߴ�ռ�ֲ��Ķ���������
b. ����ǰ�������ɢ����ʸ������϶�ߴ�ֲ������ȣ��ֲ���Χ�㣬��������̬�ֲ����ɡ�
c. ��������ɢ�����ƽ����϶�ߴ����������϶�������ӣ������γ������������ӽ���ä�������ͽ���Ч����
d. ����ɢ����ʿ�϶�ߴ�仯����������ѧ������ȶ������ص�Ӱ�죬����ϸ������������Ӱ���϶�ߴ�ֲ��������ء�
�ο����ף�
[1] Guyon E. Disorders in granular matter[J]. Physica A, 2005, 357(1): 150-158.
[2] Pradhan N, Nathsarma K C, Rao K S, et al. Heap bioleaching of chalcopyrite: A review[J]. Minerals Engineering, 2008, 21(5): 355-365.
[3] Leahy M J, Davidson M R, Schwarz M P. A model for heap bioleaching of chalcocite with heat balance: Bacterial temperature dependence[J]. Minerals Engineering, 2005, 18(13): 1239-1252.
[4] Mousavi S M, Jafari A, Yaghmaei S, et al. Computer simulation of fluid motion in a porous bed using a volume of fluid method: Application in heap leaching[J]. Minerals Engineering, 2006, 19(10): 1077-1083.
[5] Bartlett R W. Solution mining: Leaching and fluid recovery of materials[M]. New York: Gordon and Breach Science Press, 1998: 33-34.
[6] Al-Raoush R I, Willson C S. Extraction of physically realistic pore network properties from three-dimensional synchrotron X-ray microtomography images of unconsolidated porous media systems[J]. Journal of Hydrology, 2005, 300(1/4): 44-64.
[7] Hirono T, Takahashi M, Nakashima S. In situ visualization of fluid flow image within deformed rock by X-ray CT[J]. Engineering Geology, 2003, 70(1/2): 37-46.
[8] Ketcham R A, Carlson W D. Acquisition, optimization and interpretation of X-ray computed tomographic imagery: Applications to the geosciences[J]. Computers & Geosciences, 2001, 27(4): 381-400.
[9] Monga O, Ngom F N, Delerue J F. Representing geometric structures in 3D tomography soil images: Application to pore-space modeling[J]. Computers & Geosciences, 2007, 33(9): 1140-1161.
[10] Appoloni C R, Fernandes C P, Rodrigues C R O. X-ray microtomography study of a sandstone reservoir rock[J]. Nuclear Instruments and Methods in Physics Research Section A: Accelerators, Spectrometers, Detectors and Associated Equipment, 2007, 580(1): 629-632.
[11] Goldstein L, Prasher S O, Ghoshal S. Three-dimensional visualization and quantification of non-aqueous phase liquid volumes in natural porous media using a medical X-ray computed tomography scanner[J]. Journal of Contaminant Hydrology,2007, 93(1/4): 96-110.
[12] Lin C L, Miller J D, Garcia C. Saturated flow characteristics in column leaching as described by LB simulation [J]. Minerals Engineering, 2005, 18(10): 1045-1051.
[13] Miller J D, Lin C L, Garcia C, et al. Ultimate recovery in heap leaching operations as established from mineral exposure analysis by X-ray microtomography[J]. Mineral Processing, 2003, 72(1/4): 331-340.
[14] WU Ai-xiang, YANG Bao-hua, XI Yong. Pore structure of ore granular media by computerized tomography image processing[J]. Journal of Central South University of Technology, 2007, 14(2): 220-224.
[15] ���, �Ⱞ��, ������, ��. �ѽ��п���ɢ����ʿ�϶�ṹ��ά���ӻ�[J]. ��ұ����, 2008, 28(2): 6-9.
YANG Bao-hua, WU Ai-xiang, WANG Yi-ming, et al. Three dimensional visualization of pore structure of ore granular media for heap leaching[J]. Mining and Metallurgical Engineering, 2008, 28(2): 6-9.
�ո����ڣ�2008-11-15�������ڣ�2009-02-06
������Ŀ��������Ȼ��ѧ����������Ŀ(50774011)�����ҽ�������ʿ�����������Ŀ(20070008038)
ͨ�����ߣ����(1977-)��Ů�����������ˣ���ʿ�о�������ʦ������ͼ���������ӻ��������ܽ��ɿ��е�Ӧ���о����绰��13975196862��E-mail: yangbaohuar2004@126.com
