
Trans. Nonferrous Met. Soc. China 20(2010) s906-s910

Rheological behavior, microstructure and hardness of A356 aluminum alloy in semisolid state using backward extrusion process
S. A. SADOUGH1,2, M. R. RAHMANI1,2, V. POUYAFAR1,2
1. Center of Excellence in Termoelasticity, Amir Kabir University of Technology, Tehran, Iran;
2. Department of Mechanical Engineering, Islamic Azad University Science and Research Branch, Tehran, Iran
Received 13 May 2010; accepted 25 June 2010
Abstract:
The influence of temperature on the flow behavior and rheological characteristics of an A356 alloy in the semi-solid state was investigated using backward extrusion process. Experiments were performed at 5 temperatures and 4 different wall thicknesses. Viscosities were determined using the force-displacement graphs obtained form back extrusion tests. As observed experimentally, at a constant temperature, the increase of shear rate results in the decrease of alloy viscosity exponentially. Raising the temperature increases the liquid fraction hence reduces the semi-solid alloy viscosity. Metallographic and image analyses show that, because of low forming speed, liquid has time to escape from solid phase forward the sample wall. This condition is the main reason for the segregation phenomenon seen in the base and walls. Vickers hardness test on samples reveals that the hardness increases with the decrease of temperature and wall thickness.
Key words:
aluminum alloy A356; backward extrusion; semisolid forming; rheology;
1 Introduction
About 40 years ago, SPENCER et al[1] noticed that stirring a metallic alloy in the semi-solid state (SSS) produced non-dendritic microstructures with alluring rheological properties. The technological potential of this phenomenon was quickly recognized. Semi-solid forming (SSF) processes, also called thixoforming, gained a broad applications in the aerospace, transport, military and automotive industry[2]. Appropriate viscosity values depend on the establishment of a specific microstructure, typically non-dendritic, which is a precondition for the success of all semi-solid processing technologies. Perfectly, this microstructure should be composed of equiaxed particles of the primary phase ��(Al) well insulated by a layer of eutectic liquid. These features can be obtained by a number of methods, such as: 1) mechanical or electromagnetic stirring in the liquid state[3]; 2) thermo-mechanical treatments consisting of plastic deformation followed by heating up to a chosen semi-solid temperature[4]; 3) cooling slope[5]. Along the way to industrialization, it is necessary to obtain the alloy behavior in all processing conditions. Rheological behavior in semi-solid state, and the impact of raw material characteristics and different parameters of forming process have to be carefully investigated.
Rheological investigations are carried out mainly by rotational viscometry[6-7] and simple compression between parallel plates[8-9] and back extrusion tests[10-11]. Each method has its advantages and disadvantages. In this study, back extrusion method was chosen to investigate the temperature effects on rheological behavior of aluminum A356 samples. The influence of temperature on the microstructure and hardness of samples was also investigated.
2 Experimental
2.1 Apparatus and reagents
The reference material was an A356 alloy. There was not any information about the thermal and mechanical history of the material; however, that was not necessary either; because aluminum ingots were remelted before casting by cooling slope. Solidification and melting temperature of this alloy are 555 ��C and 618 ��C, respectively. In this study, cooling slope treatment was employed in order to obtain a non-dendritic microstructure. The cooling slope parameters chosen in this study were pouring length of 30 cm, slope angle of 60�� and pouring temperature of 640 ��C. Aluminum melt was poured in a mould with 30 cm in inner diameter, 250 cm in height and 3 mm in wall thickness. The material of the mould was hot work tool steel H13. After casting, samples were machined to 20 mm in diameter and 20 mm in length. Backward extrusion tests were done in 5 different temperatures: 570, 575, 580, 585 and 590 ��C using 4 different punch diameters: 16, 17, 18 and 19 mm, which produced 2.0, 1.5, 1.0 and 0.5 mm wall thicknesses, respectively. The corresponding solid fractions for 5 temperatures were 60%, 56%, 51%, 47% and 44%, respectively.
2.2 Reology measurement
The flow behavior of metallic alloys in the semi solid state can be obtained by rheological data, such as the degree of thixotropy and pseudo plasticity, the stress�Cstrain curve characteristics and viscosity. In this study, rheology measurements were carried out by back- ward extrusion. Forming condition was isothermal. In order to maintain constant temperatures, the forming process was conducted in a resistance furnace. K-type thermocouples were used to measure the temperatures of mold set and samples. Before each test, samples and mold were reheated for 15 min at desired temperature. Holding time at semi-solid temperatures accounts for the spheroidation of solid fraction in the samples microstructure. After semi-solid holding completion, the samples were back extruded at a constant ram speed. Ram speed of 100 mm/s was applied in all of the experiments. Figs.1 and 2 demonstrate typical diagram of extrusion force vs ram displacement and schematic diagram of the back extrusion apparatus, respectively.
The apparent viscosity of semi solid alloy can be calculated from force-displacement diagram that is obtained from back extrusion experiments. In this technique, the apparent viscosity (��app) is obtained from the following equation, developed by LOUE et al[12]:
![]() (1)
(1)
where Rc and Rp are the cup and plunger radii, respectively; vp is the plunger velocity and C1 is a parameter which depends on both the system geometry and the alloy physical constants. Therefore, the experimental variable is df/dx, that is the slope of the linear part of force versus displacement curve. The mean shear rate in the gap between the cup and the plunger can be calculated using:
 (2)
(2)
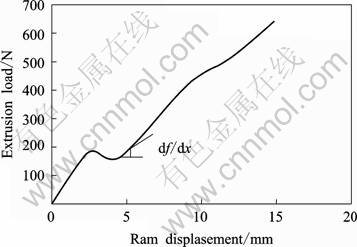
Fig.1 Typical diagram of force vs displacement curve
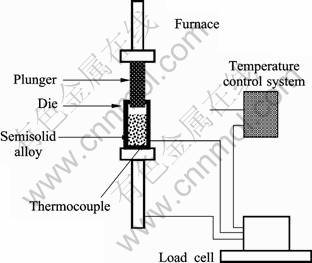
Fig.2 Schematic diagram of back-extrusion equipments
Figs.3(a) and (b) display the primary billets and an extruded cup at 580 ��C with 2 mm in wall thickness, respectively. Table 1 summarizes the calculated apparent viscosity of the Sn-Pb samples at different shear rates. It should be noted that the experiment was designed to compare the apparent viscosity for each wall thickness at equivalent shear rate.
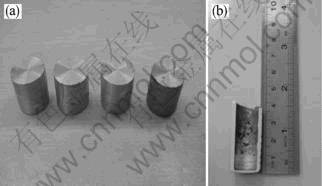
Fig.3 Primary billets (a) and extruded cup at 580 ��C with 2 mm in wall thickness (b)
2.3 Microstructure investigation and hardness tests
In order to investigate the impact of temperature on microstructure, image analysis has been done on samples. For this purpose, three different regions of samples were chosen to be photographed with an optical microscope (Fig.4). Solid-liquid fraction, microstructure and segregation between liquid and solid phase were investigated in these three different zones of the samples. In order to obtain mechanical properties of the samples, standard tension tests could not be performed because of the geometry and the length of the samples. Therefore, Vickers hardness tests were performed on the samples instead. For this purpose, external surface of the walls were polished along the longitudinal axes of the parts and the hardness tests were performed on them.
Table 1 Calculated shear rate and apparent viscosity from slope of linear portion of extrusion force vs extrusion distance curves
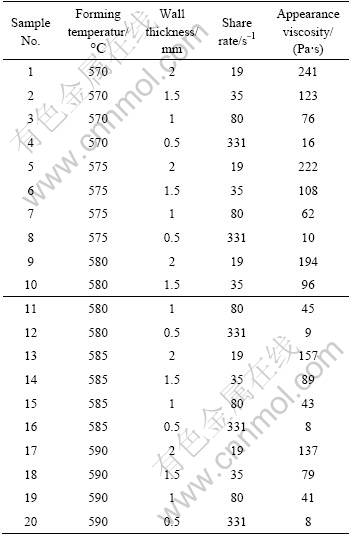
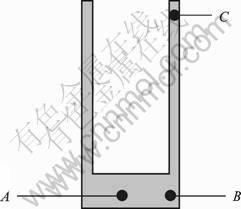
Fig.4 Selected points for metallography
3 Results and discussion
3.1 Rheology
The calculated rheology and shear rate from Eqs.(1) and (2) are shown in Fig.5 and Table 2. It can be seen that at a constant temperature, increasing the shear rate reduces the alloy viscosity exponentially. This kind of rheological behavior is seen in a semi-solid paste that is known as shear thining behavior. This phenomenon is also observable in a semi-solid microstructure. As it is mentioned in the literature, the microstructure of semi-solid alloys is composed of spherical particles which are distributed in a liquid matrix. While for the rest, spherical particles in the microstructure are connected together by solid bands. When the semi-solid alloy is sheared, as a result of breakage of these bands, the spherical particles can slip on each other freely, which causes a sudden decrease of viscosity in the initial seconds of shearing. Liquid matrix acts as a lubricant material and helps for the slippage of solid particles. In a constant shear rate, when the time reaches extreme values, the alloy viscosity will converge to a constant value. In this condition, interaction between spherical solid particles and combination of agglomeration and disagglomeration processes will arrive to an equivalent phase. So, it is clear that the increase of shear rate increases the number of broken bands between spherical particles and decreases the alloy viscosity. This is the behavior that is seen in Fig.5. This diagram expresses the pseudoplastic behavior of the semi-solid alloy in the shearing range.
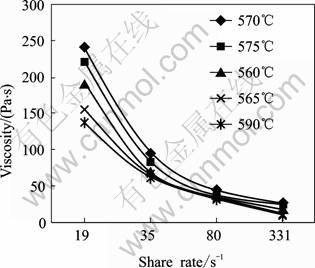
Fig.5 Apparent viscosity vs shear rate curves at different temperatures
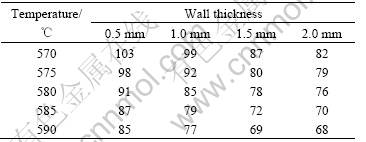
Table 2 Vikers hardness test results
3.2 Microstructure and mechanical properties
The initial microstructure of the alloy prepared by the cooling slope is shown in Fig.6. As shown in Fig.4, the formed samples were divided into three regions: wall, base and corner. Because of low forming speeds, liquid fraction segregated partially from solid phase and moved toward the walls. It was found that in region A, which is the base under the plunger head, almost all of the liquid phase escaped, and just a little fraction remained in the microstructure (Fig.7(a)). This causes an error in the measurement of semi-solid viscosity. Because of this nonhomogenous flow during the forming process, different viscosities can be obtained from different parts of force-displacement curve which in turn, can be related to different solid-liquid fractions. In order to solve this problem, we tried to use the very first portion of the curves to assume that the segregation has not yet occurred. This part of the curve usually appears linear in the obtained force-displacement diagrams. Referring to the microstructural observations of the samples, it was shown that increasing the temperature from 570 ��C to 590 ��C, significant decrease in liquid fraction happened in region A. Because of less solid fraction in region C, increasing the temperature did not have any significant impact in this region but raised the length of it (because of the limited force of the press we used, 3.5 t). Temperature increase also caused the decrease of the base thickness samples. The reason is that, the increase of temperature decreases the viscosity, thus enhances the easy flow of semi-solid material from base toward walls. Another phenomenon observed in this study was the presence of more solid fraction in the central part of sample wall (Fig.7(c)). In other words, the combination of horizontal and vertical segregation of solid-liquid phase was observed in the sample wall. High pressure of the material in the central part of the wall and also low forming speeds could be reasons for such a phenomenon.
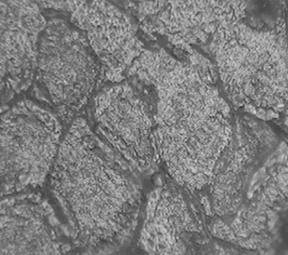
Fig.6 Initial microstructure of alloy prepared by cooling slope
In such a condition, liquid phase had enough time to escape towards the low pressure regions, i.e. wall surfaces, and thus formed a thin high liquid fraction region.
Fig.8 shows the sample hardness vs temperature change for different plunger diameters. According to this diagram, the hardness is increased with the decrease of temperature and wall thickness. The change of sample hardness caused by the changes of temperature and plunger diameter could be related to the liquid segregation and possibility of defect creation and porosity in the samples. It is obvious that solidified liquid which contains more silicon than the primary solid is harder than the solid. As mentioned previously, the decrease of the wall thickness increased the segregation in the parts, i.e. more liquid fraction escaped to the walls. So, the presence of more liquid fraction in the walls and hence more silicon particles, is a good reason for the increase of hardness.
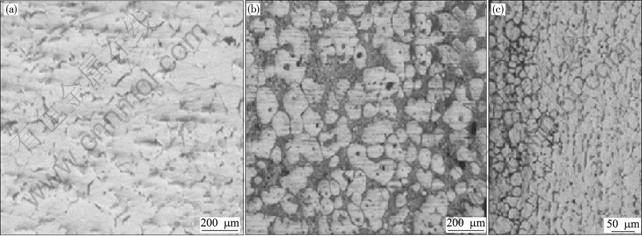
Fig.7 Metallographs of sample formed at 575 ��C and plunger diameter of 16 mm: (a) Sample base; (b) Sample wall; (c) Horizontal segregation in wall
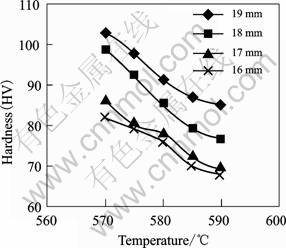
Fig.8 Hardness vs temperature for different wall thickness
The decrease of the hardness with the increase of temperature can be related to the porosities that are present in the parts. It is clear that at high temperatures the flow of the material has more turbulental characteristics and this kind of flow potentially produces more defects in the parts. This can be a reason for the hardness reduction.
4 Conclusions
1) At a constant temperature, the increase of shear rate results in the decrease of alloy viscosity exponentially.
2) Raising the temperature increases the liquid fraction, thus resulting in semi-solid alloy viscosity reduction.
3) Because of low forming speeds, liquid fraction has time to escape from liquid phase to sample wall and thus causes the segregation between base and wall, along with horizontal segregation in the walls.
4) Vickers hardness test on samples reveals that the hardness is increased with the decrease of temperature and wall thickness.
Acknowledgements
Appreciation is extended to Mr. Michel Su��ry for the editorial work.
References
[1] SPENCER D B, MEHRABIAN R, FLEMINGS M C. Rheological behiour of Sn-15 pct Pb in the crystallization range [J]. Metall Trans, 1972, 3: 1925-1932.
[2] GARAR M, MAENNER L, SZURT C. State of the art of thixocasting [C]// Processing of Alloys and Composites. Torino, Italy, 2000: 187-194.
[3] KIRKWOOD D H. Semisolid metal processing [J]. Int Mater Rev, 1994, 39: 173-189.
[4] GRIMMIG T, FEHLBIER M, KLAASSEN O, B?HRIG-POLACZEK A, SAHM P R. Approaches to the production of semi-solid aluminium in the rheocasting process [C]// TSUTSUI Y, KIUCHI M, ICHIKAWA K. Proceedings of the 7th International Conference on Advanced Semi-Solid Processing of Alloys and Composites. Tsukuba, 2002: 789-794.
[5] Japan National Institute of Advanced Industrial Science and Technology and the Japan Society for Technology of Plasticity, 2002: 145-150.
[6] JOLY P A, MEHRABIAN R. Rhelogy of a partially solid alloy [J]. J Mater Sci, 1979, 11: 1393-1418.
[7] MOON H K. Rheological behavior and microstructure of ceramic particulate/aluminum alloy composites [D]. MIT, Cambridge, MA, 1990.
[8] YEE E C [D]. Singapore, Nanyang University of Technology, 1999.
[9] MODIGELL M. KOKE J. Rheological modeling on semi-solid metal alloys and simulation of thixocasting processes [J]. J Mater Process Technol, 2001, 111(1/2/3): 53-58.
[10] MARTIN C L, BROWN S B, FAVIER D, SUERY M. Shear deformation of high solid fraction (>0.60) semi-solid Sn-Pb under various structures [J]. Mater Sci Eng A, 1995 202(1/2): 112-122.
[11] de FREITAS E, FERRACINI E Jr, FERRRANTE M. Microstructure and rheology of an AA2024 aluminium alloy in the semi-solid state, and mechanical properties of a back-extruded part [J]. J Materials Processing Technology, 2004: 146: 241-249.
[12] LOUE W R, SUERY M, QYERBES J L. [C]//. BROWN S B, FLEMINGS M C. Prof 2nd Int Conf on the Semi-Solid Processing of Alloys and Composites. TMS, Warrendale, PA,1992: 266-275.
(Edited by YANG Bing)
Corresponding author: M. R. RAHMANI; Tel: +98-936-1544065; E-mail: rahmani_m_r@yahoo.com
