
Trans. Nonferrous Met. Soc. China 30(2020) 2119-2131
Effect of Sn on synthesis of nanocrystalline Ti-based alloy with fcc structure
C. AGUILAR1, E. PIO1, A. MEDINA2, C. PARRA1, R. MANGALARAJA3, P. MARTIN1, I. ALFONSO4, K. TELLO1
1. Departamento de Ingenieria Metalurgica y de Materiales, Departamento de Fisica (+) Universidad Tecnica Federico Santa Maria, Valparaiso, Chile;
2. Instituto de Investigacion en Metalurgia y Materiales, Universidad Michoacana de San Nicolas de Hidalgo, Morelia, Mexico;
3. Laboratorio de Ceramicos Avanzados y Nanotecnologia, Departamento de Ingenieria de Materiales, Universidad de Concepcion, Concepcion, Chile;
4. Instituto de Investigaciones en Materiales, Universidad Nacional Autonoma de Mexico, Campus Morelia UNAM, Morelia, Mexico
Received 22 October 2019; accepted 31 July 2020
Abstract:
The effect of the amount of Sn on the formation of fcc phase in Ti-13Ta-xSn (x=3, 6, 9 and 12, at.%) alloys was studied. The alloys were synthesized by mechanical alloying using a planetary mill, jar and balls of stabilized yttrium. Using Rietveld refinement, it was found that the obtained fcc phase has crystallite size smaller than 10 nm and microstrain larger than 10-3. Both conditions are required to form an fcc phase in Ti-based alloys. For all samples, the microstructure of the fcc phase consists of equiaxial crystallites with sizes smaller than 10 nm. The largest presence of fcc phase in the studied Ti alloy was found with 6 at.% Sn, because this alloy exhibits the largest microstrain (1.5��10-2) and crystallite size of 6.5 nm. Experimental data reveal that a solid solution and an amorphous phase were formed during milling. The necessary conditions to promote the formation of solid solution and amorphous phases were determined using thermodynamic calculations. When the amount of Sn increases, the energy required to form an amorphous phase varies from approximately 10 to approximately -5 kJ/mol for 3 and 12 at.% Sn, respectively. The thermodynamic calculations are in agreement with XRD patterns analysis and HRTEM results.
Key words:
Ti-based alloy; phase transformation; fcc phase; Rietveld analysis; mechanical alloying;
1 Introduction
Titanium and its alloys are widely used in engineering applications such as aerospace, biomedical, chemical and nuclear industries due to their high specific strength, excellent corrosion resistance [1] and significant biological impact on the human body [2]. Especially in the aerospace field, Boeing and Airbus companies forecasted that the use of Ti alloys per plane would increase in the next year due to their high resistance to creep and oxidation, good formability and good strength/ density ratio [3]. On the other hand, in the biomedical area, it is estimated that 90% of the population over 40 years old suffers degenerative diseases such as the ones associated with the degradation of mechanical properties of the bone [4]. The hip endoprosthesis is one of the most demanded surgeries and the femoral stem design of the hip implant is very important to avoid the loosening of the implant [5]. Therefore, the demand of Ti-based alloys for biomedical application will also increase in the near future.
Pure Ti and a great number of its alloys exhibit an allotropy change at the ��-transus temperature. Below the ��-transus temperature, Ti exhibits a hexagonal close packed (hcp) crystalline structure (called ��-phase), and above this temperature, it possesses a body centered cubic (bcc) crystalline structure (called ��-phase). ��-transus temperature for pure Ti is (882��2) ��C. The great variety of properties that Ti alloys show are related to this allotropic phase transformation, which is very important for engineering applications. In general, Ti alloys are classified as ��-phase, (��+��)-phase and ��-phase depending upon their microstructure [6]. The �� and �� phases can be stabilized using alloying elements, and depending on their influence on the ��-transus temperature, they are considered as neutral (Sn, Zr [6]), ��-stabilizers (Al, O, N, C [6]) and b stabilizers (Ta, Nb, Z, W, V, Mo, Fe, Mn, Cr, Co, Ni, Cu, Si, H [6,7]). Properties of the ��-phase, (��+��)-phase and ��-phase alloys are different: (1) the ��-phase alloys exhibit high elastic modulus, good creep resistance, good weldability and excellent corrosion resistance; (2) (��+��)-phase alloys have good strength, good corrosion resistance and moderate fracture toughness and weldability, and in addition, their properties depend on the relative proportion of the �� and �� phases present in the microstructure; (3) ��-phase alloys exhibit high strength and fatigue resistance, low elastic modulus, good formability, high hardenability and high corrosion resistance [6,8]. Ti alloys with fcc phase have been reported in thin film [9], multilayer films [10], explosive cladding [11] and milled powders [12]. YU et al [9] studied the in-situ formation of the fcc-Ti phase at elevated temperatures. They used transmission electron microscopy to carry out in-situ heating and deformation of Ti-0.1wt.%O foils and found that hcp-fcc transformation occurs at temperatures around 600 ��C. They also observed that the fcc-Ti phase is stable at ambient temperature and displays considerable dislocation-based plasticity under nano compression tests. PRASANTHI et al [11] studied the formation of fcc-Ti phase in the ��+�� Ti-5Ta-2Nb alloy obtained by shock loading in an explosive clad. By means of TEM, they found that the fcc phase had a needle-shaped morphology and presented an orientation relationship given by  and
and  between fcc and hcp phases. Also, the fcc Ti phase has been obtained in pure Ti and Ti alloy powders fabricated via high energy milling [12-15]. A common characteristic of all processes where the fcc-Ti phase has been obtained is the presence of both high deformation and grain refinement. There are a few theoretical investigations about the formation of fcc-Ti phase in the literature. AGUAYO et al [16], using ab-initio calculations, studied the structural stability and electronic structure of the fcc-Ti phase. The results showed that the fcc-Ti phase is locally stable because the elastic stability criterion for a cubic crystal is fulfilled by the calculated elastic constants. On the other hand, XIONG et al [17] studied the effects of size and temperature on the transformation of Ti from hcp to fcc phase. They determined the Gibbs free energies of nanoparticles, nanowires and nanofilms of Ti where fcc phase is stable for size smaller than 27, 19 and 9 nm, respectively, at around 777 K.
Mechano-chemical processing (MCP) is used as powder metallurgical process to obtain specific chemical reactions or phase transformations which involves the transformation of mechanical energy into chemical energy. MCP includes the mechanical alloying (MA) process which is a simple and versatile process that transfers high amounts of energy from milling balls to the powders during the milling process [18]. MA is a dry, solid-state powder processing technique (a liquid medium can also be used sometimes during milling operations) which involves repeated welding, fracturing and re-welding of powder particles in a high-energy ball mill [18]. During MA, intense deformation is introduced into the particles, which is manifested by the increase of crystalline defects, such as dislocations and stacking faults and, a large area of crystallite boundaries. When crystalline defects increase in the material, the Gibbs free energy curves move upwards promoting chemical reactions and/or formation of new phases. MANNA et al [14] observed the hcp to fcc phase transformation in high-energy milling of pure Ti in a planetary mill. They suggested that structural instability is due to negative (from core to boundary) hydrostatic pressure arising out of nanocrystallization or grain refinement. The lattice expansion and plastic strain is responsible for the phase transformation from hcp to fcc. BOLOKANG et al [13] reported that the fcc-Ti phase was observed in unmilled and milled (30 h) powders when quenched in water from 1200 ��C. They concluded that the fcc-Ti phase was stress-induced during quenching. ZHANG and YING [12] observed the fcc phase in Ti-25at.%Al and Al-25at.%Ti alloys milled for 4 and 8 h followed by heating in the temperature range of 350-550 ��C. They concluded that the hcp to fcc phase transformation occurs only in thin layers of Ti with nanometer thickness embedded in aluminum. In this case, the transformation was thermally induced by the energy transferred during the milling process. CHATTERJEE and SEN GUPTA [15], using Rietveld method, measured the volume fraction of the fcc-Ti phase of ~24% with a crystallite size of ~2 nm in Ti powders milled at 10 h. In addition, they reported a lattice parameter of the fcc-Ti phase of a=0.4216 nm.
In light of these findings, the formation of fcc phase in Ti-Ta-Sn alloy as a function of Sn content was studied. The alloys were obtained by mechanical alloying in a planetary mill using 100 h of milling (this time was used after previous studies of the research group). In addition, theoretical thermodynamic models were used to describe and explain the formation of solid solution and amorphous phases during the milling operation.
2 Experimental
Ti powders of Grade IV (<149 ��m, Noah Company), Ta powders (99.9% in purity, <45 ��m, Aldrich Company) and Sn powders (99.8% in purity, <149 ��m, Aldrich Company) were used to prepare powder blends of Ti-13Ta-xSn (x=3, 6, 9 and 12, at.%). The mixture was placed in a 250 mL yttrium stabilized jar and milled in an argon atmosphere (ultra-pure, 99.999% with O2 content <2��10-6, N2 content <5��10-6 and other elements <3.5��10-6) using a Retsch PM400 planetary mill. 2 wt.% of stearic acid was used to prevent cold welding. The powders were milled for 100 h using different diameters of agate balls (10 and 5 mm) with a constant ball/powder ratio of 10:1. To cool down the vials and maintain a stable temperature of the process, an on/off cycle of 30 and 30 min, respectively, was used. X-ray diffraction (XRD) patterns of samples were collected using a multi- purpose powder diffractometer STOE STADI MP equipped with a DECTRIS MYTHEN 1K detector using pure Cu K�� radiation (��=1.54056  , curved germanium(111) monochromator of the Johann- type). The samples were measured in transmission mode using a step of 0.012�� and a stepwise dwelling time of 10 s in an angular range of 2��=20��-120��. The microstructural information was obtained from Rietveld refinement of X-ray powder diffraction patterns using the software Materials Analysis Using Diffraction (MAUD) [19,20] and LaB6 (a=4.1565915(1) ) as external standard for determining instrumental broadening [21]. The morphology and chemical composition of the raw and milled powders were characterized using a Carl Zeiss scanning electron microscope (SEM) model EVO-MA 10 equipped with an Oxford Instruments energy dispersive X-ray spectrometer (EDXS). High-resolution transmission electron microscopy (HRTEM) analyses were performed using a FE-TEM Tecnai F20 at 200 kV. The samples for HRTEM observation were prepared by suspending the powders in isopropyl alcohol and placing a drop of this suspension on a Cu grid. The Gatan Digital Micrograph software was used to analyze the HRTEM images. Thermodynamics calculations of formation of solid solutions and amorphous phases were performed applying the Miedema model [22].
3 Results and discussion
3.1 Characterization by SEM
Figure 1 shows the Ti-Ta-Sn powder particles after 100 h of milling for different amounts of Sn. The particle size and morphology change with the amount of Sn due to the competition between cold welding and fracture of the particles. The cold welding and fracture processes can be predominant at any stage and depend mostly on the deformation characteristic of the starting powders and their kinetics [23]. For 3 at.% Sn, the particles exhibit a sharp edge with a size smaller than 5 ��m. The particle shape indicates that the fracture process is more relevant than the cold welding. For 6 at.% Sn, the particles are smaller than 1 ��m; whereas for 9 at.% Sn, the particles present an equiaxial shape and size above 5 ��m and below 0.5 ��m. With 12 at.% Sn, the particle size is 1-3 ��m with a particle morphology near to sharp edge. The observed particle morphology variations with the amount of Sn mean that the surface tension of the powders was modified by different amounts of Sn added. Powders containing 9 at.% Sn reached a high surface tension value which led to larger agglomerated particles (small particles over large particles). Powders containing 3, 6 and 12 at.% Sn presented less surface tension because the agglomerated particles were not observed. With long milling time, the powder particles get work-hardened, which increases their hardness and brittleness; whereas the particle size keeps decreasing when the fracture strength of the particles is equal or smaller than the stress caused by the collision [23]. Particles with an equiaxial shape showed the predominance of cold welding over fracture process. At higher magnification particles smaller than 100 nm were observed.

Fig. 1 SEM images of milled powders with different amounts of Sn
Figure 2 shows the EDS-mapping analysis for all the alloys. This analysis revealed contamination of Zr, Y and O (the Y mapping is not shown but it exhibits the same behavior of Zr). The Zr and Y contamination can be attributed to the vials and balls used during the milling stage; whereas oxygen contamination could come from two sources: (1) the decomposition of stearic acid which introduces oxygen and (2) from the Ar atmosphere which contains traces of O. In addition, EDS confirmed that Ti, Ta and Sn homogeneously distributed in all the Ti-Ta-Sn alloys. Also, the EDS-mapping analysis showed that the presence of nitrogen was extremely low, smaller than 0.01 at.% for all alloys.
3.2 X-ray diffraction patterns analysis
Figure 3 shows the XRD patterns of the powders milled for 100 h as a function of the amount of Sn. The XRD patterns of the milled powders exhibited peak broadening, peak shift and disappearance of peaks of the solute due to the severe plastic deformation produced during mechanical alloying. The ��-Ti phase was not observed within the range of Sn amount used, which shows the strong stabilization effect of Ta on the �� phase [7]. The ��-Ti phase and Ta have the same crystal structure and space group  with a slight difference in lattice parameter, which led to the observed X-ray reflections very close in 2�� values. The reflections of the pure elements are not observed on the XRD patterns of the milled powders, indicating that they have entered into solid solutions [18] either to the ��-Ti or to fcc-Ti phases. The ��-Ti phase is cubic with crystal structure
  (bcc phase) and the fcc-Ti phase is cubic with crystal structure
  (fcc phase). A mixture of phases, bcc and fcc phase and Y2O3ZrO2 (YZrO) compound are observed in the alloy containing 3, 9 and 12 at.% Sn. The presence of the YZrO compound indicates that contamination occurred during the milling process and it comes from the jar and balls used during milling, which is in agreement with the EDS analysis (Fig. 2). This contamination was observed for all Sn amounts. The presence of fcc phase is only observed when 6 at.% Sn was added. With 9 at.% Sn, both fcc phase and bcc phase were observed. At low angles (at around 35��), the reflections of (111) from the fcc phase and (110) from the �� phase are very close and, therefore, it is difficult to separate them. Finally, the alloy with 12 at.% Sn contains three phases: fcc phase, bcc phase and YZrO compound.

Fig. 2 EDS mapping as function of Sn amounts

Fig. 3 X-ray diffraction patterns of Ti-13Ta-xSn milled for 100 h as function of amount of Sn
Previous works [24,25] have shown that Ti hydride precipitates can be formed in Ti-based alloys in the presence of high-concentration hydrogen atmosphere. HUANG et al [24] obtained Ti hydrides from Ti-based alloys which were exposed to a hydrogen stream at 650 ��C. They observed leaf- and needle-like Ti hydride structures smaller than 500 nm with lattice parameter of 0.440 nm. TEM and XRD characterization were used to rule out that the observed fcc-Ti phase is connected to the presence of Ti hydride. According to these results, it was found that: (1) Ti hydride precipitates were not observed in TEM images and (2) the X-ray reflection positions of Ti hydride are shifted by ~1.5�� for smaller 2q angles, indicating Ti hydrides were not formed. The presence of Ti nitrides was not observed either. The position of the X-ray diffraction reflections of titanium nitrites does not match with the position of the reflections of the alloys obtained. Analysis of TEM images also showed that no Ti nitrides were formed. The typical stoichiometry of titanium nitrites is TiN, TiN0.9 or TiN0.76, which means that the amount of nitrogen must be similar to that of titanium. An analysis of the possible origin of nitrogen is as follows. (1) The powders used (Ti, Ta and Sn) do not have nitrogen in their composition, (2) the vials were sealed inside a dry box with ultra-pure Ar atmosphere (<5��10-6 of N2), and (3) ultra-pure stearic acid was used as process control agent, and the chemical composition shows no presence of nitrogen.
The microstructural parameters such as lattice parameter, crystallite size and microstrain were obtained from Rietveld refinements of the X-ray powder patterns. The profile fittings were performed by considering pseudo-Voight function, isotropic size-strain model, Delf line broadening model, without planar defects and arbitrary texture. The results of the refinement are summarized in Table 1. The quality of refinements is given by goodness of fit (GofF) and Rwp indicators. A refinement is considered excellent when 1��GofF��2 and Rwp��10%. The results of the refinement showed that the GofF and Rwp values are smaller than 2 and 10%, respectively. The obtained lattice parameters were between 0.42628 to 0.43141 nm, which are in agreement with the range previously reported for pure Ti and Ti-based alloys with fcc-Ti phase, namely 0.4216 nm [15], 0.4237 nm [26], 0.411 nm [16], 0.408 nm [11], 0.4327?0.4351 nm [14], 0.412 nm [9], 0.402 nm [27], 0.442 nm [10], 0.4385 nm [28], 0.4271, 0.422 and 0.410 nm [13], 0.42 nm [29], 0.402?0.440 nm [10], 0.41638 nm [30] and 0.4396 nm [12]. The crystallite size estimated was smaller than 10 nm, which is in agreement with Gibbs free energy calculation of XIONG et al [17]. They showed that fcc phase is stable for nanoparticle sizes smaller than approximately 10 nm at room temperature and sizes around 27 nm up to 883 ��C. The r.m.s. microstrain (<��2>1/2) values are large, indicating the high elastic energy stored in milled powders. The <��2>1/2 values are 10-3-102, the alloy with 6 at.% Sn exhibited higher <��2>1/2 value (1.2��10-2) and the alloy with 12 at.% Sn showed a smaller value (1.6��10-3). AGUILAR et al [31], applying the modified Warren-Averbach and Williamson-Hall methods, reported crystallite size values of 13 and 6.6 nm for 6 and 12 at.% Sn, respectively. This phenomenon could be associated with the high deformation capacity that the fcc structure possesses. In the early stages of MA, the powders experience plastic deformation within shear bands due to the high deformation rates and exhibit large microstrain. When milling proceeds, there is a proportional increase in the microstrain and dislocation density. Finally, a critical dislocation density is reached within these heavily-strained zones, which results in the disintegration of a grain into subgrains that are separated by low angle grain boundaries [32].
Table 1 Microstructural parameters obtained from Rietveld refinements using MAUD software

On the other hand, the bcc-Ti phase shows lattice parameter value of 0.33184-0.33941 nm which are large compared with 0.3306 nm reported in the literature (PDF # 00-044-1288). The lattice parameter changes when solute atoms enter in solid solution, but a clear trend is not observed because the atomic radii of some elements are larger and those of others are smaller when compared with the atomic radius of Ti atoms, i.e. Sn (0.172 nm), Ta (0.209 nm), Ti (0.2 nm), Zr (0.216 nm) and Y (0.229 nm). The crystallite size in the 3 and 9 at.% Sn samples is smaller than 10 nm; whereas in the alloy with 12 at.% Sn the size increases up to around 61 nm. The <��2>1/2 values (around 10-3) show the severe plastic deformation experienced by the powders during milling.
There is no clear trend of microstructural parameters with the amount of Sn because several competitive processes can take place during milling, such as formation of solid solutions with fcc and bcc crystal structure and evolution of the density of crystalline defects. The evolution of the quantity of phases as a function of Sn amount is presented in Fig. 4. The phase quantification was determined by applying Rietveld refinements using the MAUD software [19]. The fcc phase was present in quantities of around 22, 100, 97 and 78 wt.% for 3, 6, 9 and 12 at.% Sn, respectively. The higher amount of fcc phase is obtained in samples with 6 and 9 at.% Sn.
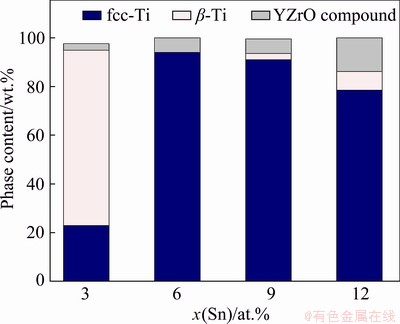
Fig. 4 Quantification of phases using Rietveld method
The bcc phase was found mostly in the sample with 3 at.% Sn and in less amounts in the samples with 9 and 12 at.% Sn. The contamination of YZrO compound was observed in all samples.
3.3 Transmission electron microscopy

Fig. 5 HRTEM images and FFT of Ti-13Ta-xSn alloys
High resolution TEM (HRTEM) images are shown in Fig. 5 as a function of the amount of Sn. The images revealed the presence of mixed zones of nanocrystalline and amorphous zones in the four alloys studied. The content of amorphous phase observed increases with the Sn amount. The XRD patterns suggest the presence of YZrO compound (crystal structure P42/nmc) in all samples. From Fig. 5(a), the alloys with 3 at.% Sn show the fcc, bcc phases and the YZrO compound, and the observed crystallite size in the alloy is ~10 nm. From Fig. 5(c), the crystallite size in the alloy with 6 at.% Sn is ~5 nm (in this case the crystallites correspond to the fcc phase). Figure 5(e) suggests the presence of both bcc and fcc phases in the alloy with 9 at.% Sn with crystallite size smaller than 10 nm. Also, Fig. 5(g) indicates the presence of both fcc and bcc phases with crystallite size much smaller than 5 nm for the alloy with 12 at.% Sn. In addition, the crystallite size of the YZrO compound observed in the alloys with 3 and 12 at.% Sn is 5 nm. Moreover, the ��-Ti phase was not observed for any amount of Sn, which is in agreement with the XRD results. For all the samples, the microstructure consists of equiaxial crystallites with sizes smaller than 10 nm. These nanostructures are generated by the plastic deformation that occurs in shear bands located in unstrained grains. As milling time increases, the grain size (or crystallite size) steadily decreases and the shear bands coalesce. The low angle grain boundaries were replaced by high angle grain boundaries, implying that the grain rotation produces disclinations in the lattice [33]. As milling continues, the nanocrystalline grains reach a saturation value. It is difficult to generate dislocations inside nanocrystalline grains and, in turn, the existing dislocations will be rearranged and few will be eliminated [34]. Figure 6(a) shows HRTEM image of Ti-13Ta-9Sn alloy where both fcc and bcc phases coexist (corresponding FFT image in Fig. 6(b)). Figures 6(c, d) show that there is an orientation relationship between the fcc and bcc phases, given by  //
//  However, intermetallic compounds of equilibrium such as Ti6Sn5, Ti5Sn3, Ti2Sn, Ti3Sn, Ta3Sn and Ta2Sn3 were not observed by HRTEM and XRD.
Finally, the presence of amorphous phase was not observed easily on the XRD patterns but in HRTEM images its presence was corroborated (Fig. 5). This indicates that the milling process transferred enough energy to form this phase.
3.4 Thermodynamics analysis
The Gibbs free energy of mixing (��Gm) for a binary system at a given temperature (T) can be obtained as DGm=DHm-TDSm, where DHm is the enthalpy of mixing and DSm is the entropy of mixing. The DHm term can be computed by the model proposed by NIESSEN et al [35,36], BAKKER et al [37] and WANG et al [38], whereas DSm can be considered as the configurational entropy. DGm and DHm values for ternary systems are calculated from the constituents of binary systems. The asymmetrical models are better than symmetric models because they consider the effect of the differences in properties of the three elements [39]. The properties of ternary systems are determined by applying Toop��s model [39]. NIESSEN��s method [35,36] is a simple method to determine the enthalpy of formation of intermetallic compounds and enthalpy of mixing of solid solutions and amorphous phases [40-42].

Fig. 6 HRTEM image (a) and FFT (b) showing fcc phase and bcc phase particles of Ti-13Ta-9Sn alloy and selected FFT (c) and inverse FFT (d) of magnified zone (white square) in (a)

Fig. 7 Gibbs free energy of mixing (��Gm) to form solid solution (a) and amorphous phase (b) in Ti-Ta-Sn system at 298 K (The white dots show the composition for the alloys studied)
Figure 7(a) shows the Gibbs free energy of mixing required to form a solid solution (DGs)
whereas Fig. 7(b) shows the one required to form an amorphous phase (DGam) in the Ti-Ta-Sn system. Figure 7(a) reveals that the DGs values are negative in the whole range of compositions, indicating that a driving force exists to form a solid solution from elemental powders. This result is in agreement with previously-reported information of the synthesis of binary Ti-Ta [7,43], Ti-Sn [44,45] and Ta-Sn [46] alloys, and �� Ti-Ta-Sn alloy [47]. These thermodynamic calculations do not give complete information about the solid solution having an fcc or bcc crystal structure. The smallest DGs value (about -25 kJ/mol) occurs around the composition of Ti-10Ta-45Sn and the highest DGs value (about -0.5 kJ/mol) is reached at the corners of the ternary diagram. The four compositions studied in this work appear as white dots in these diagrams and it is observed that DGs values decrease from about -1 kJ/mol to about -15 kJ/mol for 3 and 12 at.% Sn, respectively. This result indicates that Sn promotes the formation of a solid solution. On the other hand, Fig. 7(b) shows both positive and negative DGam values depending on the alloy composition. The highest DGam values are close to the Ta corner with a maximum of about 20 kJ/mol and decreases in the opposite direction.
Figure 7(b) shows that the DGam value decreases as the Sn content increases. The DGam varies from approximately 10 to approximately -5 kJ/mol for 3 and 12 at.% Sn, respectively. These results show that the alloys with 9 and 12 at.% Sn have sufficient driving force to form an amorphous phase during milling, although this driving force is smaller compared with the driving force to form a solid solution. These thermodynamic calculations are in line with the HRTEM images and XRD patterns and suggest that the content of amorphous phase increases with Sn content. It is possible to form amorphous phases from elemental powders with positive heat of mixing using MA [48]. During milling, the solid solution and the strain energy increase linearly with the solute content. If the lattice strain increases enough, the Gibb free energy value could exceed a critical value. So, the system has sufficient energy to take phase transformation, from a crystalline phase to an amorphous phase, where the formation of an amorphous phase becomes more favorable than the formation of a crystalline phase. During MA, the powder experiences severe plastic deformation which produces a large density of crystalline defects, increases the grain boundary area, and also promotes a faster diffusion process, leading to the amorphous phase formation [49]. The main requirement for the formation of an amorphous phase is that large difference in atomic radius among the constituent elements should exist which, in turn, introduces large strains into the alloy [50]. The atomic radii of the elements are: Ti (0.200 nm), Ta (0.209 nm) and Sn (0.172 nm), which indicates a difference around of 14% between Sn with Ti and Ta.
4 Conclusions
(1) Microstructural analysis of the fcc phase in Ti-Ta-Sn alloys obtained by MA showed that the necessary conditions to promote the formation of fcc phase were satisfied; crystallite size smaller than 10 nm and <��2>1/2 values higher than 10-3 were obtained with Rietveld refinement.
(2) The Sn amount influences the formation of fcc Ti-based alloy during the milling. With 6 at.% Sn, 100% of fcc phase was achieved, while with 3 at.% Sn, ~23% of fcc phase was identified. Furthermore, the analyses on XRD patterns were well supported by the high resolution TEM images.
(3) No evidence of Ti hydrides formation was found by TEM images and XRD patterns.
(4) The microstructure of Ti-Ta-Sn alloys reveals the presence of crystalline and amorphous phases whose volume fraction varies as a function of Sn amount.
(5) The Rietveld refinement of the XRD patterns reveals the presence of three crystalline phases, namely bcc phase, fcc phase and a YZrO compound (contamination from the mill vials).
(6) Thermodynamic calculations are in agreement with XRD patterns analysis and HRTEM results. Experimental and thermodynamic data showed that solid solution and amorphous phases were formed during milling.
Acknowledgments
The authors would like to acknowledge financial support from FONDECYT Project No. 1190797 and FONDEQUIP/EQM Project No. 140095.
References
[1] RAJABI F, ZAREI HANZAKI A, ABEDI H R, FARGHADANY E. Corrosion behavior of thermo- mechanically processed biomedical Ti-29Nb-13Ta-4.6Zr [J]. Journal of Alloys and Compound, 2017, 725: 23-31.
[2] IBRAHIM M K, HAMZAH E, SAUD S N, NAZIM E M, BAHADOR A. Parameter optimization of microwave sintering porous Ti-23%Nb shape memory alloys for biomedical applications [J]. Transactions of Nonferrous Metals Society of China, 2018, 28: 700-710.
[3] SINGH P, PUNGOTRA H, KALSI N S. On the characteristics of titanium alloys for the aircraft applications [J]. Materials Today: Proceedings, 2017, 4: 8971-8982.
[4] GEETHA M, SINGH A K, ASOKAMANI R, GOGIA A K. Ti based biomaterials, the ultimate choice for orthopaedic implants��A review [J]. Progress Materials Science, 2009, 54: 397-425.
[5] STRASKY J, HARCUBA P, VACLAVOVA K, HORVATH K, LANDA M, SRBA O, JANECEK M. Increasing strength of a biomedical Ti-Nb-Ta-Zr alloy by alloying with Fe, Si and O [J]. Journal of the Mechanical Behavior of Biomedical Materials, 2017, 71: 329-336.
[6] LEYENS C, PETERS M. Titanium and titanium alloys [M]. Weinheim: Wiley-VCH GmbH & Co. KGaA, 2003.
[7] CHINNAPPAN R, PANIGRAHI B K, van de WALLE A. First-principles study of phase equilibrium in Ti-V, Ti-Nb, and Ti-Ta alloys [J]. Calphad, 2016, 54: 125-133.
[8] LU J W, GE P, LI Q, ZHANG W, HUO W T, HU J J, ZHANG Y S, ZHAO Y Q. Effect of microstructure characteristic on mechanical properties and corrosion behavior of new high strength Ti-1300 beta titanium alloy [J]. Journal of Alloys and Compound, 2017, 727: 1126-1135.
[9] YU Q, KACHER J, GAMMER C, TRAYLOR R, SAMANTA A, YANG Z, MINOR A M. In situ TEM observation of FCC Ti formation at elevated temperatures [J]. Scripta Materialia, 2017, 140: 9-12.
[10] van HEERDEN D, JOSELL D, SHECTHMAN D. The Formation of fcc titanium in multilayers [J]. Acta Metallurgica, 1996, 44: 297-306.
[11] PRASANTHI T N, SUDHA C, RAVIKIRANA, SAROJA S. Formation and reversion of metastable fcc phase in a Ti-5Ta-2Nb explosive clad [J]. Materials Characterization, 2016, 116: 24-32.
[12] ZHANG D L, YING D Y. Formation of fcc titanium during heating high-energy, ball-milled Al-Ti powders [J]. Materials Letters, 2001, 50: 149-153.
[13] BOLOKANG A S, PHASHA M J, MOTAUNG D E, CUMMINGS F R, MULLER T F G, ARENDSE C J. Microstructure and phase transformation on milled and unmilled Ti induced by water quenching [J]. Materials Letters, 2014, 132: 157-161.
[14] MANNA I, CHATTOPADHYAY P P, NANDI P, BANHART F, FECHT H J. Formation of face-centered-cubic titanium by mechanical attrition [J]. Journal of Applied Physics, 2003, 93: 1520-1524.
[15] CHATTERJEE P, SEN GUPTA S P. An X-ray diffraction study of nanocrystalline titanium prepared by high-energy vibrational ball milling [J]. Applied Surface Science, 2001, 182: 372-376.
[16] AGUAYO A, MURRIETA G, de COSS R. Elastic stability and electronic structure of fcc Ti, Zr, and Hf: A first- principles study [J]. Physical Review B, 2002, 65: 092106.
[17] XIONG S Y, QI W H, HUANG B Y, WANG M P, LI Z, LIANG S Q. Size-temperature phase diagram of titanium nanosolids [J]. Journal of Physical Chemistry C, 2012, 116: 237-241.
[18] SURYANARAYANA C. Mechanical alloying and milling [J]. Progress in Materials Science, 2001, 46: 1-184.
[19] LUTTEROTTI L, MATTHIES S, WENK H R. MAUD: A friendly Java program for material analysis using diffraction [J]. Newsletters CDP, 1999, 21: 14-15.
[20] LUTTEROTTI L, SCARDI P. Simultaneous structure and size�Cstrain refinement by the Rietveld method [J]. Journal of Applied Crystallographic, 1990, 23: 246-252.
[21] SCARDI P, LUTTEROTTI L, MAISTRELLI P. Experimental determination of the instrumental broadening in the Bragg-Brentano geometry [J]. Powder Diffraction, 1994, 9: 180-186.
[22] MIEDEMA A R, CHATEL P F, BOER F R. Cohesion in alloys-Fundamentals of a semi-empirical model [J]. Physica B: Condensed Matter, 1980, 100: 1-28.
[23] SURYANARAYNA C. Mechanical alloying and milling [M]. New York: Marcel Dekker, 2004.
[24] YU Huang, GU Jia-lin, LIU Qing, LIU Yan-zhang. Study of 6-hydrides in Ti-2A1-2.5Zr and Ti-4A1-2V alloys [J]. Rare Metals, 2006, 2: 16-20.
[25] MA X J, XIE X B, LIU P, XU L, LIU T. Synergic catalytic effect of Ti hydride and Nb nanoparticles for improving hydrogenation and dehydrogenation kinetics of Mg-based nanocomposite [J]. Progress in Natural Science: Materials International, 2017, 27: 99-104.
[26] CHATTERJEE P, SEN GUPTA S P. An X-ray diffraction study of strain localization and anisotropic dislocation contrast in nanocrystalline titanium [J]. Philosophical Magazine A, 2001, 81: 49-60.
[27] YUE L P, YAO W G, QI Z Z, HE Y Z. Structure of nanometer-size crystalline Ti film [J]. Nano Structured Materials, 1994, 4: 451-456.
[28] JING R, LIU C Y, MA M Z, LIU R P. Microstructural evolution and formation mechanism of FCC titanium during heat treatment processing [J]. Journal of Alloys and Compound, 2013, 552: 202-207.
[29] RHODES C G, WILLIAMS J C. Observations of an interface phase in the alpha/beta boundaries in titanium alloys [J]. Metallurgical Transaction A, 1975, 6: 1670-1671.
[30] CHAKRABORTY J, KUMAR K, RANJAN R, CHOWDHURY S G, SINGH S R. Thickness-dependent fcc-hcp phase transformation in polycrystalline titanium thin films [J]. Acta Materialia, 2011, 59: 2615-2623.
[31] AGUILAR C, PIO E, MEDINA A, BEJAR L, GUZMAN D. Structural study of novel nanocrystalline fcc Ti-Ta-Sn alloy [J]. Metallurgical Materials Transaction A, 2019, 50: 2061-2065.
[32] AGUILAR C, CASTRO F, MARTINEZ V, GUZMAN D, de las CUEVAS F, LOZADA L, VIELMA N. Structural study of nanocrystalline solid solution of Cu-Mo obtained by mechanical alloying [J]. Materials Science and Engineering A, 2012, 548: 189-194.
[33] NAZAROV A A, Ensembles of gliding grain boundary dislocations in ultrafine grained materials produced by severe plastic deformation [J]. Scripta Materialia, 1997, 37: 1155-1161.
[34] AGUILAR C, GUZMAN D, CASTRO F, MARTINEZ V, de las CUEVAS F, LASCANO S, MUTHIAH T. Fabrication of nanocrystalline alloys Cu-Cr-Mo super satured solid solution by mechanical alloying [J]. Materials Chemistry and Physics, 2014, 146: 493-502.
[35] NIESSEN A K, MIEDEMA A R, de BOER F R, BOOM R. Enthalpies of formation of liquid and solid binary alloys based on 3d metals: IV. Alloys of cobalt [J]. Physica B+C, 1988, 151: 401-432.
[36] NIESSEN A K, MIEDEMA A R, de BOER F R, BOOM R, Enthalpies of formation of liquid and solid binary alloys based on 3d metals: V. Alloys of nickel [J]. Physica B: Condensed Matter, 1988, 152: 303-346.
[37] BAKKER H, ZHOU G F, YANG H. Mechanically driven disorder and phase transformations in alloys [J]. Progress in Materials Science, 1995, 39: 159-241.
[38] WANG W C, LI J H, YAN H F, LIU B X. A thermodynamic model proposed for calculating the standard formation enthalpies of ternary alloy systems [J]. Scripta Materialia, 2007, 56: 975-978.
[39] ZHANG R F, ZHANG S H, HE Z J, JING J, SHENG S H. Miedema calculator: A thermodynamic platform for predicting formation enthalpies of alloys within framework of Miedema��s Theory [J]. Computer Physics Communication, 2016, 209: 58-69.
[40] ZHU Dai-man, LI Chang-rong, GUO Cui-ping, DU Zhen-min, LI Jun-qin. Thermodynamic assessment of Ni-Yb binary system [J]. Transactions of Nonferrous Metals Society of China, 2016, 26: 1055-1062.
[41] ZHU Man, FA Yang, JIAN Zeng-yun, YAO Li-juan, JIN Chang-qing, XU Jun-feng, NAN Rui-hua, CHANG Fang-e. Glass formation and magnetic properties of Fe-based metallic glasses fabricated by low-purity industrial materials [J]. Transactions of Nonferrous Metals Society of China, 2017, 27: 857-862.
[42] CHEN Song, GUO Shu-qiang, JIANG Lan, XU Yu-ling, DING Wei-zhong. Thermodynamic of selective reduction of laterite ore by reducing gases [J]. Transactions of Nonferrous Metals Society of China, 2015, 25: 3133-3138.
[43] OU S F, WANG C Y. Fabrication of a hydroxyapatite- containing coating on Ti-Ta alloy by electrical discharge coating and hydrothermal treatment [J]. Surface and Coatings Technology, 2016, 302: 238-243.
[44] YIN F, TEDENAC J C, GASCOIN F. Thermodynamic modelling of the Ti-Sn system and calculation of the Co-Ti-Sn system [J]. Calphad, 2007, 31: 370-379.
[45] HO W, WU S, HONG Y, HSU H. Evaluation of the machinability of Ti-Sn alloys [J]. Journal of Alloys and Compound, 2010, 502: 112-117.
[46] MARKER C, SHANG S L, LIU X L, LINDWALL G, LIU Z K. First-principles calculations and thermodynamic modeling of the Sn-Ta system [J]. Calphad, 2017, 57: 46-54.
[47] KIM H Y, FUKUSHIMA T, BUENCONSEJO P J S, HYUN NAM T, MIYAZAKI S. Martensitic transformation and shape memory properties of Ti-Ta-Sn high temperature shape memory alloys [J]. Materials Science and Engineering A, 2011, 528: 7238-7246.
[48] TAGHVAEI A H, BEDNARCIK J, ECKERT J. Influence of annealing on microstructure and magnetic properties of cobalt-based amorphous/nanocrystalline powders synthesized by mechanical alloying [J]. Journal of Alloys and Compound, 2015, 632: 296-302.
[49] GU Y W, GOH C W, GOI L S, LIM C S, JARFORS A E W, TAY B Y, YONG M S. Solid state synthesis of nanocrystalline and/or amorphous 50Ni-50Ti alloy [J]. Materials Science and Engineering A, 2005, 392: 222-228.
[50] Al-AQEELI N, SURYANARAYANA C, HUSSEIN M. Formation of an amorphous phase and its crystallization in the immiscible Nb-Zr system by mechanical alloying [J]. Journal of Applied Physics, 2013, 114: 153512.
Sn���Ʊ���������fcc�ṹ�ѻ��Ͻ��Ӱ��
C. AGUILAR1, E. PIO1, A. MEDINA2, C. PARRA1, R. MANGALARAJA3, P. MARTIN1, I. ALFONSO4, K. TELLO1
1. Departamento de Ingenieria Metalurgica y de Materiales, Departamento de Fisica (+) Universidad Tecnica Federico Santa Maria, Valparaiso, Chile;
2. Instituto de Investigacion en Metalurgia y Materiales, Universidad Michoacana de San Nicolas de Hidalgo, Morelia, Mexico;
3. Laboratorio de Ceramicos Avanzados y Nanotecnologia, Departamento de Ingenieria de Materiales, Universidad de Concepcion, Concepcion, Chile;
4. Instituto de Investigaciones en Materiales, Universidad Nacional Autonoma de Mexico, Campus Morelia UNAM, Morelia, Mexico
ժ Ҫ���о�Sn������ Ti-13Ta-xSn (x=3, 6, 9, 12, Ħ��������%)�Ͻ���fcc ���γɵ�Ӱ�졣�Ͻ���û�е�Ͻ����Ʊ��������豸Ϊ����ʽ��ĥ����ͨ��Rietveld�������֣�fcc ��ľ����ߴ�С��10 nm��Ӧ�����10-3���������������ѻ��Ͻ����γ�fcc��������ġ��������е���Ʒ��fcc�������֯�о�����С��10 nm�ĵ��ᾧ����Sn����Ϊ6%ʱ���ѺϽ���fcc��ĺ��������Ϊ�úϽ��������Ӧ��(1.5��10-2) �;����ߴ�(6.5 nm)��ʵ�����ݱ�������ĥ�������γɹ�����ͷǾ��ࡣ����չMiedemaģ�ͶԴٽ�������ͷǾ����γɵı�Ҫ������������ѧ���㡣�����������Sn������3%���ӵ�12%ʱ���γɷǾ�������������Ӵ�Լ10 kJ/mol��Ϊ-5 kJ/mol���ҡ�����ѧ��������XRD������HRTEM���һ�¡�
�ؼ��ʣ��ѻ��Ͻ���䣻fcc�ࣻRietveld��������е�Ͻ�
(Edited by Bing YANG)
Corresponding author: C. AGUILAR; E-mail: claudio.aguilar@usm.cl
DOI: 10.1016/S1003-6326(20)65365-1
Abstract: The effect of the amount of Sn on the formation of fcc phase in Ti-13Ta-xSn (x=3, 6, 9 and 12, at.%) alloys was studied. The alloys were synthesized by mechanical alloying using a planetary mill, jar and balls of stabilized yttrium. Using Rietveld refinement, it was found that the obtained fcc phase has crystallite size smaller than 10 nm and microstrain larger than 10-3. Both conditions are required to form an fcc phase in Ti-based alloys. For all samples, the microstructure of the fcc phase consists of equiaxial crystallites with sizes smaller than 10 nm. The largest presence of fcc phase in the studied Ti alloy was found with 6 at.% Sn, because this alloy exhibits the largest microstrain (1.5��10-2) and crystallite size of 6.5 nm. Experimental data reveal that a solid solution and an amorphous phase were formed during milling. The necessary conditions to promote the formation of solid solution and amorphous phases were determined using thermodynamic calculations. When the amount of Sn increases, the energy required to form an amorphous phase varies from approximately 10 to approximately -5 kJ/mol for 3 and 12 at.% Sn, respectively. The thermodynamic calculations are in agreement with XRD patterns analysis and HRTEM results.
