

Prediction of pre-oxidation efficiency of refractory gold concentrate by ozone in ferric sulfate solution using artificial neural networks
LI Qing-cui, LI Deng-xin, CHEN Quan-yuan
College of Environmental Science and Engineering, Donghua University, Shanghai 201620, China
Received 18 March 2010; accepted 2 July 2010
Abstract:
An artificial neural network model was developed to predict the oxidation of refractory gold concentrate (RGC) by ozone and ferric ions. The concentration of ozone and ferric ions, pulp density, oxygen amount, leaching time and temperature were employed as inputs to the network; the output of the network was the percentage of the ferric extraction iron from RGC. The multilayered feed-forward networks were trained by 33 sets of input-output patterns using a back propagation algorithm; a three-layer network with 8 neurons in the hidden layer gave optimal results. The model gave good predictions of high correlation coefficient (R2=0.966). The predictions by ANN are more accurate when compared with conventional multivariate regression analysis (MVRA). In addition, calculation with ANN model indicates that temperature is the predominant parameter and ozone concentration is the lesser influential parameter in the pre-oxidation process of refractory gold ore. The ANN neural network model accurately estimates the ferric extraction during pretreatment process of RGC in gold smelter plants and can be used to optimize the process parameters.
Key words:
pre-oxidation; multivariate regression analysis; artificial neural network; refractory gold concentrate;
1 Introduction
Refractory gold ores have been received much attention owing to the depletion of easily leachable gold minerals and the high price of gold. A ��refractory�� gold ore is an ore that is naturally resistant to recovery by conventional cyanidation and carbon adsorption processes. Typical gold-silver refractory concentrate, where precious metals are found encapsulated with sulfides, requires pretreatment such as roasting[1-2], biological oxidation[3-4] and pressure oxidation[5-7] before cyanidation[8]. Pretreatment of refractory gold ores by ozone is a better alternative of conventional pretreatment methods as the high oxidizing potential (2.0 V) of ozone is thermodynamically capable of oxidizing all metals, sulfides and arsenides[9-11].
Although a number of investigations have been conducted on the pretreatment parameters, such as oxidants amount, temperature, pulp concentration and time using various pre-oxidation techniques, the results of optimized parameters were found to be different for different refractory gold concentrate (RGC). Hence, a number of experiments have to be conducted for optimizing the pretreatment parameters for RGC when the content of sulfide matrix in RGC is different, which is very laborious and time-consuming as well as requires chemicals, equipments and skilled personnel. Some unknown, non-linear relationships may exist between the parameters and the pretreatment results, which are difficult to fit into any type of simple relationships. Therefore, there is a need for development of a generalized model or technique, which can predict pretreatment efficiency using pretreatment process parameters for any given RGC.
Pre-oxidation of RGC constitutes one of these processes for which ANNs can be utilized with great benefits. The multiplicity of the factors to be taken into consideration in a pre-oxidation process of RGC complicates any modeling using classical statistical techniques because of the non-linear and complicated pre-oxidation process. The abilities of neural networks, which were used as a tool to predict pre-oxidation efficiency, have been approved for the modeling, identification and control of complex systems and to identify underlying highly complex relationships from input and output data[12-19]. An important use of predictive model is to conduct ��what if�� experiments, whereby the response to an imposed change in reaction conditions (e.g. oxygen amount, time, ozone concentration, liquid to solid ratio, ferric sulfate concentration and temperature) can be determined without actually doing the experiment. Furthermore, the neural network model as an easy-to-use tool can be directly applied to smelting engineering of RGC since it considers only the input and output variables rather than the complex pretreatment process.
To the knowledge of the authors, no work has been reported in literature that addresses the application of ANN models for predicting pre-oxidation efficiency of RGC. The aim of the present work is to develop a neural network model to examine the relationships between process variables and ferric extraction of RGC.
2 Experimental
2.1 Materials
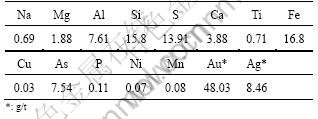
The samples used in this work were gold concentrates obtained from the Zhongyuan Gold Smelting Plant in Henan Province, China. The grain size of the concentrate was 80.0% finer than 125 ��m. Table 1 summarizes the chemical compositions of the concentrate. The mineral compositions were 20% pyrite, 16% arsenopyrite, 2% anatase, 37% muscovite and approximately 17% quartz. Analytical reagent grade chemicals and distilled water were used in all experiments.
Table 1 Chemical compositions of gold concentrate (mass fraction, %)
2.2 Analysis method
The iron content of the mineral samples was determined by a titration method according to GB/T7739.7��2007 (Chinese Standard). The samples were decomposed by hydrochloric acid, nitric acid and sulfuric acid, respectively, and then evaporated to dry. Afterward, the mineral residues were re-dissolved with dilute hydrochloric acid and titrated with potassium dichromate standard solution.
The ozone content of gas was determined by iodimetry. The determination of sulfur was conducted by gravimetric analysis of barium sulfate. Au and Ag were analyzed by fire assay, and other elements were analyzed by XRF.
2.3 Experimental procedure
An oxidation pretreatment of concentrates was performed in a cylindric semi-batch glass reactor (volume 0.5 L) with a water-cooled condenser keeping the reactor at constant temperature. A magnetic stirrer was used with the gas diffuser for sufficient circulation of the slurry. Temperature change was maintained within 0.2 ��C by a heating glass coil connected to a thermostat. Ozone was generated from dry pure oxygen using a Guolin Ozone generator.
After an appropriate amount of samples and 250 mL ferric sulfate solution with pH 1.0 were added into reactor, oxidizing pretreatments were conducted at a predetermined temperature (60-100 ��C) for several reaction intervals (8-16 h). During the reaction, ozone- oxygen mixture was continuously sparged into the slurry solution agitated at specified speed. After reaction, slurry was filtered in a pressure filter using air at 0.135 MPa pressure. The filter cake was washed and dried in an oven at 90 ��C overnight. Then, the solid residue was pulverized and analyzed.
The efficiency of pre-oxidation for refractory gold concentrate is denoted by ferric extraction, which is defined by the following expression:
![]() (1)
(1)
where �� denotes the ferric extraction; c0 and c are the ferric content of initial feed and oxidized residues, respectively; m0 and m are the mass of initial feed and oxidized residues, respectively.
3 Artificial neural networks (ANNs)
The architecture of ANN is a massively parallelly distributed information-processing system that has certain performance characteristics resembling biological networks of the human brain. Many ANN structures have been proposed and explored since 1950s. Neural networks are formed by input data vectors, neurons and output functions. Input data to the neuron are transformed by means of a base function and leave by an activation function connection between input and output data and neurons are made by weight factors Wij, which determine the effect of the input variable i on the neuron j.
The multilayer feed forward network with a back propagation (BP) learning algorithm is the most prevalent and generalized neural network currently in use, and straight forward to implement[20]. The network consists of multiple input nodes, one or several hidden layers, and a single output where each neuron is connected to a large number of others. The input signal is passed among them and each of them calculates its own output (Hk) from the weights associated with connections using the equation:
![]() (2)
(2)
where f(?) is the transfer function, whereas wik ![]() and ��k are the weight coupling the kth output node to the ith node of the input vector I and the associated bias for the kth output node. Generally, the transfer functions are sigmoidal function, hyperbolic tangent and linear function, of which the most widely used for non-linear relationship is the sigmoidal function. The number of neurons in the input layer is usually equal to the number of input variables. The number of output layer neurons is usually the same as the target variable number. The number of neurons in the hidden layer is determined to optimize performance. A neural network must be trained to determine the values of the weights that will produce the correct outputs.
and ��k are the weight coupling the kth output node to the ith node of the input vector I and the associated bias for the kth output node. Generally, the transfer functions are sigmoidal function, hyperbolic tangent and linear function, of which the most widely used for non-linear relationship is the sigmoidal function. The number of neurons in the input layer is usually equal to the number of input variables. The number of output layer neurons is usually the same as the target variable number. The number of neurons in the hidden layer is determined to optimize performance. A neural network must be trained to determine the values of the weights that will produce the correct outputs.
For the assessment of model performance, there are several criteria used in Refs.[21-22]. In the present work, the following three criteria were used: the determination coefficient (R2), the mean square error (MSE), and the mean absolute error (MAE). The ANN responses are more precise if R2, MSE, and MAE are found to be close to 1, 0, and 0, respectively. These R2, MSE, and MAE terms are defined as:
![]() (3)
(3)
![]() (4)
(4)
 (5)
(5)
where ti is the target value of the ith pattern; oi is the output value of the ith pattern, and p is the total number of data.
4 Network prediction model
Figure 1 presents the calculation sequence with regards to the sample processing and training. It demonstrates the procedures for implementing neural network to predict pre-oxidation efficiency of refractory gold concentrate. Neural network training can be made more efficiently if certain pre-processing steps are performed on the network inputs and targets. Initially, inputs and targets were normalized so that they fall in the range of [0, 1]. After the network has been trained, the outputs need to be transferred back to the same units that were used for the original targets for comparison purpose. The commercial software package, Matlab 7.0 (MathWorks, Natick, MA, USA) was used for ANN modeling.
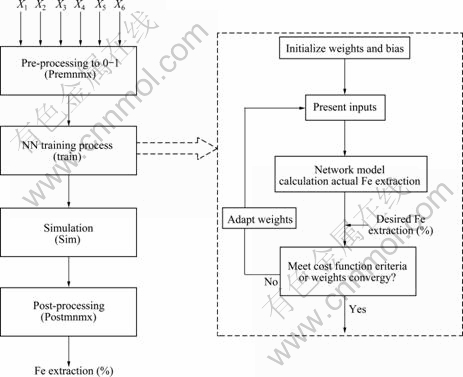
Fig.1 Calculation procedure of network prediction model: X1��Temperature, ��; X2��Time, h; X3��Liquid to solid ratio; X4��Ferric concentration, mol/L; X5��Ozone concentration, 10-6; X6��Oxygen amount, L/min
There are numerous factors used to achieve the best model performance for ANN, which include the number of hidden layers, the number of hidden neurons, transfer function (sigmoid, tan-sigmoid, etc), training algorithms (BP, LM, etc), and learning parameters (learning rate, momentum factor, and initial weights). The detailed information about each parameter (definition, function, range, etc) is provided by BASHEER and HAJMEER[23] and MAIER and DANDY[24]. Depending on the problem being solved, the success of training varies with the selected factors, and a trial-and-error procedure is normally preferred. In this study, a multilayered feed forward neural network with a back propagation algorithm (FFBP) was adopted. Five important aspects that must be determined in design procedure of FFBP were as follows:
1) Training and test data selection;
2) Selection of neurons�� transfer functions;
3) Selection of FFBP structure;
4) Selection of training algorithm and its parameters;
5) Testing the FFBP generalization.
5 Results and discussion
5.1 Effect of pretreatment on refractory gold concentrate
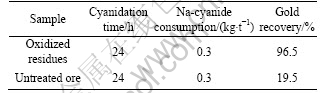
The pre-oxidation experiments were carried out according to the procedure described in section 2.3. After the refractory gold concentrate was pre-oxidized by ozone and ferric sulfate under the optimum conditions (temperature of 100 ��C, time of 8 h, liquid to solid ratio of 20, ozone concentration of 54��10-6 and 0.7 mol/L ferric concentration), the oxidized residues were subjected to cyanide leaching tests. The following parameters were chosen: pulp density 200 g/L, pH 9.5 (adjusted with NaOH), cyanide (NaCN) concentration 2.0-3.0 g/L, air supply 25 L/h, and temperature 20 ��C. The experiments run for 24 h. Samples were regularly taken for analysis of cyanide and metal concentrations in solution in order to calculate the metal extraction and cyanide consumption. A summary of the results is given in Table 2, clearly indicating that pre-oxidation significantly improved the recovery of gold. The gold extraction was 96.5%, about 77% greater than the gold extraction without pre-oxidation. Pretreatment with ozone and ferric ions for refractory gold concentrate was a promising alternative to enhance the recovery of gold[25].
Table 2 Result of cyanidation experiment
5.2 FFBP model development
5.2.1 Training and testing data
The ANN model was trained using 32 randomly selected data (accounting for 80% of the total data) while the remaining 9 data (accounting for 20%) were utilized for testing of the network performance. The experimental conditions and the experimental results (ferric extraction) were set as the input matrix and the target matrix.
Since the neural network performance can be made more efficiently by certain pre-processing steps, all input data and output in the present work were normalized according to
Np=(Ap-Amean, p)/Astd, p (6)
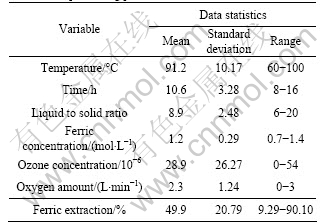
where Ap is the actual parameter; Amean, p is the mean of actual parameters; Astd, p is the standard deviation of actual parameter and Np is the normalized parameter (input). Then the average value would be zero and the standard deviation equals 1. Data statistics of model variables are presented in Table 3.
Table 3 Pre-processing parameters for ANN
5.2.2 Selection of BP algorithm
Although ANN is a powerful tool to predict the nonlinear or time-variant systems, different training algorithms can lead to different generalization characteristics, and no one training algorithm may be uniformly best[26]. Therefore, trial and error method was applied to obtain the optimal training algorithm.
In this subsection, the same neural configuration (6-6-1 network topology) was trained using the 11 BP algorithms. Also, a tangent sigmoid function (tansig) and a logistic sigmoid function (logsig) were used as the transfer functions in hidden and output layers, respectively.
Eleven BP algorithms were compared to select the best fitting one. The performance of the BP algorithms was evaluated with the MSE and the determination coefficient (R2) between the modeled output and the measured data set. Table 4 shows a brief description of training functions. The training results are provided in Table 5, which reveals that the best prediction result is obtained when the BP algorithm is LM algorithm.
Table 4 Descriptions of training functions
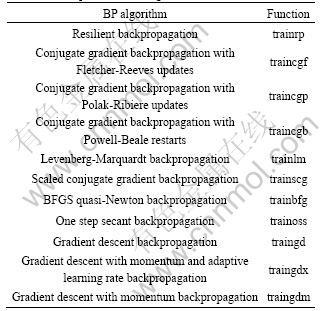
Table 5 Comparison of 11 back propagation algorithms with 6 neurons in hidden layer
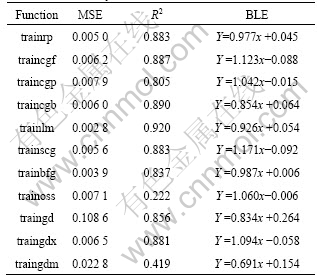
As shown in Table 5, the MSE and R2 are 0.002 8 and 0.920 for trainlm function, respectively. The LM algorithm with the least MSE and the maximum R2 is found as the best training algorithm, compared with other BP algorithms such as gradient descent algorithms and conjugate gradient algorithms. LM algorithm outperforms all the aforementioned competitors in terms of MSE. Such an observation is not surprising, since neural network training task is in fact an unconstrained minimization problem with the MSE performance index as the objective function. Hence, the LM algorithm selected as the best training algorithms would be employed for training all the FFBP networks.
5.2.3 Determination of FFBP network topology
Topology of an artificial neural network is determined by the number of its layers, the number of nodes in each layer and the nature of transfer functions. Optimization of network topology is probably the most important step in development of model[27]. There is no exact guide for the determination of these parameters. Topology of an artificial neural network is designed via a tedious trial and error process.
Each topology was repeated 20 times to avoid random correlation due to random initialization of the weights. The MSE was used as the error function. The results presented are the best obtained.
5.2.3.1 Selection of transfer functions
One important factor in FFBP network design is the type of transfer functions since FFBP networks owe their nonlinear capability to the use of nonlinear transfer functions[28]. The type of transfer function to be used by the hidden nodes and the output node still had to be determined. Three commonly used transfer functions were examined separately in each layer, and the proper transfer functions were selected according to the MSE value of testing data.
Figure 2 shows the performance results of the combinations of the three commonly used transfer functions for the hidden and the output layers in the FFBP model. The numbers in the x- and y-axis are the serial numbers for the transfer functions listed in Table 6. z-axis shows the MSE values, which represent the deviations between the estimated and experimental results for these combinations of different transfer functions. As can be seen from Fig.2, the tan-sigmoid/log-sigmoid combination yielded the best results (z=2.8��10-3) among different combinations of tan-sigmoid, log-sigmoid and linear functions. Therefore, tan-sigmoid and log-sigmoid functions were selected as the propagation functions in the hidden layer and output layer, respectively.
Table 6 Transfer functions tested in this study
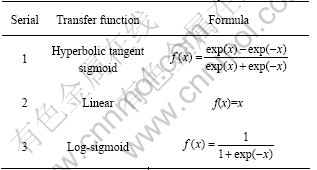
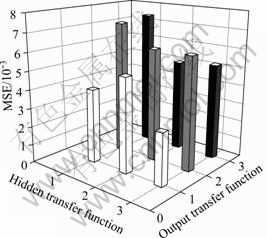
Fig.2 MSE values of different combinations of transfer functions used in hidden and output layers
5.2.3.2 Selection of number of hidden neurons
It is usually unnecessary to use more than one hidden layer in a multi-layer feed-forward network, and varying the number of hidden nodes in the one hidden layer is usually sufficient for delivering distinct results. In this study, only one hidden layer was used. Training the neural networks by LM algorithm is sensitive to the number of neurons in the hidden layer. The more the number of neurons, the better the performance of the neural network in fitting the data. However, using too many hidden nodes will make the network generalize poorly, memorizing the training data rather than focusing on its significant features thus result in the overfitting.
In order to determine the optimum number of hidden nodes, a series of topologies were used, in which the number of nodes ranged from 4 to 15. The influence of the number of hidden nodes on the accuracy of neural models for test data sets is depicted in Fig.3. From this figure, as the number of neurons was increased up to 8, there was perceivable improvement in the prediction accuracy. However, increase in the number of neurons did not lead to any improvement in the results when the number of hidden neurons was more than 8. Thus, for the prediction of the total sensory score, the simplest ANN model with 8 neurons in one hidden layer appeared to be the best, which yielded an MSE of 3.6��10-6 for the training data and 0.001 3 for the test data. Among various network configurations, 6-8-1 configuration was found to be the best performing network structure, and hence, was chosen to be the final model.
The LM algorithm training was stopped after 13 iterations (Trainlm, Epoch 13/1000) for the optimal FFBP because minimum gradient reached, which showed that the network converged rapidly with LM algorithm. Attempting to improve the results by changing some of
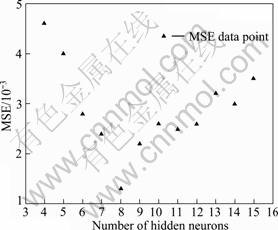
Fig.3 Influence of number of hidden nodes on accuracy of neural models
the network parameters such as learning rate and final error did not improve the predictive performance of the FFBP model.
Thus, based on the above discussion and objective of the investigation, the best network designed to predict the pre-oxidation efficiency of RGC was obtained as follows: a three-layer FFBP network, with tan-sigmoid transfer function (tansig) at hidden layer with 8 neurons and a log-sigmoid transfer function (logsig) at output layer. A schematic of the BP network is described in Fig.4. Furthermore, the final feed forward neural model was implemented in Matlab software, with the following characteristics:
1) net.trainParam.goal=0; aimed training final error;
2) net.trainParam.lr=0.05; learning rate;
3) net.trainParam.show=25; screen actualization (epochs);
4) net.performFcn=��mse��;
5) net = newff(minmax(ptr), [8, 1], {��tansig�� ��logsig��}, ��trainlm��).
where ptr represents the network inlet values of training set (temperature, time, liquid to solid ratio, ferric concentration, ozone concentration, oxygen amount). The outlet variable is the ferric extraction.
5.3 FFBP network generalization
The performance of the trained FFBPs was also measured by carrying out a regression analysis between the predicted outputs and the experimental values. Figure 5 presents the comparison between the ferric extraction of refractory gold concentrate from the experimental and estimated results in the training set. It should be noted in this figure that for the FFBP model the slope and the correlation coefficient are equal to 1, thus, indicating a quite good fit.
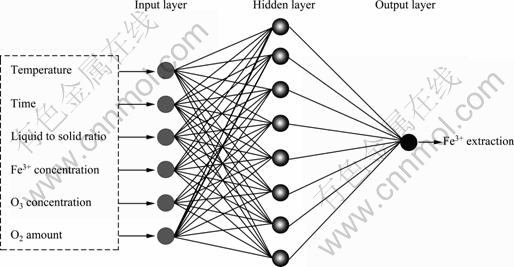
Fig.4 Final architecture of ANN
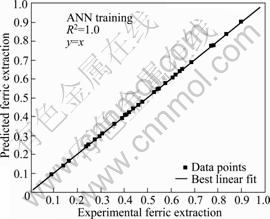
Fig.5 Parity plot for ferric extraction of RGC in training set
Figure 6 provides the results of the comparison between the ferric extraction of refractory gold concentrate from the experimental and estimated results in the testing set. The R2 value and the slope between the estimated and experimental ferric extraction were 0.966 and 1.035, respectively. The results in Fig.6 demonstrate that the FFBP model could provide desirable results in most of the cases, with the minimum and maximum deviations between the estimated and experimental ferric extraction being only 0.03% and 5.11%, respectively. The output, i.e. the estimated ferric extraction after pre-oxidation, matched the experimental data very well, indicating that the proposed FFBPs were capable of successfully predicting the pre-oxidation efficiency of refractory gold concentrate under different reaction conditions.
5.4 Determination of importance of each input variable on efficiency of process
The ANN used in this work provided the internodes
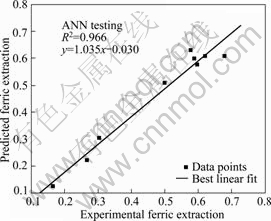
Fig.6 Parity plot for ferric extraction of RGC in testing set
weights. The weights are coefficients between the artificial neurons, which are analogous to synapse strengths between the axons and dendrites in real biological neurons. Therefore, each weight decides what proportion of the incoming signal will be transmitted into the neuron��s body[29]. The neural net weight matrix can be used to assess the relative importance of the various input variables on the output variables.
The procedure for partitioning the connection weights to determine the relative importance of the various inputs was proposed first by GARSON[30] and repeated by GOH[31]. The equation based on the partitioning of connection weights is given as follows:
 (7)
(7)
where Ij is the relative importance of the jth input variable on the output variable; Ni and Nh are the numbers of input and hidden neurons, respectively; w are the connection weights, the superscripts ��i��, ��h�� and ��o�� refer to input, hidden and output layers, respectively, and subscripts ��k��, ��m�� and ��n�� refer to input, hidden and output neurons, respectively. Table 7 represents the weights of the input-hidden layer connections, and the hidden-output layer connections. The relative importance of various variables is summarized in Table 8.
As can be seen, all of the variables (oxygen amount, time, ozone concentration, liquid to solid ratio, ferric sulfate concentration and temperature) have strong effects on the pre-oxidation efficiency of refractory gold concentrate. Therefore, none of the variables studied in this work could be neglected from the present analysis. However, temperature and ozone concentration, with relative importance of respectively 23.9% and 21.6%, appeared to be more influential parameters in the pre-oxidation process.
5.5 Multivariate regression analysis (MVRA)
The purpose of multiple regressions is to learn more about the relationship between several independent or predictor variables and a dependent or criterion variable. The goal of regression analysis is to determine the values of parameters for a function that causes the function to best fit a set of data provided. When there is more than
one independent variable, then multivariate regression analysis is used to get the best-fit equation. Multiple regressions analysis solves the data sets by performing least squares fit. It constructs and solves the simultaneous equations by forming the regression matrix, and solving the co-efficient using the backslash operator. The MVRA has been done by same data sets and same input parameters which we used in ANN.
The equation for prediction of ferric extraction by MVRA is
Y=-74.18 + 0.79X1 + 0.79X2 + 1.94X3 + 2.69X4 +0.51X5 + 3.87X6 (8)
As shown in Fig.7, the coefficient of determination between the predicted and the measured values of ferric extraction by MVRA is 0.817 2. Figure 8 illustrates the comparison between the measured and predicted values of ferric extraction by ANN and MVRA. From Figs.6-8, the conclusion can be made that the prediction of ferric extraction by neural network is very accurate and closer to the measured values; the high coefficient of determination values shown by ANN as compared to that by MVRA indicates better prediction capability of ANN over MVRA. The mean absolute percentage error (MAPE) for ferric extraction was 7.66% by neural network method, whereas the MAPE for ferric extraction was 19.92% calculated by MVRA method.
Table 7 Weights of adopted FFBP
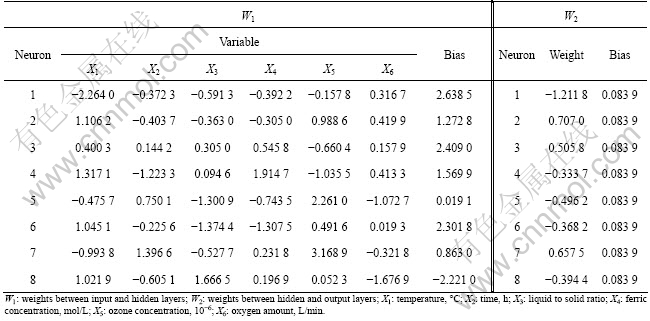
Table 8 Relative importance of input variables on value of efficiency
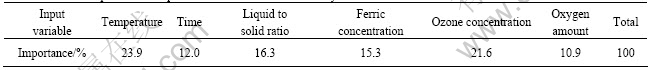
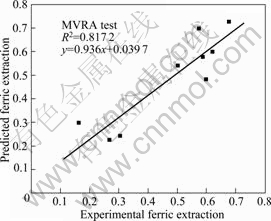
Fig.7 Measured ferric extraction vs predicted one by MVRA
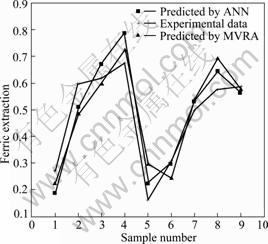
Fig.8 Comparison of measured ferric extraction with predicted ferric extraction by ANN and MVRA
6 Conclusions
1) The pre-oxidation efficiency of RGC by ozone and ferric ions was successfully predicted by applying a three-layer neural network with 8 neurons in the hidden layer, and using a back propagation algorithm. Simulations based on the ANN model were performed in order to estimate the ferric extraction under different conditions.
2) All of the studied parameters in this work have considerable effects on the pre-oxidation process, and the temperature and ozone concentration with a relative importance of 23.9% and 21.6% appear to be the most influential parameters in the pretreatment process.
3) The results of modeling confirm that neural network modeling can effectively reproduce experimental data and predict the process. It was seen that the error rate predicted by the artificial neural network is smaller than that predicted by the multiple regression analysis.
4) The prediction capability of ANN model offers an advantage for the optimization of processing conditions to increase profits in gold smelting plants.
References
[1] LABROOY S R, LINGE H G, WALKER G S. Review of gold extraction from ores [J]. Minerals Engineering, 1994, 7(10): 1213-1241.
[2] ANGELIDIS T N, KYDROS K A. Selective gold dissolution from a roasted auriferous pyrite-arsenopyrite concentrate [J]. Hydrometallurgy, 1995, 37(1): 75-88.
[3] LAWRENCE R W, BRUYNESTEYN A. Biological preoxidation to enhance gold and silver recovery from refractory ores and concentrates [J]. Can Min Metall Bull, 1983, 76: 107-110.
[4] DENG T L, LIAO M X. Gold recovery enhancement from a refractory flotation concentrate by sequential bioleaching and thiourea leach [J]. Hydrometallurgy, 2002, 63(3): 249-255.
[5] MASON P G. Energy requirements for the pressure oxidation of gold-bearing sulphides [J]. Journal of Metals, 1990, 42(9): 15-18.
[6] THOMAS K G. Alkaline and acid autoclaving of refractory gold ores [J]. Journal of Metals, 1991, 43 (2): 16-19.
[7] MURTHY D S R, DEY M L, ROYCHOWDHURY S K, MATHUR S B, AKERKAR D D. Studies on extraction of refractory gold silver through thiourea leaching [C]//MISRA V N, HALBE D, SPOTTISWOOD D J. Int Conf Ext Metall Gold Base Met. Parkville: The AusIMM, 1992: 329-332.
[8] WEIR D, BEREZOWSKY M. Gold extraction from refractory concentrates [J]. CIM Bulletin, 1984, 77: 84-85.
[9] ANTWERP W P V, LINCOLN P A. Precious metal recovery using U.V. ozone: United States, 4642134[P]. 1987.
[10] SCHEINER J B, LINSTROM R E. Recovery of gold from ores: United States, 3764650[P]. 1973.
[11] ELORZA-RODRIGUEZE, NAVA-ALONSOF, JARAJ, LARA- VALENZUELAC. Treatment of pyritic matrix gold-silver refractory ores by ozonization-cyanidation [J]. Minerals Engineering, 2006, 19(1): 56-61.
[12] ALDRICH C, REUTER M A. Monitoring of metallurgical reactors by the use of topographic mapping of process data [J]. Minerals Engineering, 1999, 12 (11): 1301-1312.
[13] JORJANI E, CHEHREH C S, MESROGHLI S. Prediction of microbial desulfurization of coal using artificial neural networks [J]. Minerals Engineering, 2007, 20(14): 1285-1292.
[14] HAYKIN S. Neural networks: A comprehensive foundation [M]. London: Prentice Hall, 1999.
[15] CILEK E C. Application of neural networks to predict locked cycle flotation test results [J]. Minerals Engineering, 2002, 15(12): 1095-1104.
[16] CHEHREH C S, HOWER J C, JORJANI E, MESROGHLI S, BAGHERIEH A H. Prediction of coal grindability based on petrography, proximate and ultimate analysis with multiple regression and artificial neural network models [J]. Fuel Processing Technology, 2008, 89(1): 13-20.
[17] JORJANI E, CHEHREH C S, MESROGHLI S. Application of artificial neural networks to predict chemical desulfurization of Tabas coal [J]. Fuel, 2008, 87(12): 2727-2734.
[18] CASALI A, GONZALEZ G, VALLEBUONA G, PEREZ C, VARGAS R. Grindability softsensors based on lithological composition and on-line measurements [J]. Minerals Engineering, 2001, 14(7): 689-700.
[19] SINGH V, RAO S M. Application of image processing and radial basis neural network techniques for ore sorting and ore classification [J]. Minerals Engineering, 2005, 18(15): 1412-1420.
[20] HANCKE G P, MALAN R. A modal analysis technique for the on-line particle size measurement of pneumatically conveyed pulverized coal [J]. IEEE Transactions on Instrumentation and Measurement, 1998, 47(1): 114-122.
[21] SRINIVASULU S, JAIN A. A comparative analysis of training methods for artificial neural network rainfall�Crunoff models [J]. Applied Soft Computing, 2006, 6(3): 295-306.
[22] SINGH P, DEO M C. Suitability of different neural networks in daily flow forecasting [J]. Applied Soft Computing, 2007, 7(3): 968-978.
[23] BASHEER I A, HAJMEER M. Artificial neural networks: fundamentals, computing, design, and application [J]. J Microbiol Methods, 2000, 43(1): 3-31.
[24] MAIER H R, DANDY G C. Neural networks for the prediction and forecasting of water resources variables: A review of modelling issues and applications [J]. Environ Model Software, 2000, 15(1): 101-124.
[25] LI Q C, LI D X, QIAN F J. Pre-oxidation of high-sulfur and high-arsenic refractory gold concentrate by ozone and ferric ions in acidic media [J]. Hydrometallurgy, 2009, 97(1-2): 61-66.
[26] HASHEM S, YIH Y, SCHMEISER B. An efficient model for product allocation using optimal combinations of neural networks [C]//DAGLI C, BURKE L, FERNANDEZ B, GHOSH J. Intelligent Engineering Systems through Artificial Neural Networks. New York: ASME Press, 1993: 669-674.
[27] DURAN A, MONTEAGUDO J M. Solar photocatalytic degradation of reactive blue 4 using a Fresnel lens [J]. Water Research, 2007, 41(3): 690-698.
[28] BOWEN W R, JONES M G, WELFOOT J S, YOUSEF H N S. Predicting salt rejection at nanofiltration membranes using artificial neural networks [J]. Desalination, 2000, 129(2): 147-162.
[29] SLOKAR Y M, ZUPAN J, MARECHAL A M L. The use of artificial neural network (ANN) for modeling of the H2O2/UV decoloration process: part I [J]. Dyes Pigm, 1999, 42(2): 123-135.
[30] GARSON G D. Interpreting neural network connection weights [J]. Artificial Intelligence Expert, 1991, 6(4): 47-51.
[31] GOH A T C. Back-propagation neural networks for modeling complex systems [J]. Artificial Intelligence in Engineering, 1995, 9(3): 143-151.
����BP����ij�����������Ԥ������ѡұ���������Ԥ��
�����, �����, ��ȪԴ
������ѧ ������ѧ�빤��ѧԺ���Ϻ� 201620
ժ Ҫ��ʹ��������ģ��Ԥ����ѡұ���ڳ��������������������µ��������ʡ����������������6����������������Ũ�ȣ�����������Ũ�ȣ�Һ�̱ȣ�������������ʱ�䣬��Ӧ�¶ȣ������������������ѡұ�������������ʡ����������㷨�Ķ��ǰ��������ʹ��33��ʵ��ֵ������6-11-1 ������ṹ��������ѵ���õ�һ������ģ�ͣ������ϵ��R2Ϊ0.966�����������볣��Ķ�Ԫ���Իع�2��ģ�ͽ��жԱȡ�������ļ����������������в��������У��¶�������Ҫ��Ӱ�����أ�����Ϊ�ڶ���Ҫ��Ӱ�����ء�������ģ���ܹ�ȷ��Ԥ��ƽ�ұ��������ѡұ����Ԥ�������������������ʣ����������Ż����ղ�����
�ؼ��ʣ�Ԥ��������Ԫ�ع�������˹������磻��ѡұ��
(Edited by YUAN Sai-qian)
Foundation item: Project (2006AA06Z132) supported by High-tech Research and Development Program of China; Project (B604) supported by Leading Academic Discipline Project of Shanghai
Corresponding author: LI Deng-xin; Tel: +86-21-67792541; Fax: +86-21-67792522; E-mail: lidengxin@dhu.edu.cn
DOI: 10.1016/S1003-6326(11)60730-9
