
Trans. Nonferrous Met. Soc. China 22(2012) 2792-2798
Experimental studies on pillar failure characteristics based on acoustic emission location technique
XU Shuai, LIU Jian-po, XU Shi-da, WEI Jiong, HUANG Wen-bai, DONG Long-bin
Key Laboratory of Ministry of Education on Safe Mining of Deep Metal Mines, Northeastern University, Shenyang 110819, China
Received 1 February 2012; accepted 31 May 2012
Abstract:
Acoustic emission (AE) technique is a useful tool for investigating rock damage mechanism, and is used to study the temporal-spatial evolution process of microcracks during the similar pillar material experiment. A combined AE location algorithm was developed based on the Least square algorithm and Geiger location algorithm. The pencil break test results show that the location precision can meet the demand of microcrack monitoring. The 3D location of AE events can directly reflect the process of initiation, propagation and evolutionary of microcracks. During the loading process, stress is much likely concentrated on the area between pillar and roof of the specimen, where belongs to danger zone of macroscopic failure. When rock reaches its plastic deformation stage, AE events begin to decrease, which indicates that AE quiet period can be seen as precursor characteristic of rock failure.
Key words:
rock damage mechanism; pillar specimen; failure characteristics; temporal-spatial evolution; microracks; acoustic emission; location algorithm; quiet period;
1 Introduction
Rock is a typical inhomogeneous and anisotropic material, and contains several natural defects with various scales, such as micro cracks, pores, fissures, joints inclusions, and precipitates. A great deal of acoustic emission (AE) events occurred when the rock specimen was subjected to a loading stage until failure. AE signal is associated with propagating of micro-cracks, and contains plentiful information of internal structure change on the rock. Therefore, the failure behavior could be interpreted by the AE results. More and more geotechnical engineering researchers have focused on the AE application into their studies [1,2].
The studies concerning microcracks temporal- spatial evolution process inside rock depends on the high-accuracy AE event location, and hence AE location algorithm becomes more important. The studies of AE location began in the 1960s. MOGI [3] had carried out line location and plane location by using analytic method based on the difference of P-wave arrival time detected by four sensors. SCHOLZ [4] had used the difference of S-wave arrival time and Least square algorithm to calculate the location of 22 large AE events, and pioneered the methods of AE location calculated by multi-channels signals. To date, many AE location algorithms have been developed. They can be classified into two different styles according to location theory, regional location and point location. Three types of sensor location approaches have been used, such as line location, plane location and 3-D location according to arrangement. Commonly used AE location algorithms include Least square algorithm [5], simultaneous inversion algorithm [6], relative location algorithm [7], Geiger location algorithm [8,9], and simplex location algorithm [10]. Based on these AE location algorithms, many research results of temporal-spatial evolution of microcracks within rock have been obtained [11-16].
In mines, there are lots of gobs that would cause stress concentration and result in pillar failure. Therefore, it is very meaningful to monitor pillar stability by using AE technique. But the precision of AE event location calculated by the above mentioned algorithms is not satisfactory when the fracture point is beyond the range of sensors array, and hence it cannot meet the requirement under complex mining conditions. In this work, a combined AE location algorithm based on the Least square algorithm and Geiger location algorithm after AE signal arrival time was determined by the Akaike Information Criterion (AIC) and Auto- Regression (AR) model was presented. In addition, pillar simulation experiment was carried out and major effort was considered into the current study. In particular, the AE concentrated characteristics and failure modes were identified during loading on pillar specimens.
2 Rock specimens and experimental techniques
2.1 Rock specimens
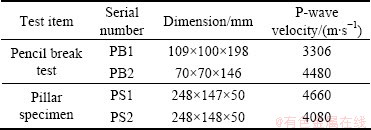
Granite and sandstone employed in the present study were prepared in accordance with the suggested methods by ISRM. PB1 and PB2 denote sandstone and granite, respectively. The cubic samples shown in Fig. 1(a) were performed the pencil break test. The granite samples PS1 and PS2 were used to carry out pillar simulation experiment shown in Fig. 1(b). The size and wave velocity of rock specimens are listed in Table 1.
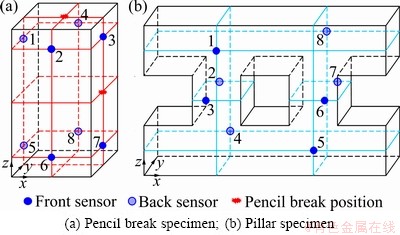
Fig. 1 Configuration of AE sensors
Table 1 Specifications of rock specimens
2.2 Sensors arrangement
Eight Nano30 sensors with frequency sensitivity between 125 Hz to 750 kHz and a 40 dB pre-amplification (1220A-AST) were used in the AE system. These sensors were fixed on rock faces by gum band, and vaseline was used for coupling. Plastic cushions were sandwiched between steel platen and specimen to minimize noise generation due to friction. Figure 1 shows the arrangement of eight AE sensors.
2.3 Test equipment and loading way
A servo-controlled hydraulic testing machine with the maximum axial loading of 3000 kN was used in this experiment. The machine has a high sampling speed to record the load and displacement. In this work, uniaxial loading was applied and the loading rate was 20 kN/min. AE signals were real-time acquired using a multi-channel, high-speed AE testing and analyzing system, namely HUS (hyperion ultrasonic system). The temporal and spatial distribution of AE events within the specimen during loading was visually displayed in 3D by using a post processor. The threshold was set at 50 dB to gain a high signal/noise ratio. The sampling frequency was set at 2 MHz. Figure 2 shows the system of the experimental instruments.

Fig. 2 Schematic diagram of AE and loading system
3 Location technique of AE events
3.1 Determination of P-wave arrival time
The determination of P-wave arrival time is based on assuming that waveform can be seen as normal state before and after arrival, and the best cut point is used as the time P-wave arrival time.
The data of waveform can be seen as a time series. The time series of n data are divided into two parts, one with the number of k data, and other with n-k data. For each value of k, auto-regression models (AR model) of k and n-k data were established and Akaike information criterion (AIC) was adopted to estimate the rationality of the models. The criterion, Cap, is expressed as follows [2]:

 (1)
(1)
where l1, l2,  and
and  are the degrees and variances of AR model of k data and n-k data, respectively. The value of Cap of each k is calculated and the time to the minimum value of Cap can be seen as P-wave arrival time (Fig. 3).
3.2 Location algorithm of AE events
The least square algorithm can only process one iteration whose location accuracy is much lower, but with a fast convergence rate. The location accuracy of Geiger algorithm is much higher, but the selection of initial iterative value is different. Therefore, a combined AE location algorithm based on the Least square algorithm and Geiger location algorithm was developed in this work. Before locating AE events, AE signals would be filtered to remove noise signals and gain accurate arrival time of P-wave. Then, the Least squares algorithm and Geiger algorithm were used to calculate AE event position and occurring time according to the difference of sensor coordinate and P-wave arrival time. The Least squares algorithm has an advantage of fast convergence in calculating the initial iterative value ��(x, y, z, t). Then, a modified vector ����(��x, ��y, ��z, ��t) was calculated by the Geiger algorithm in each iteration and added on the results of the last iteration to abstain a new iterative value. The iteration continues until to match a required error criterion. Figure 4 shows the flow chart of the AE location principle.
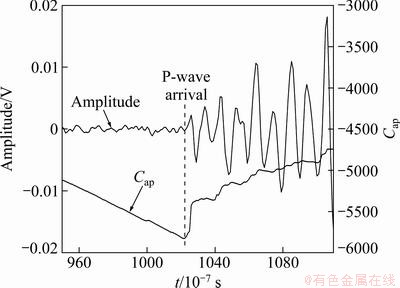
Fig. 3 Determination of P-wave arrival time
In this work, location analysis on AE events
attempts to minimize the arrival time difference between observed and calculated ones. With each iterative calculation, the estimated arrival time at the sensor site is calculated and compared with the observed arrival time and an estimate of the error is obtained. Absolute deviation method is used to estimate the error as follows:
 (2)
(2)
where N is the number of observed arrivals; toi is the observed arrival time at the ith sensor; tci is the calculated arrival time at the ith sensor.
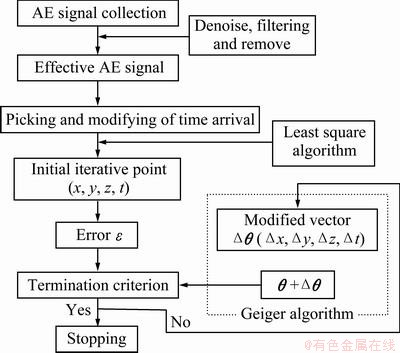
Fig. 4 Flow chart for AE location mechanism
4 AE event location result of pencil break test
Eighty pencil break tests were carried out on surface of PB1 and PB2 specimens, of which the top and side faces were 50 and 30, respectively. Figure 5 shows the waveforms of pencil break test on top surface of PB1 specimens. It can see that the signal quality is fine. Sensors 5-8 are close to the pencil break positions and the time of AE signals arrival is earlier, while sensors 1-4 are far away from the pencil break positions and the time of AE signals detected by sensor is later.
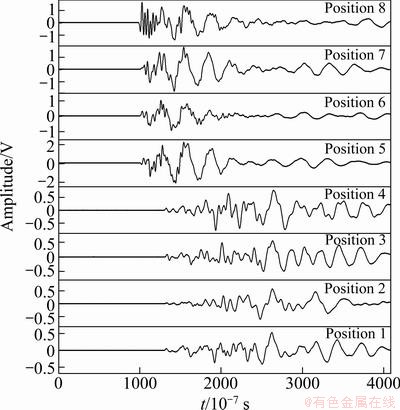
Fig. 5 Waveforms detected by sensors
Through calculating signal arrival time by AE combined location algorithm, 78 location results were obtained from the 80 pencil break tests of PS1 specimens. From Fig. 6, it can be seen that the location results of pencil break tests are concentrated on the pencil break positions. For PS1 specimens, the coordinates of pencil break positions of top and side faces are (54.5, 50, 198) and (54.5, 0, 99), respectively. Table 2 shows the location errors of PS1 specimens. It can be seen that the location error of 90% events is less than 10 mm and the error of 60% events is less than 6 mm, showing that the location precision can meet the demand of microcracks monitored by AE technique.
The combined location method was introduced in this work to ensure full use of the advantage of the Least square algorithm to effectively solve the problem of initial Iterative value. In addition, this location algorithm can significantly speed up the convergence processing and reduce iterations by the Geiger method, which is meaningful for processing a large amount of AE data generated during experiment.
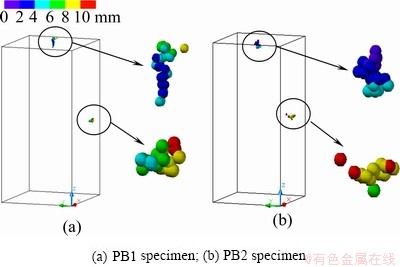
Fig. 6 AE event location results of pencil break tests
Table 2 Location error of PS1 specimens (in part)

5 Failure characteristics of pillar specimen
5.1 Spatial distribution of AE events
Figure 7 shows the location result of AE events of PS1 specimens with different stress levels. At the initial loading stage, 20% of peak stress is shown in Fig. 7(a). The located AE events are much less, but they have clustered in the bottom left corner. This indicates that stress concentration occurred in this area. When the stress achieves 40% of the peak stress, as shown in Fig. 7(b), AE events concentrate in area A much obviously, and begin to cluster in the top right corner of SP1 specimens. With stress increasing, AE events are highly centralized in areas A and B. When rock failure occurs, a few AE events also cluster in areas C and D shown in Fig. 7(e). Finally, shear failure occurs at the junction of pillar and roof in SP1 specimen, such as areas A and B. The 3D location of AE events can directly reflect the process of initiation, propagation and evolution of microcracks and the stress re-distribution within specimen, which is valuable for studying the rock failure mechanism.
For PS2 specimens shown in Fig 8, located AE events are much less during the whole loading process than PS1 specimens. But, when rock failure occurs, AE events are also clustered in areas A, B and C shown in Fig. 8(c). The failure model of SP1 specimen is similar to SP2 specimen, shear failure at the junction of pillar and roof. It indicates that the area between pillar and roof is much likely appearance stress concentration, which can be identified as a danger zone of macroscopic failure, and can be used to guide for monitoring mine ground pressure disaster.
5.2 AE activities
Figure 9 shows the relationships between stress��strain and AE rate of SP1 and SP2 specimens at a time interval of 10 s. It can be seen that AE rate is much higher from the initial loading phase to elastic deformation phase. This phenomenon is different from complete rock specimens [11]. This indicates that during the whole loading phase, a large number of microcracks generated and propagated. It is worth noting that once the rock reaches plastic deformation stage, AE events decrease. This stage can be seen as a quiet period. AE quiet period is related with the rock plastic deformation. During this phase, the stress increment will diminish in unit time when the stress approaches to the peak value strength and it will need more time and microcracks will gradually nucleate and link to large scale cracks. ZENG et al [17], LI et al [18] have studied b-value of AE events during the rock failure process. It suggested that b-value will decrease and reach its minimum value before rock failure that can reflect the evolutionary process from small scale cracks to large scale cracks. Although AE rate is decreasing during the plastic deformation stage, the fracture scale and released energy are increasing, which indicates that macroscopic failure generated. So, AE quiet period can be seen as a precursor characteristic of rock failure.

Fig. 7 Location result of AE events of PS1 specimen with different stress levels
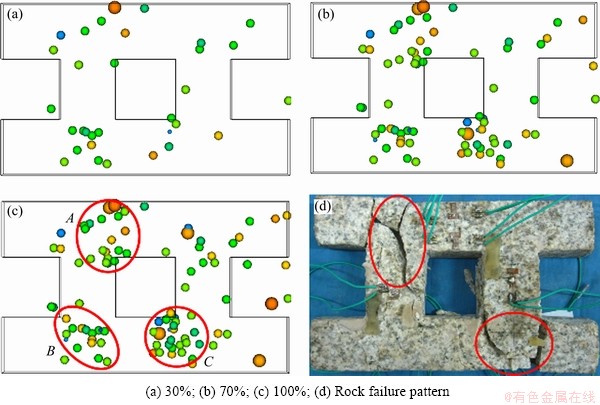
Fig. 8 Location result of AE events of PS2 specimen with different stress levels

Fig. 9 Relationship between stress��strain and AE rate
6 Conclusions
1) The akaike information criterion and Auto- Regression model were applied to determining AE waveform arrival time. Subsequently, an AE combined location algorithm was developed based on the Least square algorithm and Geiger location algorithm. The pencil break test results show that location error of 90% events is less than 10 mm and the error of 60% events is less than 6 mm, which indicates that location precision can meet the requirement of microcracks monitored by AE technique.
2) The 3D location of AE events can directly reflect the process of initiation, propagation and evolution of micro cracks. AE location result is associated with the rock failure area. The stress concentration occurred in the area between pillar and roof, where is identified as a danger zone of macroscopic failure, and can be used to monitor ground pressure in mine.
3) From the initial loading phase to elastic deformation phase, AE rate is much higher. When the rock reaches plastic deformation stage, AE events begin to decrease. The AE quiet period is typical characteristic for forecasting rock failure.
References
[1] LOCKNER D. The role of acoustic emission in the study of rock fracture [J]. International Journal of Rock Mechanics & Mining Sciences, 1993, 30(7): 883-899.
[2] KATSUYAMA K. Application of AE techniques [M]. FENG Xia-ting. Beijing: Metallurgy Industry Press, 1996. (in Chinese)
[3] MOGI K. Source location of elastic shocks in the fracturing process in rock [J]. Bull Earthq Res Inst Tokyo Univer, 1968, 46(4): 1103-1125.
[4] SCHOLZ C H. Experimental study of the fracturing process in brittle rock [J]. J Geophys Res, 1968, 73(4): 1447-1454.
[5] FEDOROV V V. Regression problems with controllable variables subject to error [J]. Biometrika, 1974, 61(1): 49-56.
[6] LIU Fu-tian. Simultaneous inversion of earthquake hypocenters and velocity structure (I): Theory and method [J]. Chinese Journal of Geophysics, 1984, 27(2): 167-175. (in Chinese)
[7] HU Xin-liang, MA Sheng-li, GAO Jing-chun, LIU Li-qiang, DIAO Gui-ling, SONG Fu-xi, LIU Sheng-guo. Location of acoustic emission in non-integral tock using relative location method [J]. Chinese Journal of Rock Mechanics and Engineering, 2004, 23(2): 277-283. (in Chinese)
[8] GEIGER L. Probability method for the determination of earthquake epicenters form the arrival time only [J]. Bulletin of Saint Louis University, 1912, 8: 60-71.
[9] LIN Feng, LI Shu-lin, XUE Yun-liang, XU Hong-bin. Microseismic sources location methods based on different initial values [J]. Chinese Journal of Rock Mechanics and Engineering, 2010, 29(5): 996-1002. (in Chinese)
[10] MELDER J A, MEAD R. A simplex method for function minimization [J]. The Computer Journal, 1965, 7(4): 308-313.
[11] ZHAO Xing-dong, LI Yuan-hui, LIU Jian-po, ZHANG Jian-yong, ZHU Wan-cheng. Study on rock failure process based on acoustic emission and its location technique [J]. Chinese Journal of Rock Mechanics and Engineering, 2008, 27(5): 990-995. (in Chinese)
[12] XU Jiang, LI Shu-chun, TANG Xiao-jun, TAO Yun-1i, JIANG Yong-dong. Influential factors of acoustic emission location experiment of rock under uniaxial compression [J]. Chinese Journal of Rock Mechanics and Engineering, 2008, 27(4): 765-772. (in Chinese)
[13] YUAN R F, LI Y H. Theoretical and experimental analysis on the mechanism of the Kaiser effect of acoustic emission in brittle rocks [J]. Journal of University of Science and Technology Beijing, 2008, 15(1): 1-4.
[14] CHANG S H, LEE C I. Estimation of cracking and damage mechanisms in rock under triaxial compression by moment tensor analysis of acoustic emission [J]. International Journal of Rock Mechanics & Mining Sciences, 2004, 41: 1069-1086.
[15] LI Y H, LIU J P, ZHAO X D, YANG Y J. Experimental studies of the change of spatial correlation length of acoustic emission events during rock fracture process [J]. International Journal of Rock Mechanics & Mining Sciences, 2010, 47: 1254-1262.
[16] LEI X L, TAKASHI S. Indicators of critical point behavior prior to rock failure inferred from pre-failure damage [J]. Tectonophysics, 2007, 431: 97-111.
[17] ZENG Zheng-wen, MA Jin, LIU Li-qiang, LIU Tian-chang. AE b-value dynamic features during rockmass fracturing and their significances [J]. Seismology and Geology, 1995, 17(1): 7-11. (in Chinese)
[18] LI Yuan-hui, LIU Jian-po, ZHAO Xing-dong, YANG Yu-jiang. Study on b-value and fractal dimension of acoustic emission during rock failure process [J]. Rock and Soil Mechanics, 2009, 30(9): 2559-2563. (in Chinese).
���������䶨λ�����Ŀ����ƻ�����ʵ���о�
�� ˧�������£������κ �������İأ�������
������ѧ �������ɽ��ȫ���ɽ������ص�ʵ���ң����� 110819
ժ Ҫ�������似�����о���ʯ�����ƻ������ù��ߡ�ͨ����������ƵIJ��������о��������Ƶ�ʱ���ݻ����ɽ����о�����Ǧ������������������Ļ�����С���˷���Geiger�㷨����������϶�λ�㷨�Ķ�λ�������ã���������ʯ�ƻ����������������Ҫ�������䶨λ���ֱ�۵ط�ӳ�����ڲ����Ƴ�ʼ����չ�Ŀռ�λ�ã������о���ʯ�ƻ�����������Ҫ���塣�����������£������붥�����λ�������ײ���Ӧ�����У�����������Ⱥ�������������ƻ�����������䶨λʱ��Ⱥ�������Ǻ����ã�˵�������붥�����λ�����ں���ƻ�������Σ����������ʯ�������Ա��νκ��������������½������֡�ƽ���ڡ���������Ϊ��ʯʧ���ƻ���ǰ��������
�ؼ��ʣ���ʯ�ƻ����ƣ������������ƻ�������ʱ���ݻ������ƣ������䣻��λ�㷨��ƽ����
(Edited by YANG Hua)
Foundation item: Projects (2013BAB02B01, 2013BAB02B03) supported by the Key Projects in the National Science & Technoogy Pillar Program During the Twelfth Five-Year Plan Period; Projects (51274055, 51204030, 51204031, 51109035) supported by the National Natural Science Foundation of China; Projects (N110301006, N110501001, N110401003) supportecd by the Fundamental Research Funds for the Central Unviersity, China
Corresponding author: LIU Jian-po; Tel: +86-13514265478; Fax: +86-24-83684690; E-mail: liujianpo@mail.neu.edu.cn
DOI: 10.1016/S1003-6326(11)61534-3
Abstract: Acoustic emission (AE) technique is a useful tool for investigating rock damage mechanism, and is used to study the temporal-spatial evolution process of microcracks during the similar pillar material experiment. A combined AE location algorithm was developed based on the Least square algorithm and Geiger location algorithm. The pencil break test results show that the location precision can meet the demand of microcrack monitoring. The 3D location of AE events can directly reflect the process of initiation, propagation and evolutionary of microcracks. During the loading process, stress is much likely concentrated on the area between pillar and roof of the specimen, where belongs to danger zone of macroscopic failure. When rock reaches its plastic deformation stage, AE events begin to decrease, which indicates that AE quiet period can be seen as precursor characteristic of rock failure.
