

J. Cent. South Univ. (2018) 25: 342-356
DOI: https://doi.org/10.1007/s11771-018-3741-8

Quadratic investigation of geochemical distribution by backward elimination approach at Glojeh epithermal Au(Ag)-polymetallic mineralization, NW Iran
Darabi-Golestan Farshad, Hezarkhani Ardeshir
Department of Mining and Metallurgical Engineering, Amirkabir University of Technology,424 Hafez Ave, Tehran, Iran
 Central South University Press and Springer-Verlag GmbH Germany, part of Springer Nature 2018
Abstract:
The correspondence analysis will describe elemental association accompanying an indicator samples. This analysis indicates strong mineralization of Ag, As, Pb, Te, Mo, Au, Zn and to a lesser extent S, W, Cu at Glojeh polymetallic mineralization, NW Iran. This work proposes a backward elimination approach (BEA) that quantitatively predicts the Au concentration from main effects (X), quadratic terms (X2) and the first order interaction (Xi��Xj) of Ag, Cu, Pb, and Zn by initialization, order reduction and validation of model. BEA is done based on the quadratic model (QM), and it was eliminated to reduced quadratic model (RQM) by removing insignificant predictors. During the QM optimization process, overall convergence trend of R2, R2(adj) and R2(pred) is obvious, corresponding to increase in the R2(pred) and decrease of R2. The RQM consisted of (threshold value, Cu, Ag��Cu, Pb��Zn, and Ag2�CPb2) and (Pb, Ag��Cu, Ag��Pb, Cu��Zn, Pb��Zn, and Ag2) as main predictors of optimized model according to 288 and 679 litho-samples in trenches and boreholes, respectively. Due to the strong genetic effects with Au mineralization, Pb, Ag2, and Ag��Pb are important predictors in boreholes RQM, while the threshold value is known as an important predictor in the trenches model. The RQMs R2(pred) equal 74.90% and 60.62% which are verified by R2 equal to 73.9% and 60.9% in the trenches and boreholes validation group, respectively.
Key words:
Cite this article as:
Darabi-Golestan Farshad, Hezarkhani Ardeshir. Quadratic investigation of geochemical distribution by backward elimination approach at Glojeh epithermal Au(Ag)-polymetallic mineralization, NW Iran [J]. Journal of Central South University, 2018, 25(2): 342�C356.
DOI:https://dx.doi.org/https://doi.org/10.1007/s11771-018-3741-81 Introduction
Regression models are used in geosciences to model natural processes of interest response variable [1�C3], either to extrapolate data to unsampled areas, or to identify significant predictors (i.e. covariates) of the response variable [4�C7]. Stepwise regression techniques were obtained using forward selection (by adding), backward elimination approach (BEA; by deleting), and stepwise methods (simultaneously adding and deleting the predictors) to evaluate a small subset of the predictors within the regression models [8�C11]. The BEA is often less adversely affected by correlations of predictors among these methods which has been used in various analysis [12�C14]. Therefore, it has been successfully applied to create polynomial models, accompanied by interactions of predictors.
A BEA was started by full quadratic model (QM) containing main effects or independent variables (X), quadratic terms (X2) and interaction (Xi��Xj) between variables [15, 16]. Several different criteria of R2, R2adjusted (adj), R2 predicted (pred), PRESS (prediction error sum of squares), F-value and P-value are relevant for decisions about the effect of the predictors on modeling and elimination process of insignificant predictors is continued frequently until the model is optimized [16�C19]. This process was done based on regression analysis (RA) and analysis of variance (ANOVA). Best-fit multiple linear regression models with the highest predictive ability were chosen not only as a result of the best subset procedure but also by multi- collinearity, autocorrelation, R2(adj) and R2(pred), standard error (SE) of models [20]. Accordingly, predictors with negligible effect in QM introduced by largest P-value (associated with t-statistic) and also could be deleted step-by-step at elimination and optimization process [16, 21].
The Glojeh ore deposit occurred in tarom�C hashtjin metallogenic province (THMP, NW Iran) and also classified in epithermal deposits but not classified definitely [22]. Moreover most observations may strengthen low sulfidation type of epithermal ore deposits. The mineral assemblages in these deposits include native elements (Au, Ag, Cu, As, S), sulfide minerals, sulfosalts, and tungstates as ore minerals, while quartz, adularia, carbonates, clay minerals, rhodonite and barite are considered as gangue minerals [23�C25]. Therefore, to determine the anomalous elements association and certain properties of mineralization, and also to identify interesting features in the multidimensional data set, the appropriate multivariate classification method is applied. Correspondence analysis (CA) is a statistical visualization method for picturing the associations between the levels of a two-way contingency table through extracting factors [26�C28]. CA method can describe variation of elements and involves mapping elements and samples as vectors, into a Euclidean factor space [29]. Therefore, anomalous element and indicator samples are determined with CA.
In the current study, with applying a theory of graphical presentation of CA factors we could enables to recognize and create an exploratory attitude with all elements (44 elements) at Glojeh deposit. All the other litho-geochemical samples were analyzed for Au and associated elements (Ag, Cu, Pb and Zn) which have been explored and recognized as polymetallic elements from earlier. Au and associated elements also require to different analysis, therefore modeling the Au (as response variable) according to associated elements will lead to decreases of the cost of analysis. We have tried to construct distinct geochemical exploration models for Au concentration related to vertical and horizontal variations and dispersion of elements in boreholes and trenches. Finally, validation process could confirm the performance of estimated models.
2 Geological setting
Subduction of the Paleo- and Neo-Tethys beneath the Eurasian and Iranian plates caused too much formation in Iran such as Urumieh-Dokhtar Zone and Alborz Magmatic Belt [30�C34]. Nearly at the Upper Permian�CLate Triassic during the closure of Paleo-Tethys in the north, continental rifting took place along the present Zagros thrust zone , due to opening a new ocean called Neo-Tethys [35, 36]. With the closure of Paleo-tethys, simultaneously a north-dipping subduction of Neo-Tethys started beneath the Eurasian Plate during Triassic�CJurassic time [32, 37]. This subduction has been lead toa tectonic changes between the Iranian block and the Arabian margin from passive margin to convergent tectonic [38]. This convergence tectonic was the cause of the Zagros orogenic belt in Iran [39]. There is a considerable debate regarding to the detailed history of Neo-Tethys basin opening and closure in Iran [40], but evidence regarding several ophiolite belts across the country suggests that several small basins existed in addition to the main Neo-Tethys ocean. They was finally eliminated by collision between Iran and Arabia along the Zagros suture zone in the Neogene [32, 41].
THMP is a part of western Alborz (Alborz- Azarbayjan magmatic belt [42�C44]. GHORBANI [45] believes that, at least in Tertiary times, due to the mode of mineralization processes and metamorphism, there are fundamental differences between THMP and Alborz magmatic belt. The THMP covers an area from west of Taleghan to north-northwest of Mianeh. It is limited by Talesh Mountains and the Manjil depression to the north and the Alborz-Zanjan-Mianeh axis to the south (Figure 1) [45, 46]. The various survey results from structural zones reveal that the Tarom- Hashtjin volcanic and plutonic began to start activities in Late Cretaceous and continued into Quaternary, while peaked at Eocene. There are several mineralization of epithermal deposit in the Tarom region, which all of them are associated with Eocene andesites (extrusive ) and tonalites and granites (intrusive ) rock bodies and show high copper anomalies [45, 47]. Extending from the north to the southeast of Zanjan and covering parts of western Alborz structural zone, the THMP contains various vein and veinlet Au mineralization with Pb, Zn, Cu, and occasionally Ag especially in Eocene volcanics (across Tertiary ). Glojeh ore mineralization has occurred in THMP and classified in epithermal deposits.

Figure 1 Geological map of THMP and distribution of major epithermal ore deposits, Glojeh ore deposit located in mid of THMP
3 Materials and methods
3.1 Geology of Glojeh deposit
Glojeh district is situated approximately 30 km (18.6 miles) north of Zanjan town, and is located in THMP. The Glojeh deposit Outcrops, consist of lithic tuff with andesite interbeded, rhyodacite with tuff interbeded, and lithic tuffs from oldest to youngest, whatever the mineralization is mainly hosted by rhyodacite (Figure 2). Rhyodacite is widespread in east of area, with black gray in altered surface and light gray in fresh surface [22]. Hydrothermal alteration zones have well-developed and zoned around veins and extends about 30 m into the host rocks. This alteration laterally varies from silicic zone, low-intermediate intensity quartz- sericite-pyrite (QSP), an argillic zones, and a propylitic zone.
A lot of studies have not yet been established in Glojeh deposit, but also offered 4 stages in this deposit; stages 1 and 2 most affected high- sulfidation, stage 3 also affected intermediate sulfidation and stage 4 also show features of low sulfidation type of epithermal ore deposits [43]. At the first stage, a vuggy and massive silica body consist of Cu�CAs�CAu�CSb�CFe, while euhedral pyrite, magnetite, and quartz are abundant. The second stage (main target) intruded breccias and indicated As�CSb�CFe�CCu�CS assemblages. The main veins of the polymetallic deposit are characterized at the third stage, which highly concentrated from Pb�CZn�CCu�CAg elements and accompanied by immediate host rock alterations. The last stage shows Fe-richs (mainly hematite and goethite), precious minerals, sulfosalts and Ag-Au-Pb-S-Bi association. There are two main veins (No. 1 and No. 2), and several veinlet, which strike E-W and generally dip steeply to the west in Glojeh (Figure 2). Main stage is characterized by bornite associated with chalcocite occurs mostly as fracture fillings within chalcopyrite grains or generally Pb-Zn (Cu��Ag) sulfides mineralization. This is confirmed by genetic relationship between Cu, Te, Tl, Hg, Sb, As, Ag, Au, Zn, Pb elements. The late stage is characterized by oxidation and deposition of precious metals in quartz vein in association with dark hematite-goethite as vugs infilling (open space filling texture). In a similar deposit (Limarinho gold deposit at northern Portugal), Fuertes-Fuente et al [48] proposed that the Au�C(��Cu)�CAs�CAg�CPb�C S�CTe paragenesis formed after a fragile deformation stage that produced the notable micro-fracturing of the arsenopyrite. The micro-fractures enabled the Pb�CAg rich hydrothermal fluid flow and a more efficient interaction between this fluid and the previous Au�CBi�CTe��S paragenesis enclosed by arsenopyrite. Finally, it causes situation of gold remobilization. This process was suggested for Glojeh hydrothermally deposit by MEHRABI et al [43].
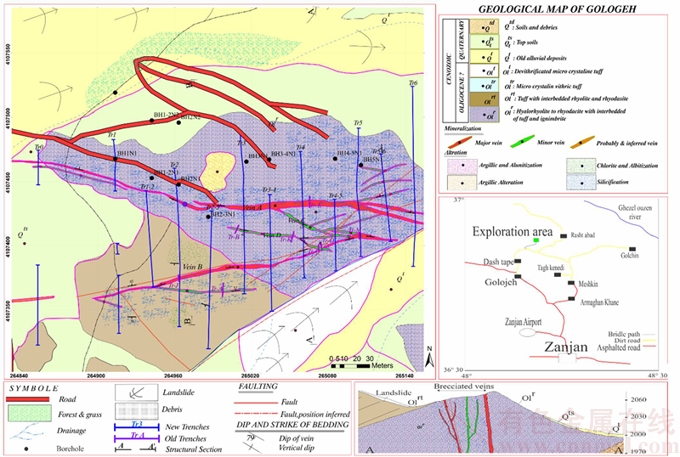
Figure 2 Geological map of Glojeh deposit
3.2 Trench and borehole sampling
According to preliminary program of rock chip-channel sampling of trenches, a total of 288 samples were taken for analysis from ore veins and shear zones, adjacent host rocks and waste host rock by 1, 1.5 and 5 m intervals, respectively. Sampling intervals were determined based on changes of lithology, alterations, the intensity of silicification, the amount of oxide and hydroxide iron, malachite and presence or absence of sulfide mineralization. Alteration of hematite-limonite in trench 1 (TR1), hematite-argillic in the trenches 2, 3, 5 (TR2, TR3 and TR5), silicic and hematite in trench 4 (TR4) and in the trench number 6 (TR6) just can be seen limonite alteration. Tuff and rhyolite and andesite, Tuff-rhyolite and rhyodacite, Tuff-rhyolite and rhyodacite to latite were the host rock of TR1, TR2 (Figure 3) and TR3 respectively, while TR4, TR5 and TR6 were excavated in rhyodacite to latite rocks. The cross section map of wall and bottom of TR2 show a brecciated zone in 110�C115 m that concludes a vein mineralization (Figure 3). This brecciated zone covers six samples (from S115 to S120) and rock type varies from green, green to pink and pink altered andesite to rhyodacite with vein and veinlet, open space filling and disseminated texture. Galena, sphalerite, chalcopyrite and pyrite association often occur in veins and veinlets (Table 1). Besides, a geologically constrained data set include 679 samples and collected from 1503.24 m of boreholes consist of BH1N1, BH1N2, BH1-2N1, BH1-2N2, BH2N1, BH2N2, BH2-3N1, BH3N1, BH3-4N1, BH4-5N1 and BpN1 (Figure 2).
All the litho-geochemical samples were analyzed for Au, Ag, Cu, Pb and Zn, which have been explored and recognized as polymetallic elements. Only 153 samples of BH2N1 were analyzed by inductively coupled plasma mass spectrometry (ICP-MS) for 44 elements. Fire assay is the stalwart among analytical methods for Au analysis [49, 50]. Therefore, other samples were analyzed for Au by fire-assay technique at Zarkavan Lab, and also associated Ag, Cu, Pb, Zn elements by atomic absorption spectrophotometry (AAS) at Earth sciences development company Lab of Iran. In this study, we have tried to estimate and identify the Au concentration by associated elements. With this aim, the relationship between these variables has been investigated and consequently the constructed models can be considered as an indicator in geochemical exploration. Otherwise, validation process confirms the performance of estimated model and it can lead to decreases of the cost of analysis. In each trench and borehole, two samples have been devoted to the training data and one sample for validate data, respectively (ratio sample of 2: 1).

Figure 3 Cross section map of wall and bottom of trench No. 2 from 100�C127 m
Table 1 Rock type, texture and minerals occurrence in trench No.2

The Au, Ag, and Cu show skewed lognormal distribution, which illustrates how the log-normal distributions are widespread through the deposit. Concentration of elements Co, Cu, Cr, 226Ra, Au, and U in Geology also show lognormal distribution [51]. By plotting of frequency histograms and cumulative probability plots for Au, Ag and Cu confirmed the log normal nature of the distribution and indicated the presence of at least two distinct log-normal populations at Glojeh deposit (Figure 4). Afterward, normalization was done for better performance in correspondence analysis and BEA.
3.3 Correspondence analysis (CA)
CA provides an intuitive graphical display of element association in one or two dimensional visual representation [52, 53]. CA can be applied to investigating the nature of element association through extracting factors [26, 27, 54]. The purpose of this method is to reproduce the distances between the row and/or column points in a two-way table in a lower dimensional display. In CA, the actual rotational orientation of the axes was arbitrarily chosen which provides successive dimensions with less and less of the overall Chi-square (x2) value [52, 55]. CA involves mapping a x2 distance defined on profiles of contingency table row vectors, and column vectors, into a Euclidean factor space [29].
3.4 Backward elimination (BE)
Model selection algorithm starts with taking all the predictors, and then continues by pruning the insignificant variables to finally arrive at a model which has an optimum dimension [2, 7, 12]. The suggested approach was implemented through the following steps: model initialization and learning, model order reduction and denoting the validated model. A BE procedure was pursued and started by full statistical model or quadratic model (QM) containing main effects (X), quadratic terms (X2) and the first order interaction (Xi��Xj) of variables [16, 56]. After different steps of elimination and removing insignificant predictors from QM, the reduced quadratic model (RQM) have constructed based on RA and ANOVA. This improvement has done by considering different R2, R2(adj), R2(pred), PRESS and F-ratio indices.
The RA could generate an equation to describe the statistical relationship between one or more predictors and the response variable. Besides, it can be applied to predicting new observations [14, 16]. R2 indicates how well the model has been fitted to the data. However, it always tends to increase as additional predictors are included as well as adding a new term to the model. To deal with this drawback, R2(adj) is used. The adjusted R2 will increase as long as the new term improves the model [10]. When models are compared with their complexity, they should be relied on R2(adj). While, R2(pred) is calculated by observations which have not included in the estimated model and it calculated from the PRESS (prediction error sum of squares) statistic. Hence, R2(pred) indicates how well the model has predicted responses for new observations [10, 20]. Accordingly, it could prevent overestimating the theoretical model and it may be more useful than R2(adj) for comparing models.

Figure 4 Log-scaled cumulative probability plots for gold distribution in soil
The main output from ANOVA was used to compare the equations and it indicates important characters and predictors that related to main element (Au in this research) to establish an appropriate model. The df means degrees of freedom from each source, SS indicates sum of squares between groups (factors) and the sum of squares within groups (error). As well as mean squares (MS) value are found by dividing the sum of squares by the df. Another index to compare equations is F-ratio which calculated by dividing the MS regression to the MS error. Whereas F-ratio increased, it is led to model improvement. P-value is applied to determining whether a factor is significant. It should be noticed that the F-ratio factor is significant as long as the p-value is lower than 0.05. By removing specific predictors which have largest p-value at each steps from process, the R2 value decreases whereas R2(pred) must be increased. In model optimization process R2, R2(adj), and R2(pred) show convergence trend. This process (removes meaningless predictor) is repeated while R2(pred) increased or in the absence of R2(pred), if PRESS is decreased. Step by step, the full regression equation (QM) is replaced by new equation with less predictor, until the RQM has created.
4 Results
4.1 CA
Totally, the first, second and third mineralization factors represent 65%, 12% and 7% of total inertia and variation in Glojeh district. The first mineralization factor which was also the strongest and the most significant association, indicates Au, Ag, As, Pb, Te, Mo, Zn and to some extent S, W, Cu elements. This factor indicates that Au was usually associated with Ag because they have similar behaviors in hydrothermal processes. On the other hand, the second factor of mineralization (explains 12% of total variation) proposes Au and Ag occurrence in area highlighted by indicator sample numbers of 79, 15, 34, 32 and 80. The sample numbers 79, 15, and 80 rather enriched from Au and also Au tends to be associated with Ca, Sb and As, while Ag shows enrichment in sample IDs of 34 and 32 and it is associated with Zn, Mo, Pb and S. Samples and variables are displayed jointly on the same graphical CA defined by the first and the second factor in Figure 5. This graph representing more than 77.11% of the total information included in the analyzed data table at Glojeh deposit.
By producing two dual displays of factors, there is very high eccentricity between samples and elements (according to related eigenvalues and eigenvectors in CA process). Accordingly, it is concluded that Ag, Au, As, Pb, Te, Mo, Zn and rather S, W and Cu are also more considerable for mineralization in Glojeh deposit. It has been revealed by indicator sample IDs of 34, 32, 27, 28, 31, 33, 30, 29, 35 and 80 which were shown in Figure 6. The existence of mentioned elements suggests a polymetallic deposit with the dominant enrichments of Au, Ag, As and Pb. Thus, Glojeh deposit can be determined as a vein-style Au(Ag)- polymetallic mineralization.
4.2 BE modeling for trenches
A total of 2688 (192 samples��14 predictors) element concentration data utilized in the model development and also 96 samples (One-third of all samples) used for model validation in trenches. A full QM including independent variables or associated elements (Ag, Cu, Pb, Zn), quadratic terms (Ag2, Cu2, Pb2 and Zn2) and interaction between variables (Ag��Cu, Ag��Pb, Ag��Zn, Cu��Pb, Cu��Zn, Pb��Zn) was created at first step of trench data analysis. R2, R2(adj), R2(pred) in full QM equal 77.4%, 75.6% and 72.81% respectively. In this research, the best convergence for different R achieved by the process of optimization in all steps. After 6 steps of elimination, the RQM is calculated with R2(pred) equal to 74.90% and the PRESS index shows the minimum value of 47.312 (Table 2 and Figure 6). While, in this critical step F-value continue increasing by removing constant (C called as threshold or constant value in equation), but ignored because related P-value is very low and decreasing trend of PRESS was collapsed (Table 2). Therefore, 6th step known as optimum equation according to criterion-based methods and concluded by removing (Zn, Ag��Pb), (Zn2, Ag��Zn), (Cu2, Pb), (Ag, Cu��Zn) and (Cu��Pb) from QM respectively and leads to create RQM. The RQM that created by elimination procedure has been expressed as Eq. (1):

 (1)
(1)
As observed in regression analysis, the dF value equal to 5 appears according to five Cu, Ag��Cu, Pb��Zn, Ag2 and Pb2 predictors in the equation. ��k coefficients and standard errors (SE Coef.) have been made by sample covariances that can be calculated via the COVAR function (Table 3). All predictors in the optimal model have at least 95% confidence interval (P value equal to 0.05) and show  Related t-value of each predictor indirectly depends on dF and is not calculated just for one variable according to Eq. (1). If the threshold value is considered, the dF of residual error was calculated from n�Ck�C1 (n=192, k=5 and 1=C) which was equal to 186. In the last step, constant value is eliminated, regression, residual error and total dF are equal to 5, 187 and 192, respectively (Table 2).

Figure 5 Correspondence analysis and important mineralization factors in borehole BH2N1
This model (RQM) was created from the training group and must confirm with validation group (96 samples). QM and RQM for training group respectively indicate that R2 equal 77.4% and 76.4% (Figure 6). The RQM was very well satisfied, because additional 9 predictors were eliminated and predictive ability has been increased from 72.81% to 74.9%, after 6 steps (Table 2). In addition, estimated RQM was evaluated in the validation group and show correlation of 73.9% (Figure 7), just 1% lower than expected value with modeling.
Table 2 Regression analyses and analyses of variance for BEA of trenches in Glojeh deposit

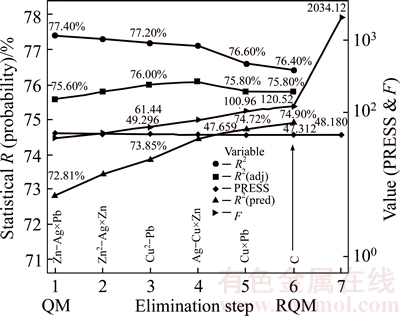
Figure 6 Graphical comparison of R2, R2(adj), R2(pred) showing convergence in order to improve model (PRESS and F-value confirm this trend in 7 steps)
Table 3 t- and P-values of predictors in RCM of trench (step 6)

The graphical comparisons of predicted and actual gold values for the data set (training group) used to develop the model was indicated in Figure 7(a) by 192 samples, and also for predicted and actual gold values for validation group have been shown in Figure 8(b) by 96 samples.
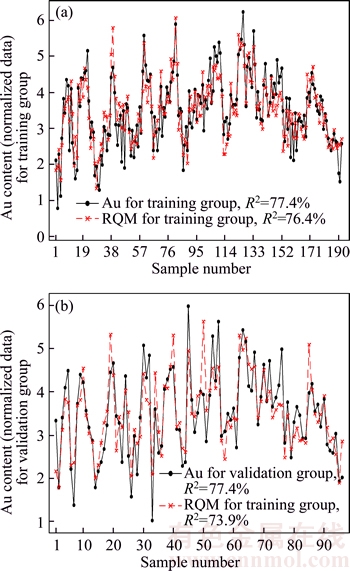
Figure 7 Graphical comparison of predicted and actual gold values for training group (a) and validation group (b)
4.3 BE modeling for boreholes
The authors also conducted another extensive survey on boreholes, same as trench modeling process. The model was created with training group comprised of 6342 element concentration data (453 samples��14 predictors) and validated with other 3164 geologically element concentration data points (226��14) obtained from the nine drill holes. The parameters of R2, R2(adj), and R2(pred) in the QM equal 62.7%, 61.5% and 58.16% respectively. The QM was constructed as Eq.(2):
QM(Au)=�C0.126+0.014Ag+0.276Cu+0.592Pb+
0.284Zn+0.106Ag��Cu�C0.340Ag��Pb+
0.0388Ag��Zn�C0.033Cu��Pb�C0.0914Cu��
Zn+0.229Pb��Zn+0.163Ag2�C0.0289Cu2+
0.0168Pb2�C0.0992Zn2 (2)
The elimination of invaluable predictors gave rise to decrease of the R2 value to less than 62.2%, while R2(pred) increased to over 60.62% in 10 steps (Table 4 and Figure 8). Implementations were completed at step 8 as soon as the process showed high convergence for R2, R2(adj) and R2(pred). The predictors of Ag, Cu��Pb and Pb2, Ag��Zn, Cu2, Cu, Zn, Zn2 were eliminated from QM in 8 steps. In 9th step, since the R2(pred) has decreased from 60.62% to 60.26%, it was not acceptable to remove threshold value and Ag��Cu predictors. We compare the various p-values of threshold (0.368) and Ag��Cu predictor (0.017) and it was revealed that just the threshold value must be eliminated. Therefore, a better response was constructed and F-ratio increased several times from 122.1 to 2552.11 in 10th step through removing the threshold value. Interestingly, R2(pred) cannot be estimated without a constant value (Table 4 and Figure 8). Finally, the RQM was defined by the Eq. (3) with R2(pred) higher than 60.62%:
RQM(Au)=1.06Pb+0.0995Ag��Cu�C0.377Ag��Pb�C0.0985Cu��Zn+0.145Pb��Zn+0.209Ag2 (3)
Therefore step 10 was known as an optimum equation according to the different indices. In this process, dF is decreased from 14 to 6 for 453 samples (Table 4). The six important predictors were Pb, Ag��Cu, Ag��Pb, Cu��Zn, Pb��Zn and Ag2, also t and p-values are calculated from related coefficients and standard errors (Table 5). The RQM must be validated via validation group samples. The validation group showed a correlation of more than 60.2% for RQM and it was more satisfactory for predicted value by hold-out data (Figure 8 and Table 4 at 8th step).
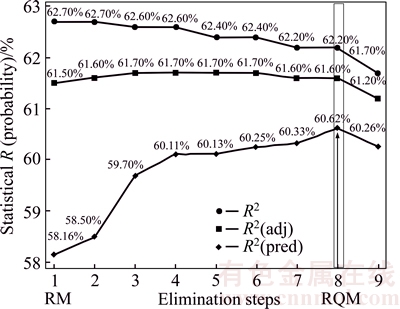
Figure 8 Graphical comparison of R2, R2(adj), R2(pred) showing convergence to improved the model (PRESS and F-value confirm this trend in 10 steps)
Table 4 Regression analyses and analyses of variance for BEA of boreholes in Glojeh deposit
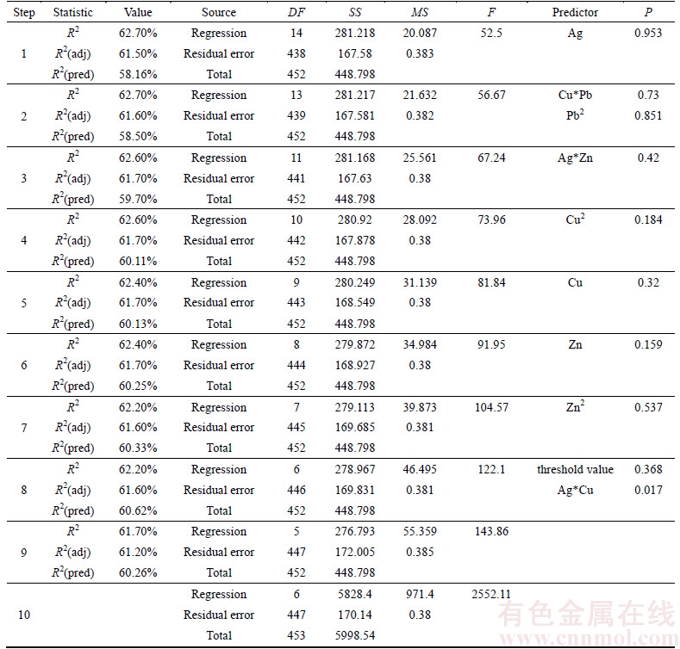
Table 5 t- and p-value of predictors in RCM of boreholes (step 10)

5 Discussion
In this work, Au mineralization was partly modeled by Ag, Cu, Pb and Zn according to distinctive processes on trenches and boreholes. By application interaction effects of variables as new predictors could improve modeling accuracy. All the predictors were modeled based on regression analysis and analysis of variance with applying different R��s and F-ratio criteria. We also propose an approach called BM for iterative model selection from QM to RQM. A set of predictors was used on the each iteration, to identify and eliminate latent variables in related QM equations. Iteration processes of constructing RQM was going forward in order to increase the model predictive ability of R2(pred). The p-value equal to or lower than 0.05 at RQM implies that the minimum confidence interval of each predictor was higher than 95%, therefore, all predictors have high overlap on Au variation in mineralization. All significant predictors were presented in the RQM for trenches and boreholes showed t-value=|��k/SEk|��1.96 which demonstrated in Figure 9. This t-value was established for a variable related to the model by contributing other variables and it was not calculated based on only one variable.
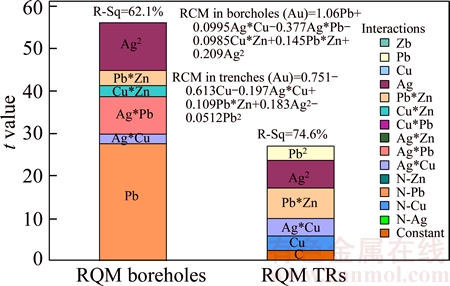
Figure 9 Graphical comparison of t-value in trenches and boreholes for RQM
Pb as an important predictor (t-value=27.5) had a critical role in RQM of boreholes. After Pb, also Ag2 and Ag��Pb were considered as important predictors in modeling, and they indicates direct relationship with Au variation and mineralization in boreholes. In other words, nearly 85% (47.57/56.1= 84.8%) of the total t-values are explained by Pb and Ag (Table 5). They contribute in Pb��Zn and Ag��Cu predictors, therefore the total t-value close to 51 from 56.1 (91 percent of total t-value) directly related to specific parameters of Pb and Ag.
Comparing to boreholes analysis, no strong genetic influences can be detected in trenches. Pb��Zn, Ag2, Pb2, Ag��Cu and Cu predictors show highest genetic relationship with Au mineralization and variation (Figure 9). The threshold value was known as an important predictor in RQM based on horizon dispersion of Au at trenches (Table 2, Figure 9). The threshold value can be obtained due to lateral variation of samples from shear zones and veins.
Each RQM contains Ag��Cu, Pb��Zn and Ag2 predictors. According RQM for training data in boreholes and trenches, R2 is equal to 62.2% and 76.4% and R2(pred) were close to 61% and 75%, respectively. They were confirmed with validated data by R2 equal to 60.9% and 73.9%. Correlation between RQM predicted and actual Au values for training group was very good because it was calculated only dependent on Ag, Cu, Pb and Zn concentrations. As we know, physical and chemical condition of hydrothermal fluids is influenced by numerous different factors such as geology, pressure and temperature, hydrology, chemistry of mineralizing fluids and permeability could control mineralization. The result was also validated in independent hold-out data with strongest correlation comparison of training data. It led to confirm accuracy and precision of RQM models in boreholes and trenches. Therefore, exploration analysis obviously will be more cost effective using model compared to fire-assay analysis of Au for further drilling in Glojeh.
6 Conclusions
The results obtained by the BM reduction procedure leads to recognition of variables that genetically related to mineralization at boreholes and trenches (vertical and horizontal Au dispersion). The modeling approach can be useful, where there are not sufficient data due to under-sampling or missing information, especially in primary phases of exploration. Major variation and mineralization factors were determined by CA method. It indicated that Ag, Au, As, Pb, Te, Mo, Zn and rather S, W and Cu were also more considerable for mineralization in Glojeh deposit. Also numbers of 34, 32, 27, 28, 31, 33, 30, 29, 35 and 80 observations are determined as indicator samples. Therefore, Glojeh deposit may be determined as a vein-style Au(Ag)- polymetallic mineralization.
Different controlling indices such as t-value (based on coefficients in model and standard errors), an index for the goodness of fit (R2(adj)), and predictive power based on leave-one-out cross- validation (R2(pred)) and F-ratio led to assign the best modeling with confidence interval of each predictor higher than 95%. In this research, interaction effects of Ag��Pb, Pb��Zn, Ag��Cu, Pb2, and Ag2 have a great importance for better modeling of Au variation. The new introduced variables led to more accurate model since the elements interacting which each other in the process of mineralization and ore formation. Pb, Ag2 and Ag��Pb were considered as an important predictors which have a critical role in RQM for boreholes. Therefore, approximately 85% of the total t-values in RQM were covered by Pb, Ag2 and Ag��Pb. Therefore, Au variation and mineralization in boreholes showed a direct relationship with Pb and Ag. Threshold value has been identified as an important predictor in RQM in trenches. It would be created due to lateral interval of samples from shear zone and veins. Evaluation using hold-out data or cross-validation indicates that exploration analysis obviously will be more cost effective using constructed model, compared to fire-assay analysis for Au concentration for further drilling in Glojeh deposit.
Acknowledgements
We would also like to thank Mr. Fattahi and Mr. Hemmati for their help in organizing this data. Finally, and more formally, we would like to acknowledge the support of the IMIDRO (Iranian Mines and Mining Industries Development & Renovation Organization) for our research.
References
[1] BORRADAILE G J. Statistics of earth science data: Their distribution in time, space and orientation [M]. Berlin: Springer Science & Business Media, 2013.
[2] GRAHAM M W, MILLER D J. Unsupervised learning of parsimonious mixtures on large spaces with integrated feature and component selection [J]. IEEE Transactions on Signal Processing, 2006, 54: 1289�C1303.
[3] SEN Z. Spatial modeling principles in earth sciences [M]. Berlin: Springer Science & Business Media, 2009.
[4] ABDUL-WAHAB S A, BAKHEIT C S, AL-ALAWI S M. Principal component and multiple regression analysis in modelling of ground-level ozone and factors affecting its concentrations [J]. Environmental Modelling & Software. 2005, 20: 1263�C1271.
[5] HESSAMI M, GACHON P, OUARDA T B, ST-HILAIRE A. Automated regression-based statistical downscaling tool [J]. Environmental Modelling & Software, 2008, 23: 813�C834.
[6] LI S, ZHAO Z, MIAOMIAO X, WANG Y. Investigating spatial non-stationary and scale-dependent relationships between urban surface temperature and environmental factors using geographically weighted regression [J]. Environmental Modelling & Software, 2010, 25: 1789�C1800.
[7] MILLER D J, BROWNING J. A mixture model and EM-based algorithm for class discovery, robust classification, and outlier rejection in mixed labeled/unlabeled data sets [J]. IEEE Transactions on Pattern Analysis and Machine Intelligence, 2003, 25: 1468�C1483.
[8] CHUN Y, GRIFFITH D A, LEE M, SINHA P. Eigenvector selection with stepwise regression techniques to construct eigenvector spatial filters [J]. Journal of Geographical Systems, 2016, 18: 67�C85.
[9] CORDELL H J, CLAYTON D G. A unified stepwise regression procedure for evaluating the relative effects of polymorphisms within a gene using case/control or family data: Application to HLA in type 1 diabetes [J]. The American Journal of Human Genetics, 2002, 70: 124�C141.
[10] GRANIAN H, TABATABAEI S H, ASADI H H, CARRANZA E J M. Multivariate regression analysis of lithogeochemical data to model subsurface mineralization: A case study from the Sari Gunay epithermal gold deposit, NW Iran [J]. Journal of Geochemical Exploration, 2015, 148: 249�C258.
[11] PASANDIDEH S H R, NIAKI S T A, FAR M H. Optimization of vendor managed inventory of multiproduct EPQ model with multiple constraints using genetic algorithm [J]. The International Journal of Advanced Manufacturing Technology, 2014, 71: 365�C376.
[12] AZADI T E, ALMASGANJ F. Using backward elimination with a new model order reduction algorithm to select best double mixture model for document clustering [J]. Expert Systems with Applications, 2009, 36: 10485�C10493.
[13] FIGUEIREDO M A T, JAIN A K. Unsupervised learning of finite mixture models [J]. IEEE Transactions on Pattern Analysis and Machine Intelligence, 2002, 24: 381�C396.
[14] MYERS R H, MONTGOMERY D C, ANDERSON-COOk C M. Response surface methodology: Process and product optimization using designed experiments [M]. Hoboken, NJ: John Wiley & Sons, 2016.
[15] MOHAMMADI R, MOHAMMADIFAR M A, MORTAZAVIAN A M, ROUHI M, GHASEMI J B, DELSHADIAN Z. Extraction optimization of pepsin-soluble collagen from eggshell membrane by response surface methodology (RSM) [J]. Food Chemistry, 2016, 190: 186�C193.
[16] SAMAL A R, MOHANTY M K, FIFAREK R H. Backward elimination procedure for a predictive model of gold concentration [J]. Journal of Geochemical Exploration, 2008, 97: 69�C82.
[17] FAHRMEIR L, KNEIB T, LANG S, MARX B. Regression: Models, methods and applications [M]. Berlin: Springer Science & Business Media, 2013.
[18] GRANIAN H, TABATABAEI S H, ASADI H H, CARRANZA E J M. Application of discriminant analysis and support vector machine in mapping gold potential areas for further drilling in the Sari-Gunay Gold Deposit, NW Iran [J]. Natural Resources Research, 2016, 25: 145�C159.
[19] YADAV V, MUELLER K L, MICHALAK A M. A backward elimination discrete optimization algorithm for model selection in spatio-temporal regression models [J]. Environmental Modelling & Software, 2013, 42: 88�C98.
[20] EVRENDILEK G A, AVSAR Y K, EVRENDILEK F. Modelling stochastic variability and uncertainty in aroma active compounds of PEF-treated peach nectar as a function of physical and sensory properties, and treatment time [J]. Food Chemistry, 2016, 190: 634�C642.
[21] PARDOE I. Applied regression modeling: A business approach [M]. Hoboken, NJ: John Wiley & Sons, 2012.
[22] MEHRABI B, SIANI M G, AZIZI H. The genesis of the epithermal gold mineralization at North Glojeh veins, NW Iran [J]. IJSAR, 2014, 15: 479�C497.
[23] CHINNASAMY S S, UKEN R, REINHARDT J, SELBY D, JOHNSON S. Pressure, temperature, and timing of mineralization of the sedimentary rock-hosted orogenic gold deposit at Klipwal, southeastern Kaapvaal Craton, South Africa [J]. Mineralium Deposita, 2015, 50: 739�C766.
[24] GRANCEA L, BAILLY L, LEROY J, BANKS D, MARCOUX E, MILESI J, CUNEY M, ANDRE A, ISTVAN D, FABRE C. Fluid evolution in the Baia Mare epithermal gold/polymetallic district, Inner Carpathians, Romania [J]. Mineralium Deposita, 2002, 37: 630�C647.
[25] MARTINZ-ABAD I, CEPEDAL A, ARIAS D, FUERTES- FUENTE M. The Au�CAs (Ag�CPb�CZn�CCu�CSb) vein- disseminated deposit of Arcos (Lugo, NW Spain): Mineral paragenesis, hydrothermal alteration and implications in invisible gold deposition [J]. Journal of Geochemical Exploration, 2015, 151: 1�C16.
[26] ABDI H, WILLIAMS L J, VALENTIN D. Multiple factor analysis: Principal component analysis for multi-table and multi-block data sets [J]. Computational Statistics, 2013, 5: 149�C179.
[27] GOLESTAN F D, HEZARKHANI A, ZARE M. Interpretation of the sources of radioactive elements and relationship between them by using multivariate analyses in anzali wetland area [J]. Geoinformatics & Geostatistics: An Overview, 2013, 1(4): 1�C10.
[28] ROSHANI P, MOKHTARI A R, TABATABAIE S H. Objective based geochemical anomaly detection�� application of discriminant function analysis in anomaly delineation in the Kuh Panj porphyry Cu mineralization (Iran) [J]. Journal of Geochemical Exploration, 2013, 130: 65�C73.
[29] DIDAY E, NOIRHOMME-FRAITURE M. Symbolic data analysis and the SODAS software [M]. Hoboken, NJ: Wiley Online Library, 2008.
[30] GLENNIE KW. Cretaceous tectonic evolution of Arabia's eastern plate margin: a tale of two oceans [M]// Middle East models of Jurassic/Cretaceous carbonate systems. SEPM (Society for Sedimentary Geology),Spec. Publ. 2000, 69: 9�C20.
[31] MOHAJJEL M, FERGUSSON C. Jurassic to Cenozoic tectonics of the Zagros Orogen in northwestern Iran [J]. International Geology Review, 2014, 56: 263�C287.
[32] RICHARDS J P. Tectonic, magmatic, and metallogenic evolution of the Tethyan orogen: From subduction to collision [J]. Ore Geology Reviews, 2015, 70: 323�C345.
[33] VERDEL C, WERNICKE B P, HASSANZADEH J, GUEST B. A Paleogene extensional arc flare-up in Iran [J]. Tectonics, 2011, 30: TC3008.
[34] YANG Z, HOU Z, WHITE N C, CHANG Z, LI Z, SONG Y. Geology of the post-collisional porphyry copper�C molybdenum deposit at Qulong, Tibet [J]. Ore Geology Reviews, 2009, 36: 133�C159.
[35] AGARD P, OMRANI J, JOLIVET L, MOUTHEREAU F. Convergence history across Zagros (Iran): Constraints from collisional and earlier deformation [J]. International Journal of Earth Sciences, 2005, 94: 401�C419.
[36] AZIZI H, ASAHARA Y, MEHRABI B, CHUNG S L. Geochronological and geochemical constraints on the petrogenesis of high-K granite from the Suffi abad area, Sanandaj-Sirjan Zone, NW Iran [J]. Chemie der Erde-Geochemistry, 2011, 71: 363�C376.
[37] ALIANI F, MAANIJOU M, SABOURI Z, SEPAHI A A. Petrology, geochemistry and geotectonic environment of the Alvand Intrusive Complex, Hamedan, Iran [J]. Chemie der Erde-Geochemistry, 2012, 72: 363�C383.
[38] GOLONKA J. Plate tectonic evolution of the southern margin of Eurasia in the Mesozoic and Cenozoic [J]. Tectonophysics, 2004, 381: 235�C373.
[39] SARKARINEJAD K. The role of the zagros suture on three dimensional deformation pattern in eghlid-deh bid area of Iran [J]. Journal of Sciences, Islamic Republic of Iran, 2010, 21(2): 155�C167.
[40] GHASEMI A, TALBOT C. A new tectonic scenario for the Sanandaj�CSirjan Zone (Iran) [J]. Journal of Asian Earth Sciences, 2006, 26: 683�C693.
[41] DARABI-GOLESTAN F, GHAVAMI-RIABI R, KHALOKAKAIE R, ASADI-HARONI H, SEYEDRAHIMI-NYARAGH M. Interpretation of lithogeochemical and geophysical data to identify the buried mineralized area in Cu-Au porphyry of Dalli-Northern Hill [J]. Arabian Journal of Geosciences, 2013, 6: 4499�C4509.
[42] EFTEKHAR-NEZHAD J N M, VALEH N. Geology of Tarom-Talesh area [R]. Geological Survey of Iran. Note No.16 with Map 1:100 u, 1965: 1�C29.
[43] MEHRABI B, SIANI M G, GOLDFARB R, AZIZI H, GANEROD M, MARSH E E. Mineral assemblages, fluid evolution, and genesis of polymetallic epithermal veins, Glojeh district, NW Iran [J]. Ore Geology Reviews, 2016, 78: 41�C57.
[44] NABAVI M. An introduction to the geology of Iran [R]. Geological survey of Iran, 1976: 110.
[45] GHORBANI M. The economic geology of Iran: mineral deposits and natural resources [M]. Berlin: Springer Science & Business Media, 2013.
[46] BAHAJROY M, TAKI S. Study of the mineralization potential of the intrusives around Valis (Tarom-Iran) [J]. Earth Sciences Research Journal, 2014, 18: 123�C129.
[47] GHORBANI M. Alborz zone or Alborz geology state and its mineralization potential [C]// 1st Conference of Alborz and Caspian Sea Marginal Regions Earth Sciences, Tehran, Iran 2005.
[48] FUERTES-FUENTE M, CEPEDAL A, LIMA A, DORIA A, dos ANJOS RIBEIRO M, GUEDES A. The Au-bearing vein system of the Limarinho deposit (northern Portugal): Genetic constraints from Bi-chalcogenides and Bi�CPb�CAg sulfosalts, fluid inclusions and stable isotopes [J]. Ore Geology Reviews, 2016, 72: 213�C231.
[49] GROS M, LORAND J P, LUGUET A. Analysis of platinum group elements and gold in geological materials using NiS fire assay and Te coprecipitation; the NiS dissolution step revisited [J]. Chemical Geology, 2002, 185: 179�C190.
[50] JUVONEN R, KONTAS E. Comparison of three analytical methods in the determination of gold in six Finnish gold ores, including a study on sample preparation and sampling [J]. Journal of Geochemical Exploration, 1999, 65: 219�C229.
[51] KRISHNA H, KUMAR K. Reliability estimation in Lindley distribution with progressively type II right censored sample [J]. Mathematics and Computers in Simulation, 2011, 82: 281�C294.
[52] PATINHA C, CORREIA E, da SILVA E F, SIMOES A, REIS P, MORGADO F, FONSECA E C. Definition of geochemical patterns on the soil of Paul de Arzila using correspondence analysis [J]. Journal of Geochemical Exploration, 2008, 98: 34�C42.
[53] DARABI-GOLESTAN F, HEZARKHANI A, ZARE M. Assessment of 226 Ra, 238 U, 232 Th, 137 Cs and 40 K activities from the northern coastline of Oman Sea (water and sediments) [J]. Marine Pollution Bulletin. 2017, 118(1): 197�C205.
[54] DARABI-GOLESTAN F, GHAVAMI RIABI R, MAJLESI MJ, MEMARZADE M, ASADI HAROONI H. Identify and separation of anomall variable using correspondence and discriminant analyses methods at Northern�CDalli area [J]. analytical and Numerical Method in Minning Engineering. 2012, 3: 35�C45. (in Persion)
[55] DARABI-GOLESTAN F, HEZARKHANI A. Evaluation of elemental mineralization rank using fractal and multivariate techniques and improving the performance by log-ratio transformation [J]. Journal of Geochemical Exploration, 2017. DOI: 10.1016/j.gexp10.2017.09.11
[56] MOHAMADI N M, HEZARKKHANI A, SALJOOGHI B S. Separation of a geochemical anomaly from background by fractal and U-statistic methods, a case study: Khooni district, Central Iran [J]. Chemie der Erde-Geochemistry, 2016, 76: 491�C499.
(Edited by HE Yun-bin)
���ĵ���
������Ԫ����������������Glojeh����Au(Ag)-����������ѧԪ�طֲ��Ķ���Ԫ����
ժҪ�����о���ָʾ��Ʒ�е�Ԫ����Ͻ��������������������������������Glojeh��������У�Ag, As, Pb, Te, Mo, Au��Zn����ǿ�ҿ���S��W��Cu�̶Ƚϵ͡����IJ��ú�����Ԫ��ͨ����ʼ��������ģ����֤��AuŨ�ȵ���ЧӦ��X���Ͷ����X2���Լ�Ag, Cu, Pb��Zn��һ�������ã�Xi��Xj�����ж���Ԥ�⡣������Ԫ���ǻ��ڶ��ζ���ʽģ����ɵģ�ͨ��ȥ������Ҫ��ָʾ����������Ԫ���õ����ζ���ʽģ�͡��ڶ��ζ���ʽ�Ż������У�R2(pred)���Ӷ�R2��С��R2��R2(adj)��R2(pred)���������Ե��������ơ�����288�����ۺ�679�������ʯ��Ʒ��Ԥ�������������ζ���ʽģ�Ͱ�����ֵ������Cu��Ag��Cu��Pb��Zn��Ag2�CPb2������ָʾ������Pb, Ag��Cu��Cu��Zn��Pb��Zn��Ag2��������Au����ǿ�ҵ��Ŵ�ЧӦ��Pb��Ag2��Ag��PbΪ������Ʒ���ζ���ʽģ�͵���Ҫָʾ����������ֵ����Ϊ�����Ʒģ�͵���Ҫָʾ��������֤�鹵����Ʒ�������Ʒ���ζ���ʽģ�͵�R2(pred)�ֱ�Ϊ74.9%��60.62%��R2�ֱ�Ϊ73.9%��60.9%��
�ؼ��ʣ�����Է�����һ�������ã����ζ���ʽģ�ͣ��Ż�ģ�ͣ�������֤��ǿ���Ŵ�ЧӦ
Received date: 2016-12-13; Accepted date: 2017-12-05
Corresponding author: Darabi-Golestan Farshad, PhD; Tel: +98-2144908447; E-mail: pooyan@aut.ac.ir
Abstract: The correspondence analysis will describe elemental association accompanying an indicator samples. This analysis indicates strong mineralization of Ag, As, Pb, Te, Mo, Au, Zn and to a lesser extent S, W, Cu at Glojeh polymetallic mineralization, NW Iran. This work proposes a backward elimination approach (BEA) that quantitatively predicts the Au concentration from main effects (X), quadratic terms (X2) and the first order interaction (Xi��Xj) of Ag, Cu, Pb, and Zn by initialization, order reduction and validation of model. BEA is done based on the quadratic model (QM), and it was eliminated to reduced quadratic model (RQM) by removing insignificant predictors. During the QM optimization process, overall convergence trend of R2, R2(adj) and R2(pred) is obvious, corresponding to increase in the R2(pred) and decrease of R2. The RQM consisted of (threshold value, Cu, Ag��Cu, Pb��Zn, and Ag2�CPb2) and (Pb, Ag��Cu, Ag��Pb, Cu��Zn, Pb��Zn, and Ag2) as main predictors of optimized model according to 288 and 679 litho-samples in trenches and boreholes, respectively. Due to the strong genetic effects with Au mineralization, Pb, Ag2, and Ag��Pb are important predictors in boreholes RQM, while the threshold value is known as an important predictor in the trenches model. The RQMs R2(pred) equal 74.90% and 60.62% which are verified by R2 equal to 73.9% and 60.9% in the trenches and boreholes validation group, respectively.
