
Trans. Nonferrous Met. Soc. China 28(2018) 2410-2418
Variations in stir zone and thermomechanically affected zone of dissimilar friction stir weld of AA5083 and AA6082 alloys
U. DONATUS1, G. E. THOMPSON1, M. I. MOMOH2, N. B. MALEDI3, I-L. TSAI4, RAPHAEL OLIVEIRA FERREIRA5, Z. LIU1
1. School of Materials, The University of Manchester, Manchester M13 9PL, UK;
2. Department of Metallurgy, Kogi State Polytechnic, Itakpe, Nigeria;
3. School of Chemical and Metallurgical Engineering, University of the Witwatersrand, Wits, 2050, South Africa;
4. Oxford Instruments NanoAnalysis, HP12 2SE, High Wycombe, UK;
5. Escola Polit��cnica da Universidade de Sao Paulo, Av. Prof. Mello Moraes, 2463, Sao Paulo, SP, Brazil
Received 20 February 2018; accepted 4 August 2018
Abstract:
Variations in composition, microhardness (in the thermomechanically affected zone) and texture in the tool domain of the dissimilar friction stir weld of AA5083-O and AA6082-T6 alloys were investigated. The contents of the major alloying elements in the weld zones were determined using inductively coupled plasma-atomic emission spectroscopy. It was observed that a slight drop in the content of the alloying elements results from the friction stir welding process with the Mg content being the most affected amongst the major alloying elements in the two alloys. By relating the mass fractions of the major alloying elements in the parent metals of both alloys to those of the stir zone, the relative proportions of the two alloys in the stir zone were estimated with the results showing that at least 60% of the materials in the stir zone are from the retreating side of the weld. It was also revealed that the changes in the hardness profile in the thermomechanically affected zone of the retreating side are predominantly influenced by changes in grain size in that domain. Finally, the investigation further revealed that the texture component in the tool shoulder domain is different from the texture component in the tool pin domain.
Key words:
alloying element; aluminium alloy; friction stir welding; parent metal;
1 Introduction
Friction stir welding is a solid state welding process in which a non-consumable rotating tool is used to create plasticization and consolidation of the base metals/ materials. Friction stir welding has numerous advantages over conventional fusion welding processes [1-6], some of which include the absence of liquation cracking and porosity, low heat spread and minimal distortion of the parent materials (PM). Importantly, it is generally stressed that loss of elements does not occur during friction stir welding processes and, therefore, effects of elemental loss are often ignored in friction stir welding associated researches and products. In fact, some authors have even reported an increase in the primary alloying element in the weld region of a friction stir weld of AA5083H321 alloy [7].
It is important to mention that pronounced metallurgical and microstructural variations exist in different zones of a friction stir weld [8-15]. These variations include texture and microhardness variations, and a lot of investigations have been carried out in this regard. However, a review of many articles, by the authors, indicates that most texture analyses are often conducted in selected domains of the weld region with the upper part of the weld (the tool shoulder domain) or the lower part of the weld (the tool pin domain) often being neglected in the analyses. This practice, depending on the tool geometry and design, may not give a full picture of the textural behaviour across the welds, mainly as the friction stir welding process produces distinct variations across the entire weld (either from left to right or from the top to the base). As will be seen in this work, texture variations can be markedly different in the two domains of the weld.
Also, on the factors responsible for the variation in microhardness in the weld zones of friction stir welded heat-treatable alloys, particle size and distribution are often the most considered [3,6]. However, in specific zones of the weld, variations in grain size could be the predominant factor for the changes in the microhardness profile.
Thus, in this work, variations in composition, microhardness (in the thermomechanically affected zone of AA6082-T6 alloy) and texture in the tool domain of the dissimilar friction stir weld of AA5083-O and AA6082-T6 alloys have been investigated. AA5083-O and AA6082-T6 alloys are frequently used in ship- building. Often, these alloys are joined together by welding processes (in which friction stir welding is gradually becoming the most preferred choice). The investigation of the variation in composition is particularly essential since galvanic cells are created in the dissimilar welds of these two alloys, which can be worsened by significant variations in the contents of the major alloying elements in the weld zones.
Further, it is essential to establish whether friction stir welding of the alloys can result in compositional variations as this may lead to significant electrochemical and mechanical property variations across the weld zones, which may, in turn, affect the performance of the welded component in service. Also, establishing the proportions of the materials from the advancing side (AS) and retreating side (RS) in the stir zone (SZ) is equally very important, and this is also estimated in this work.
2 Experimental
Dissimilar friction stir weld of AA5083-O and AA6082-T6 alloys was supplied by TWI. The alloys were 8 mm thick and were welded using a 2-part MX-TrifluteTM weld tool at a traverse speed of 400 mm/min and a rotation speed of 400 r/min. The welding tool had a pin with a diameter to length ratio of 1: 0.8 and a scroll shoulder with a diameter of 25 mm that is usable at a tilt angle of 0��.
Samples weighing 0.1 g each were prepared from the weld zones of the dissimilar friction stir weld of the AA5083-O and AA6082-T6 alloys. The weighted samples were used to prepare a 1:10 dilution ratio standard solution from a solution that was made by dissolving each weighted sample in a concentrated 2 mL nitric acid followed by the addition of 18 Meg Ohm deionised water to make 100 mL. The standard solution was then introduced into the inductively coupled plasma-atomic emission spectroscopy (ICP-AES) machine to determine the elemental contents of the major elements in the individual zones of the weld.
A ZEISS AXIO microscope was used for optical microscopy. The sample examined under the microscope was sequentially polished to a 1 ��m surface finish using SiC papers up to 4000 grit size and a 1 ��m diamond paste with an alcohol-based lubricant. After polishing, the sample was degreased in ethanol and then rinsed in deionised water before drying in a cool air stream. The dried sample was then etched in Weck��s reagent (4 g KMnO4 + 1 g NaOH in 100 mL of deionised water) for 30 s. After etching, the sample was rinsed in deionised water and dried in a cool air stream before the microstructural examination. Scanning electron (SE) microscopy was conducted using a ZEISS ULTRA 55 microscope equipped with an electron backscattered diffraction (EBSD) facility, and a JEOL JSM-6010LA fitted with an energy dispersive X-ray spectroscopy (EDS) facility. The EBSD analysis was conducted using a Channel 5 HKL software. Transmission electron (TE) microscopy was carried out with the aid of a Philips CM20 microscope. TEM samples were prepared by twin-jet electropolishing technique.
3 Results and discussion
3.1 Friction stir weld zone
Figure 1(a) displays an optical image showing the weld direction, the weld zones in the dissimilar friction stir weld of the AA5083-O and AA6082-T6 alloys and the position of the alloys (with the AA5083-O in the advancing side (AS) and the AA6082-T6 in the retreating side (RS)) in the weld. Five distinct weld zones are indicated in this figure. The zones are the parent metal side of the AA5083-O alloy (PM-5083), the thermo- mechanically affected zone of the AA5083-O alloy (MID-TMAZ), the stir zone (SZ), the thermo- mechanically affected zone of the AA6082-T6 alloy (RS-TMAZ), and the parent metal side of the AA6082-T6 alloy. Figure 1(b) displays an optical micrograph of the SZ showing the AA5083-O rich and the AA6082-T6 rich zones in the region. This was achieved because the AA5083-O alloy is rarely etched in Weck��s reagent while AA6082-T6 alloy is readily etched in Weck��s reagent. Thus, Fig. 1(b) indicates that although the SZ is a mixture of the two alloys, the mixture is far from being perfectly complete, with some regions being predominantly richer in the AA5083-O alloy than the AA6082-T6 alloy and vice versa.
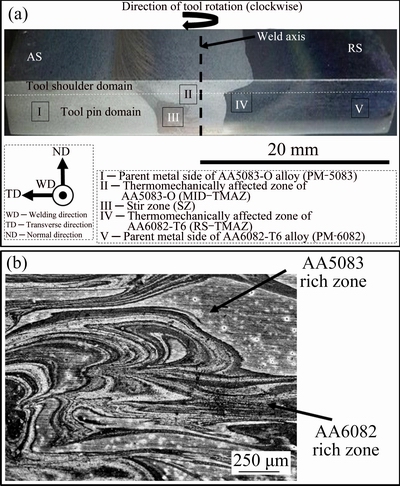
Fig. 1 Optical image displaying welding direction and weld zones in dissimilar friction stir weld of AA5083-O and AA6082-T6 alloys (a) and AA5083-O and AA6082-T6 rich zones in SZ of weld (b)
3.2 Composition analyses

Fig. 2 EDS analysis results of transition regions between HAZ of AA5083-O alloy and FA (a, c, e), and between FA and MID-TMAZ (b, d, f) showing variations in Mg and Si contents across zones
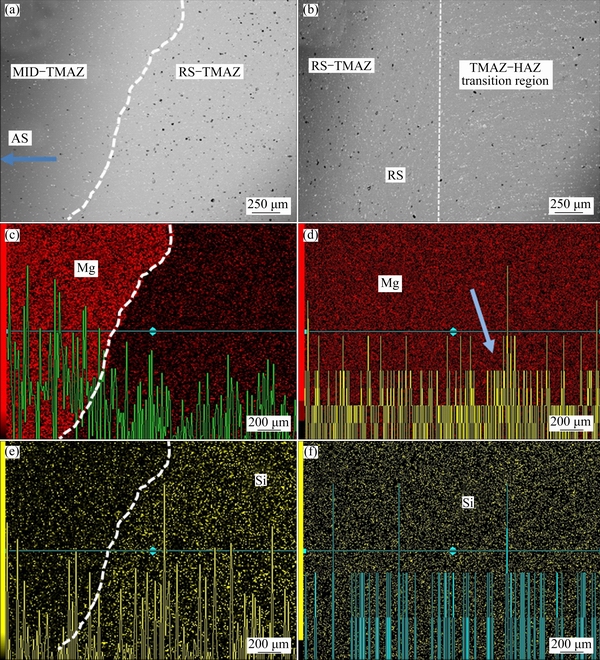
Fig. 3 EDS analysis results of transition region between MID-TMAZ and RS-TMAZ showing variations in Mg and Si contents across zones (a, c, e) and between RS-TMAZ and TMAZ-HAZ transition region showing very slight variation in Mg content and no variation in Si content across zones (b, d, f)
In this section, compositional variations in the SZ and TMAZ of the dissimilar weldments are discussed based on results from EDS and ICP-AES. The results were obtained in a stepwise manner from the AS of the weld to the RS of the weld. Presented in Figs. 2-4 are the EDS maps with line plots showing the variations in Mg and Si contents across the zones. The EDS line plots for the Fe and Mn contents were not included in the presentation as their EDS results did not show any observable changes across the zones. Out of the elements considered, the variation in Mg contents was the most pronounced followed by that of Si (which was not emphatically pronounced across the zones compared).
Figure 2 presents the results for the transition regions between the HAZ of the AA5083-O alloy and the flow arm (FA), and between the FA and the MID-TMAZ. The results clearly show that the Mg content in the FA was significantly lower compared with the Mg contents in the HAZ and MID-TMAZ. Also, the Si content in the FA was higher compared with that in the HAZ and MID-TMAZ. This indicates that the FA region is not composed of materials from the AA5083-O alloy which it shares a boundary with and that the MID-TMAZ is as rich in Mg and depleted in Si as the HAZ of the AA5083-O alloy. The FA is a portion of the TMAZ located in the AS immediately above the SZ, and the decrease in Mg content alongside an increase in Si content further confirms that the FA is mostly composed of materials dragged by the tool shoulder from the RS (the AA6082-T6 alloy in this case) to the AS of the weld [16]. Further, presented in Figs. 3(a, c, e) are the EDS analysis results of the transition region between the MID-TMAZ and the RS-TMAZ. Like the FA, the RS-TMAZ with less Mg content and with higher Si content (compared with the MID-TMAZ) is an AA6082-T6-rich region; however, it is far more of an AA6082-T6-rich region than the FA. This is further evident in the analysis presented in Figs. 3(b, d, f) which shows little or no variations in Mg and Si contents across the RS-TMAZ and the TMAZ-HAZ transition regions (which is outside the tool domain with distorted grains of the parent AA6082-T6 alloy unlike the finer and fragmented grains of the RS-TMAZ). However, the EDX line plot (Fig. 3(d)) appears to show a slight increase in the Mg content at the boundary between the two zones as indicated by the red arrow. This possibly resulted from the diffusion of Mg atoms from the RS-TMAZ to this boundary. Nonetheless, the EDS is not the appropriate technique for revealing such slight variations at this scale. Thus, the ICP-AES was employed to show the compositional difference between the RS-TMAZ and the AA6082-T6 alloy.
The SE and EDS maps for the SZ regions are shown in Fig. 4. Analyses were conducted for the sharp-end region (Figs. 4(a, c, e)) in the AS and for the diffuse-end region in the RS (Figs. 4(b, d, f)). The SZ clearly show compositional variations in agreement with the micrograph presented in Fig. 1(b), especially as typified by the line EDS for Mg (Figs. 4(c, d, f)). Two Mg EDS lines were presented for the diffuse-end region to show the variations at the bottom and top of the SZ, respectively. The Si line of EDS was not presented for the diffuse-end region since its variation was not pronounced (although there are variations in Si content between the AA5083-rich zone (lower Si) and the AA6082-rich zone (higher Si)). Figure 4 also shows that the SZ comprises materials from the RS even though it is situated more in the AS of the weld. However, it is a mixture of the two alloys with less Mg compared with the AS-TMAZ (sharp-end) and the MID-TMAZ (diffuse-end), but with more Mg content compared with the RS-TMAZ (as will be seen later in the presentation of the ICP-AES result).
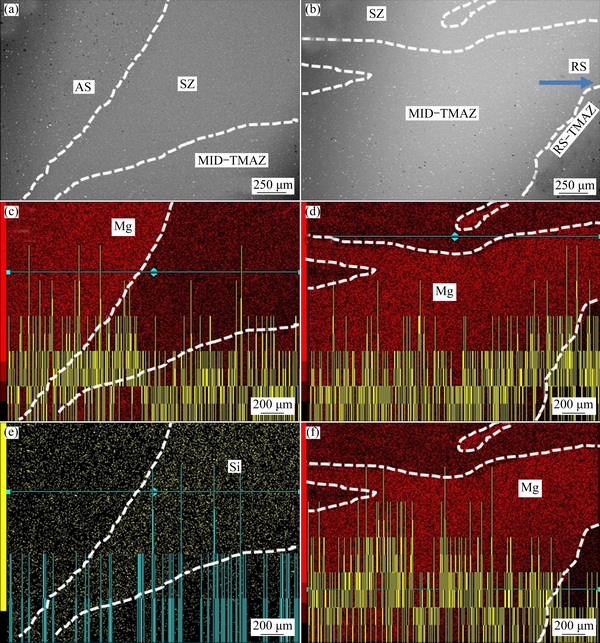
Fig. 4 EDS analysis results of sharp-end region of SZ (a, c, e) and diffuse-end region of SZ (b, d, f) showing variations in Mg and Si contents
Given that the EDS is not an ideal technique for precise and accurate quantification of the variations in the alloying elements across the weld zones, the ICP-AES was employed to confirm this variation further. Figure 5 displays a bar chart showing the variations in the mass fractions of the major alloying elements in the weld zones of the friction stir weld of dissimilar AA5083-O and AA6082-T6 alloys. The PM-5083 and MID-TMAZ have high Mg contents of 3.92% and 3.81% and low Si contents of 0.03% and 0.02%. The PM-6082 and RS-TMAZ have Mg contents of 0.74% and 0.71%, and Si content of 0.44%. The AA5083-O zones display slightly lower Fe contents, but the Mn contents in the zones are marginally higher compared with the AA6082-T6 zones. The SZ shows intermediate alloying element contents of 1.83% Mg, 0.40% Si, 0.29% Fe and 0.40% Mn, which confirms that the SZ is composed of a mixture of materials from the AA5083-O and AA6082-T6 alloys. From these data, it can be seen that the contents of the alloying elements in the thermomechanically affected zones (TMAZ) of both alloys are slightly less compared with the PMs of the alloys. This is particularly pronounced in the Mg content of AA5083-O alloy zones which drops by 0.11% from the PM-5083 to the MID-TMAZ. The drop in Mg content is not so pronounced in the AA6082-T6 zones, although it decreases by 0.03% from the PM-6082 to the RS-TMAZ. The Fe and Mn contents are not significantly affected, only falling in the range of 0.01% and 0.02%, respectively, in both the AA5083-O alloy and AA6082-T6 alloy zones. Also, the Si contents are not particularly affected as no evident variations in the mass fractions are observed between the PMs of the alloys and their TMAZ zones. Given that the Mg contents are the most affected, followed by Fe and Mn contents with the Si contents not being affected, it is possible that these compositional variations may well be as a result of diffusion. Thus, the compositional differences between the PMs and their TMAZ zones are probably because the alloying elements diffuse in the order of their diffusion coefficients in the Al matrix, during the friction stir welding process. The friction stir welding process generates heat reaching temperatures up to 500 ��C [3,6] which assists in speeding up diffusion kinetics.

Fig. 5 Mass fractions of Mg, Si, Fe and Mn in weld zones of dissimilar friction stir weld of AA5083-O and AA6082-T6 alloys
Furthermore, from the known contents of the alloying elements in the SZ and the PM of the welded alloys, an approximate estimation of the proportions of the AS and RS materials in the SZ can be made. Mainly because the Si content in the AS material (AA5083-O) alloy is near zero compared with that for the RS material (AA6082-T6) which is significant, the formula below was used to estimate the proportions of the AS and RS materials in the SZ:
mass fraction of Mg, Si, Fe, or Mn in MID-TMAZ+
mass fraction of Mg, Si, Fe, or Mn in RS-TMAZ=
mass fraction of Mg, Si, Fe, or Mn in SZ.
From this formula, six different simultaneous equations were generated using combined mass fractions of Mg and Si, Mg and Fe, Mg and Mn, Si and Fe, Si and Mn, and Fe and Mn. The values of A and B were obtained from these mathematical equations. The values of B ranged from 0.645 to 0.955 which indicate that the proportion of the RS material in the SZ falls between 64.5% and 95.5% (i.e., at least 64% of the materials in the SZ are from the RS of the weld) under the welding conditions employed in this study. This further strengthens the theory that the SZ is composed mainly of the materials from the RS [16]. The RS materials in the SZ were transported by the tool shoulder at the surface of the weld to the FA region in the AS. The materials were then spiralled downwards from the FA in the tool shoulder domain to the SZ in the tool pin domain. More details on this can be found in Ref. [16].
3.3 Microstructure, hardness and texture
This section aims to: (1) shed more light on the primary factor responsible for the microhardness variations usually observed in the TMAZs of friction stir weldments of precipitation hardened Al alloys, and (2) to highlight the texture variations in the upper and lower regions of the TMAZ and SZ of the dissimilar weld of the AA5083-O and AA6082-T6 aluminium alloys. For point (1), the relationship between microstructures and microhardness in two distinct regions of the RS-TMAZ is employed since the RS-TMAZ is an AA6082-T6-rich region that is strongly influenced by hardening precipitates. The RS-TMAZ has a width of about 6 mm at the top of the weld, with a maximum of about 7 mm at the transition region between the tool shoulder domain and the tool pin domain. Its width reduces from this transition region as the bottom of the weld is approached (see the region labelled IV in Fig. 1(a)).
Figure 6 displays the relationships between microstructure and microhardness variations in the two distinct regions of the RS-TMAZ. Although the analysis of the microhardness across the weld (comprising the PMs of the AA5083-O and AA6082-T6 alloys, the HAZs, the MID-TMAZ and the RS-TMAZ) has been reported [16], the investigation in the present study seeks to further clarify the variation in the RS-TMAZ which was not particularly clarified in the previous report. Figures 6(a�Cc) show the TE and SE micrographs in a region adjacent to the MID-TMAZ and weld axis, designated as A in Fig. 6(d) (the microhardness profile across the RS-TMAZ zone), whilst Figs. 6(e�Cg) show the TE and SE micrographs in a region adjacent to the HAZ of the AA6082-T6 alloy, designated as B in Fig. 6(d). As evident in Fig. 6(c), it can be seen that region A has finer grains (though with wide variations in size, from 37 ��m to as fine as 5 ��m, since the grains are being heavily fragmented towards the weld axis) compared with region B with grain size of 100 ��m. Although the grains in region B are also being fragmented, they are closer in size to the grains in the HAZ of the AA6082-T6 alloy. At the micro-scale (Figs. 6(c, g)), the second phase particles in region A tend to be finer and more evenly distributed (although still somewhat aligned) compared with region B. However, at the nano-scale, region B (Figs. 6(e, f)) shows very fine distribution of second phase particles in the matrix of the alloy (Fig. 6(f)) which were not evident in the TE micrographs of region A. These results show that variation in the microhardness profile in thermomechanically affected zone may not be predominant as a result of particle interspacing but variations in the grain sizes. If the microhardness variations were predominantly from particle interspacing, the microhardness values in region B would have been greater than the microhardness values in region A, since region B has finer particles at nano-scale which were not observed in any area in region A. However, the grain sizes appear to clearly vary with the changes in microhardness across the RS-TMAZ zone. It is important to mention that the variation in microhardness could as well be from variations in the density of Guinier-Preston (GP) zones or variations in co-clustering of Mg and Si atoms. Nonetheless, the most evident factor at this scale is the variation in grain size, and its effect cannot be overruled since grain boundaries are potent barriers to dislocation movement.

Fig. 6 TEM (a, b) and SEM (c) images displaying microstructures in RS-TMAZ (region A) adjacent to MID-TMAZ and weld axis
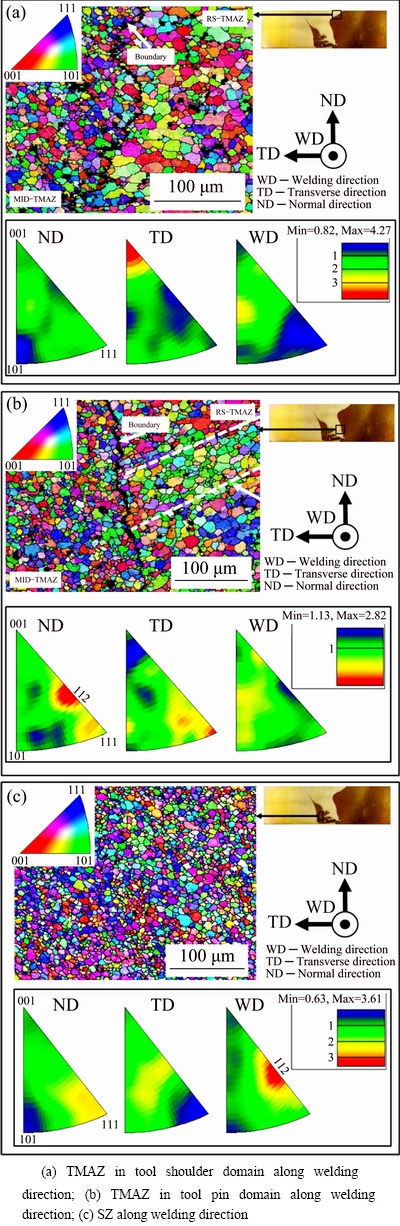
Fig. 7 EBSD map and inverse pole figures along ND, TD and WD
The friction stir welding process produces varying local grain orientations and textures arising from varying shear deformation experienced in the different zones of the weld [17,18]. Understanding the texture variations is important since texture affects the properties of materials including the anisotropy of the corrosion and mechanical properties [19]. Figure 7 displays EBSD maps along the welding direction with the inverse pole figure (IPF) legend, and IPF plots along the welding direction (WD), transverse direction (TD) and normal direction (ND).
The EBSD data of the weld affected regions (the TMAZ and the SZ) are presented. Figure 7(a) presents that for the TMAZ region in the tool shoulder domain, Fig. 7(b) shows that for the TMAZ region in the tool pin domain (adjacent to the SZ), and Fig. 7(c) shows that for the SZ.
The customary principal ��111�� (blue), ��001�� (red), ��101�� (green) and ��112�� (pink) //WD (cubic system) grain orientations [18-21] are observed in near-equal proportions in the MID-TMAZ (an AA5083-O zone), whereas in the RS-TMAZ (an AA6082-T6 zone), the ��111��//WD (blue grain orientation) is significantly minimal. This is particularly evident in Fig. 7(b), with the ��101��//WD (green grain orientation) dominating the region as clearly shown in the banded region. The SZ (Fig. 7(c)) shows no particular preferential proportions of the dominant grain orientations.
The IPF plot in Fig. 7(a) of the TMAZ, in the tool shoulder domain, shows strong ��001��//TD texture, while strong ��112��//ND and ��111��//TD textures are observed in the TMAZ of the tool pin domain (Fig. 7(b)). The SZ (Fig. 7(c)) shows strong ��112��//WD and weaker ��111��// ND textures.
These results show that the grain orientations in the MID-TMAZ and RS-TMAZ are significantly different, with the RS-TMAZ showing far less ��111��//WD grain orientation compared with the MID-TMAZ. From the IPF plots, whilst the ��001��//TD texture is observed in the tool shoulder domain (Fig. 7(a)), ��112�� and ��111�� textures (although parallel to different directions) are found in the tool pin domain, suggesting that the textures in the tool shoulder domain are entirely different from the ones in the tool pin domain. The similarities in the texture of the TMAZ in the tool pin domain (��112��//ND and ��111��// TD) with that of the SZ (��112��//WD and ��111��//ND) indicate that the texture in the TMAZ zone is about a 90o rotation of the texture in the SZ, and that crystallographic relationships exist between the prior deformed texture of the TMAZ in the tool pin domain and the recrystallization texture of the SZ [22]. Thus, the texture of the prior deformed grains in the tool pin domain plays a dominant role in the newly formed recrystallization texture. On the whole, it is important to note that the texture components in the TMAZ and SZ can vary significantly in both vertical and horizontal directions with consequent effects on mechanical properties.
4 Conclusions
1) The variations in the elemental compositions across the weld zones of a dissimilar friction stir weld of AA5083-O and AA6082-T6 alloys have been investigated.
2) Compositional variations in the thermo- mechanically affected zones of both alloys were observed, with Mg being the most affected and Si being the least affected.
3) The mass fractions of the elements in the thermomechanically affected zones of the two alloys and that in the stir zone were used to estimate the proportions of the retreating side/advancing side material in the SZ. The fraction of the retreating side material in the stir zone is between 64.5% and 95.5%. This further confirms that the stir zone comprises mainly of materials from the retreating side of the weld.
4) The variation in microhardness in the TMAZ of the AA6082-T6 aluminium alloy has been primarily attributed to the variation in grain size since the strengthening Mg2Si particles were rarely found in this zone.
Acknowledgments
The authors acknowledge the EPSRC for financial support through the LATEST2 Programme Grant and TWI for the supply of materials.
References
[1] PALANIVEL R, MATHEWS P K, MURUGAN N, DINAHARAN I. Effect of tool rotational speed and pin profile on microstructure and tensile strength of dissimilar friction stir welded AA5083-H111 and AA6351-T6 aluminum alloys [J]. Materials & Design, 2012, 40: 7-16.
[2] THOMAS W M, NICHOLAS E D. Friction stir welding for the transportation industries [J]. Materials & Design, 1997, 18: 269-273.
[3] MISHRA R S, MA Z Y. Friction stir welding and processing [J]. Materials Science and Engineering R: Reports, 2005, 50: 1-78.
[4] WILLIAMS S W. Welding of airframes using friction stir [J]. Air & Space Europe, 2001, 3: 64-66.
[5] MORAITIS G A, LABEAS G N. Investigation of friction stir welding process with emphasis on calculation of heat generated due to material stirring [J]. Science and Technology of Welding and Joining, 2010, 15(2): 177-184.
[6] THREADGILL P L, LEONARD A J, SHERCLIFF H R, WITHERS P J. Friction stir welding of aluminium alloys [J]. International Materials Reviews, 2009, 54(2): 49-93.
[7] SUBBAIAH K, GEETHA M. Comparison of tungsten inert gas and friction stir welding of AA 5083-H321 aluminum alloy plates [C]// Trends in Welding Research 2012. Chicago, Illinois, USA: ASM International, 2012.
[8] DONATUS U, THOMPSON G E, MORSCH S, TSAI I. Areas of concern in an anodised dissimilar friction stir weld of AA5083 and AA6082 aluminium alloys [J]. Transactions of the IMF, 2016, 94: 70-75.
[9] DONATUS U, THOMPSON G E, ZHOU X. Effect of prior sputter deposition of pure aluminium on the corrosion behaviour of anodized friction stir weld of dissimilar aluminium alloys [J]. Scripta Materialia, 2016, 123: 126-129.
[10] DONATUS U, THOMPSON G E, ZHOU X. Anodizing behavior of friction stir welded dissimilar aluminum alloys [J]. Journal of the Electrochemical Society, 2015, 162(12): C657-C665.
[11] KHAN N Z, KHAN Z A, SIDDIQUEE A N, AL-AHMARI A M, ABIDI M H. Analysis of defects in clean fabrication process of friction stir welding [J]. Transactions of Nonferrous Metals Society of China, 2017, 27(7): 1507-1516.
[12] HAMED J A. Effect of welding heat input and post-weld aging time on microstructure and mechanical properties in dissimilar friction stir welded AA7075-AA5086 [J]. Transactions of Nonferrous Metals Society of China, 2017, 27(8): 1707-1715.
[13] SHARMA N, KHAN Z A, SIDDIQUEE A N. Friction stir welding of aluminum to copper��An overview [J]. Transactions of Nonferrous Metals Society of China, 2017, 27(10): 2113-2136.
[14] ZHANG Y N, CAO X, LAROSE S, WANJARA P. Review of tools for friction stir welding and processing [J]. Canadian Metallurgical Quarterly, 2012, 51(3): 250-261.
[15] WAHID M A, KHAN Z A, SIDDIQUEE A N. Review on underwater friction stir welding: A variant of friction stir welding with great potential of improving joint properties [J]. Transactions of Nonferrous Metals Society of China, 2018, 28(2): 193-219.
[16] DONATUS U, THOMPSON G E, ZHOU X, WANG J, BEAMISH K. Flow patterns in friction stir welds of AA5083 and AA6082 alloys [J]. Materials & Design, 2015, 83: 203-213.
[17] FONDA R W, KNIPLING K E, ROWENHORST D J. EBSD analysis of friction stir weld textures [J]. JOM, 2013, 66(1): 149-155.
[18] FONDA R W, KNIPLING K E. Texture development in friction stir welds [J]. Science and Technology of Welding and Joining, 2011, 16(4): 288-294.
[19] SUHUDDIN U F H R, MIRONOV S, SATO Y S, KOKAWA H. Grain structure and texture evolution during friction stir welding of thin 6016 aluminum alloy sheets [J]. Materials Science and Engineering A, 2010, 527: 1962-1969.
[20] L�� Y, BRUHIS M, MCDERMID J. Effect of strain path on the microstructural evolution of a Fe-22Mn-0.6C alloy [C]// AIST Int Symposium on New Developments in AHSS. Vail, Colo, 2013: 113-118.
[21] AHMED M M Z, WYNNE B P, RAINFORTH W M, THREADGILL P L. Microstructure, crystallographic texture and mechanical properties of friction stir welded AA2017A [J]. Materials Characterization, 2012, 64: 107-117.
[22] ROLLETT A, HUMPHREYS F, ROHRER G S, HATHERLY M. Recrystallization and related annealing phenomena [M]. 2nd ed. Elsevier, 2004.
���ֽ�������Ħ����AA5083��AA6082�Ͻ�Ľ�����������Ӱ�����ı仯
U. DONATUS1, G. E. THOMPSON1, M. I. MOMOH2, N. B. MALEDI3, I-L. TSAI4, RAPHAEL OLIVEIRA FERREIRA5, Z. LIU1
1. School of Materials, The University of Manchester, Manchester M13 9PL, UK;
2. Department of Metallurgy, Kogi State Polytechnic, Itakpe, Nigeria;
3. School of Chemical and Metallurgical Engineering, University of the Witwatersrand, Wits, 2050, South Africa;
4. Oxford Instruments NanoAnalysis, HP12 2SE, High Wycombe, UK;
5. Escola Polit��cnica da Universidade de Sao Paulo, Av. Prof. Mello Moraes, 2463, Sao Paulo, SP, Brazil
ժ Ҫ���о�AA5083-O��AA6082-T6�Ͻ����ֽ�������Ħ������ͷ�ijɷ֡���Ӳ��(����Ӱ����)��֯���ı仯�����õ����ϵ�������-ԭ�ӷ�������ⶨ��������Ҫ�Ͻ�Ԫ�صĺ������������������Ħ�������������ֺϽ����Ҫ�Ͻ�Ԫ�صĺ����������½�������þԪ�غ����ı仯���ͨ�������ֺϽ�ĸ�������������Ҫ�Ͻ�Ԫ�ص�������������ϵ��������������ֺϽ����Ա����������ʾ��������˲�IJ���ռ�ȴ���60%�����⣬���˲�����Ӱ����Ӳ�ȷֲ��ı仯��Ҫ�ܸ��������ߴ�仯��Ӱ�졣����о���һ������������������������֯���ɷֲ�ͬ��
�ؼ��ʣ��Ͻ�Ԫ�أ����Ͻ𣻽���Ħ������ĸ��
(Edited by Bing YANG)
Corresponding author: Z. LIU; Tel: +44-7873507226; Fax: +44-(0)1613064865; E-mail: zuojia.liu@gmail.com
DOI: 10.1016/S1003-6326(18)64887-3
Abstract: Variations in composition, microhardness (in the thermomechanically affected zone) and texture in the tool domain of the dissimilar friction stir weld of AA5083-O and AA6082-T6 alloys were investigated. The contents of the major alloying elements in the weld zones were determined using inductively coupled plasma-atomic emission spectroscopy. It was observed that a slight drop in the content of the alloying elements results from the friction stir welding process with the Mg content being the most affected amongst the major alloying elements in the two alloys. By relating the mass fractions of the major alloying elements in the parent metals of both alloys to those of the stir zone, the relative proportions of the two alloys in the stir zone were estimated with the results showing that at least 60% of the materials in the stir zone are from the retreating side of the weld. It was also revealed that the changes in the hardness profile in the thermomechanically affected zone of the retreating side are predominantly influenced by changes in grain size in that domain. Finally, the investigation further revealed that the texture component in the tool shoulder domain is different from the texture component in the tool pin domain.
