
Trans. Nonferrous Met. Soc. China 28(2018) 2440-2448
Microstructure-fracture toughness relationships and toughening mechanism of TC21 titanium alloy with lamellar microstructure
Zhi-feng SHI1,2, Hong-zhen GUO2, Jian-wei ZHANG1, Jian-ning YIN3
1. High Temperature Material Research Division, Central Iron & Steel Research Institute, Beijing 100081, China;
2. School of Materials Science and Engineering, Northwestern Polytechnical University, Xi��an 710072, China;
3. Department of Strategic Development, China Iron & Steel Research Institute Group, Beijing 100081, China
Received 10 November 2017; accepted 17 May 2018
Abstract:
The independent influence of microstructural features on fracture toughness of TC21 alloy with lamellar microstructure was investigated. Triple heat treatments were designed to obtain lamellar microstructures with different parameters, which were characterized by OM and SEM. The size and content of �� plates were mainly determined by cooling rate from single �� phase field and solution temperature in two-phase field; while the precipitation behavior of secondary �� platelets was dominantly controlled by aging temperature in two-phase field. The content and thickness of �� plates and the thickness of secondary �� platelets were important microstructural features influencing the fracture toughness. Both increasing the content of �� plates and thickening �� plates (or secondary �� platelets) could enhance the fracture toughness of TC21 alloy. Based on energy consumption by the plastic zone of crack tip in �� plates, a toughening mechanism for titanium alloys was proposed.
Key words:
titanium alloy; lamellar microstructure; fracture toughness; crack tip plastic zone; toughening mechanism;
1 Introduction
Titanium alloys are important structure materials used in aircrafts due to their high strength, low density, excellent creep and corrosion resistance [1-3]. With the development of aircraft structure design concept, damage tolerance property is demanded for titanium alloys [4]. For this purpose, TC21 titanium alloy was developed as a high strength and high damage tolerance alloy, which has been received increasing attention in the last decade [5,6].
Fracture toughness is one of important indexes reflecting damage tolerance properties, which is significantly influenced by the microstructure. For titanium alloys, the fracture toughness for lamellar microstructure is better than that for equiaxed or bi-modal ones [7,8]. In the last decades, abundant researches have been done to establish the relationships between fracture toughness and microstructure for titanium alloys and to determine the microstructural features. FAN [9] established the linear relationship between fracture toughness and the reciprocal average grain diameter for Ti-5.25A1-5.5V-0.9Fe-0.5Cu alloy. CHANDRA RAO et al [10] studied the effect of volume fraction of primary �� phase on fracture toughness behavior of Timetal 834 titanium alloy under mode I and mixed mode I/III loading. FILIP et al [11] summarized the microstructural features influencing fracture toughness, including the diameter of original �� grains, volume fraction of primary �� phase, size of equiaxed �� phase, size of �� colonies, thickness of �� plates, and thickness of grain boundary �� layer.
However, in fact, microstructural features are not always independent variables, some of which are affected by each other [12,13]. The content of lamellar �� phase would decrease if the content of equiaxed �� phase increases, since the total content of �� phase remains constant in the condition of annealing. The content of �� plates usually changes accompanying with the variation of the thickness in lamellar microstructure. Both examples indicate that it is difficult to study the independent effect of microstructural features on facture toughness.
The present study aimed to investigate the individual effect of content and thickness of �� plates and secondary �� platelets on fracture toughness of TC21 titanium alloy after triple heat treatments. A toughening mechanism based on the energy consumption of crack propagation was proposed.
2 Experimental
The material employed in the work was two-phase TC21 (Ti-6Al-2Sn-2Zr-3Mo-1Cr-2Nb-Si) titanium alloy with chemical composition listed in Table 1. The alloy was received in the form of a hot-rolled 300 mm diameter bar with a �� transus temperature of 960 ��C. The original microstructure (Fig. 1) mainly consisted of primary equiaxed �� phase which was uniformly distributed in the transformed �� matrix. The average diameter of equiaxed �� phase was approximately 6 ��m, and their volume fraction was 30%.
Table 1 Chemical composition of TC21 alloy bar (mass fraction, %)


Fig. 1 Microstructure of as-received TC21 hot-rolled bar
Cuboid specimens with dimensions of 52 mm �� 50 mm �� 22 mm were machined from as-rolled TC21 bar by electric discharge machining (EDM). The specimens were treated by triple heat treatments, including annealing in single �� phase field (980 ��C, 15 min), solution treatment and aging (STA) in (��+��) two-phase field. The related parameters involved cooling rate from single �� phase field (water quenching (WQ), air cooling (AC) and furnace cooling (FAC)), solution temperature (860, 880, 900 and 920 ��C) and aging temperature (590, 620 and 650 ��C). Before heat treatments, the glass lubricants were spread on the surfaces of these specimens to prevent oxidation.
Fracture toughness testing was performed on compact type (CT) specimens with the thickness of 20 mm in an INSTRON-1251 testing machine at room temperature. The microstructures were observed using an OLYMPUS-PMG3 optical microscope (OM) and a TESCAN MIRA3 scanning electron microscope (SEM). The microstructure morphologies were quantificationally determined by Image-Pro Plus software.
3 Result and discussion
3.1 Microstructures
The microstructures of TC21 alloy for different cooling rates from single �� phase field followed by STA ((900 ��C, 2 h)+AC)+((590 ��C, 4 h)+AC) are shown in Fig. 2. As the main form of �� phase, �� plates were distributed uniformly in residual �� matrix, but exhibited different numbers, sizes and distribution modes at different cooling rates. The number of �� plates was large, whereas the length and aspect ratio were small in WQ (Fig. 2(a)). Compared with WQ, the number of �� plates was reduced, with length and aspect ratio increased in AC (Fig. 2(b)). The number of �� plates was the smallest, while length and thickness were the largest in FAC (Fig. 2(c)). Moreover, �� colonies were found in all of the microstructures. The �� colonies mainly appeared in the areas close to the �� grain boundaries in WQ and AC. For FAC, the entire �� grains were filled by �� colonies.

Fig. 2 Microstructures of TC21 alloy at different cooling rates after annealing in single �� field at 980 ��C for 15 min
When the annealing temperature was above the �� transus temperature, the microstructure mainly consisted of coarse �� grains. During cooling, grain boundary �� layers formed preferentially along the �� grain boundaries due to the segregation of �� stabilizers. Then, �� plates formed within the �� grains and further coarsened during solution in two-phase field. There were two nucleation modes for �� plates: heterogeneous and homogenous. For the areas close to the �� grain boundaries, grain boundary �� layers were the heterogeneous nuclei. The �� plates developed in the form of so-called ��side plates��, which grew within large colonies of parallel plates into the grain interior [14]. The homogenous nucleation was more favorable in the centre of the �� grains, with most �� plates individually distributed. The cooling rate determined the dominant nucleation mode.
For WQ with large supercooling, the homogenous nucleation was dominant. The �� colonies mainly appeared along the �� grain boundaries in a small range. In the center of �� grains, there were lots of �� plates which homogenously nucleated with small length and aspect ratio. As the supercooling in AC dropped, the range for �� colonies increased. There was enough time for �� plates to grow in the center of �� grains, forming larger length and aspect ratio. For FAC, the cooling rate was so small that the homogenous nucleation was completely inhibited. Therefore, �� colonies took most of �� grains.
Table 2 shows the content and thickness of �� plates at different cooling rates. The content of �� plates was nearly unchanged in spite of apparent variation in cooling rate. This is because the content was dependent on solution temperature. After cooling from single �� phase field, all specimens were treated at 900 ��C for 2 h. During this treatment, phase transformations went towards the equilibrium state, resulting in the constant content of �� plates. The thickness of �� plates was mainly determined by the cooling rate; as cooling rate declined, the thickness increased observably. The dropping of cooling rate reduced nucleation rate and resulting number of �� plates. Eventually, the thickness of �� plates increased.
Table 2 Content and thickness of �� plates at different cooling rates after annealing in single �� field at 980 ��C for 15 min
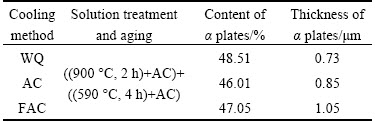
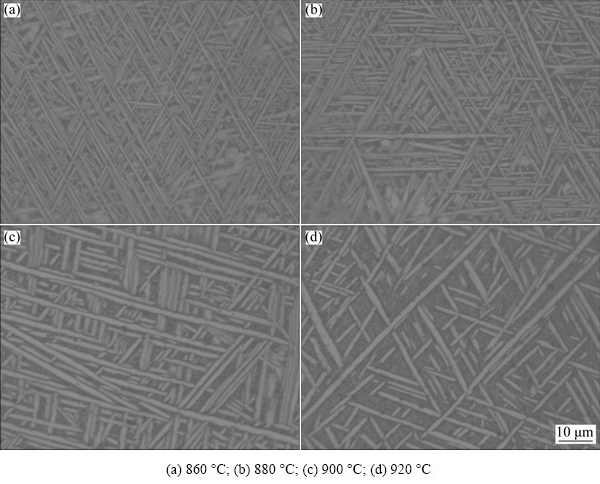
Fig. 3 Microstructures of TC21 alloy at different solution temperatures
The microstructures of TC21 alloys at different solution temperatures are shown in Fig. 3. All the microstructures were made of �� plates with large length and aspect ratio. The �� plates crossed with each other with distinct differences in terms of number, content, size and distribution. After solution at 860 ��C, there were large number of �� plates with small thickness, and several �� plates with the same orientation formed �� colonies (Fig. 3(a)). As solution temperature rose, the number and content of �� plates decreased, while the thickness of �� plates increased (Figs. 3(b) and (c) and Table 3). The decreased content of �� plates was the result of phase transformation. Elevating solution temperature impelled the transformation from �� phase to �� phase, resulting in the decreased equilibrium content of �� plates. Meanwhile, the number of �� plates in one �� colony was reduced, even most of �� plates were individually distributed after solution-treated at 920 ��C (Fig. 3(d)).
Table 3 Content and thickness of �� plates annealed in single �� field under conditions of (980 ��C, 15 min)+AC at different solution temperatures

There was no significant influence of aging temperature on the content, number, size and distribution of �� plates (Fig. 4). The �� plates with large length and aspect ratio crossed with each other. Most of �� plates were distributed individually, and a few of them formed �� colonies. When aging temperature increased from 590 to 650 ��C, the variations of the content and thickness of �� plates were only 3.11% and 0.02 ��m, respectively (Table 4). It can be inferred that the number, content, size and distribution of �� plates were determined by cooling rate and solution temperature, rather than aging temperature.
However, secondary �� platelets changed obviously during aging. At the end of solution treatment in two-phase field, only �� plates and residual �� phase existed in the microstructure. During cooling after solution treatment, fine secondary �� platelets nucleated and even grew up in residual �� phase. Due to high cooling rate, fine secondary �� platelets could not reach the phase equilibrium. During the subsequent aging, fine secondary �� platelets gradually appeared under the action of atomic diffusion (Fig. 5). The thickness of secondary �� platelets increased as aging temperature rose (Table 4). The driving force for the coarsening of secondary �� platelets was the drop of the interfacial energy. The higher the aging temperature was, the larger the driving force was, and the thicker the secondary �� platelets were.
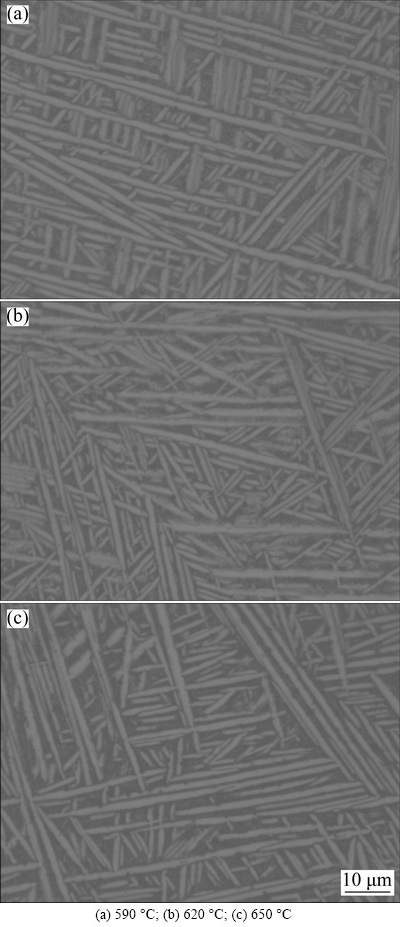
Fig. 4 Microstructures of TC21 alloy at different aging temperatures
Table 4 Content and thickness of �� plates and secondary �� platelets at different aging temperatures

3.2 Fracture toughness
As cooling rate decreased, the fracture toughness of TC21 alloy increased (Fig. 6(a)), similar findings with previous studies. The fracture toughness of TC4-DT alloy changed from 109 to 59.6 MPa��m1/2 when FAC was substituted by WQ [15]. The fracture toughness of TC21 alloy was the lowest (63.8 MPa��m1/2) after WQ, yet the highest (77.0 MPa��m1/2) after FAC. The difference reached 13.2 MPa��m1/2. This indicated that cooling rate in single �� phase field was an important factor on fracture toughness.
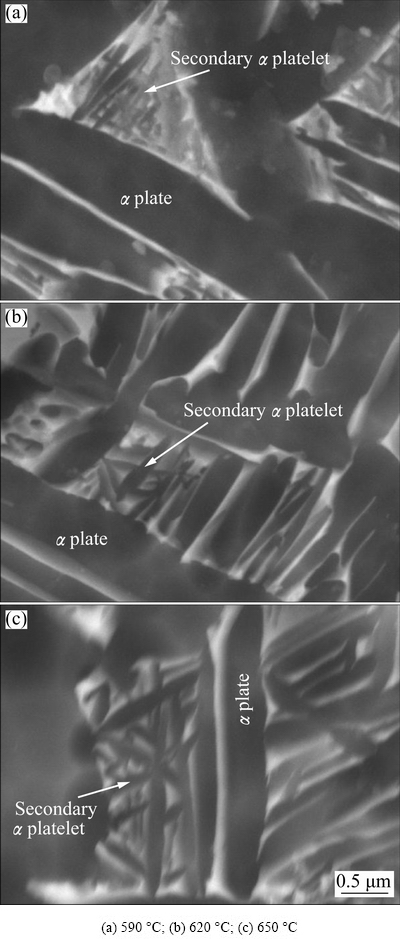
Fig. 5 Microstructures of secondary �� platelets at different aging temperatures

Fig. 6 Influence of heat treatment parameters on fracture toughness of TC21 alloy
The fracture toughness gradually decreased as solution temperature rose (Fig. 6(b)), similar findings with studies in other titanium alloys. The fracture toughness of Ti-1023 alloy decreased from 66.5 to 53.9 MPa��m1/2 when solution temperature elevated from 740 to 800 ��C [16]. The fracture toughness of both Ti-6Al-4V and Ti-6Al-5Zr-4Mo-1Cu-0.2Si alloys decreased with the rising of solution temperature [17,18]. However, with minimal difference of 4.4 MPa��m1/2 at different solution temperatures, the reduction of fracture toughness for TC21 alloy appeared to be negligible. This seems that solution temperature in two-phase field had limited effect on the fracture toughness compared to the factor of cooling rate in single �� phase field.
With the increase of aging temperature, the fracture toughness increased (Fig. 6(c)), which was also reported in Ti-1023 [16], Ti-7Mo-3Nb-3Cr-3Al [19] and Ti-5Al-5Mo-5V-1Cr-1Fe alloys [20]. For TC21 alloy, the minimum fracture toughness was 67.0 MPa��m1/2 aging at 590 ��C, while the maximum was 75.1 MPa��m1/2 aging at 650 ��C. The difference was 8.1 MPa��m1/2, indicating that aging temperature was one of the important factors on the fracture toughness.
3.3 Influence of microstructural features on fracture
toughness
The thickness of �� plates was the factor affecting fracture toughness under the condition that the contents of �� plates in cooling rate test were constant at 47.19% (average volume fraction) based on Table 2. The fracture toughness (KIC) of TC21 alloy increased with the rise of the thickness of �� plates (d), and the linear relationship (Fig. 7(a)) between them was obtained as follows:
KIC=32.32+42.14d (1)

Fig. 7 Influences of thickness of �� plates with constant content in cooling rate test (a), thickness of �� plates with varied contents in solution treatment temperature test (b) on fracture toughness and relationship between fracture toughness difference and content difference of �� plates (c)
For solution temperature test, the fracture toughness decreased as the thickness of �� plates increased (Fig. 7(b)). This result was contrary to that in cooling rate test. The reason was that both the thickness and content of �� plates varied with the solution temperature. The influence of the content of �� plates on the fracture toughness was involved in Fig. 7(b).
The thickness of �� plates increased accompanied with the decrease in the content when the solution temperature rose (Table 3). It was assumed that the effects of the thickness and content of �� plates on the fracture toughness were independent.
According to Eq. (1), the computation values of fracture toughness (KICC) for �� plates with the thicknesses of 0.66, 0.78, 0.85 and 0.90 ��m (Table 3) were 60.1, 65.2, 68.1 and 70.2 MPa��m1/2, respectively, at the content of �� plates of 47.19%. The differences of fracture toughness (��KIC=KIC-KICC) between computation values (KICC) and measuring values (KIC in Fig. 6(b)) were caused by the content of �� plates. The content differences (��c) was defined as the difference between measuring contents (Table 3) and the average content of 47.19%. The coefficient (��KIC/��c) was determined by the differences in fracture toughness (��KIC) and content (��c), as shown in Fig. 7(c). Independent effect of the content of �� plates on fracture toughness was estimated to be 0.79 MPa��m1/2/% (Fig. 7(c)). Therefore, increasing the content of �� plates could enhance the fracture toughness of TC21 alloy.
The thickness of secondary �� platelets was the main microstructural feature significantly influenced by aging temperature (Table 4). The fracture toughness of TC21 alloy increased with the thickness of secondary �� platelets, with the linear relationship between them (Fig. 8).

Fig. 8 Influence of thickness of secondary �� platelets on fracture toughness of TC21 alloy
3.4 Toughening mechanism
For single-phase alloy, increasing the plastic zone of crack tip consumed more plastic deformation work, and thus enhanced the fracture toughness [21]. The width of plastic zone of crack tip for plane strain is determined by [22]
 (2)
(2)
where r0 is the width of plastic zone of crack tip, and ��s is the yield strength. The yield strength of TC21 alloy was 1095-1522 MPa, while KIC was 49.9-83.3 MPa��m1/2 [23]. Assuming that the sizes of the plastic zones for �� and �� phases were the same, the calculated minimum width of plastic zone of crack tip for TC21 alloy was 28 ��m, which was much larger than the thickness of �� plates, and the maximum value was 1.06 ��m in the present study. Therefore, the plastic zone consisted of plenty of �� plates.
As for the influence of thickness of �� plates on the fracture toughness, it is assumed that the content of �� plates kept constant and the direction for crack propagation was perpendicular to �� plates. When the crack propagated, the plastic zone of crack tip (Fig. 9(a)) formed under the action of stress field. Line A lay in the maximum of plastic zone in y-axis orientation. On the left of Line A, the plastic deformations for both �� and �� phases reached the maximum. The total energy consumed by this zone (��y) was considered as constant for �� plates with different thicknesses, because the content of �� plates was constant. On the right of Line A, when the crack further propagated, the plastic zone moved from Site 1 to Site 2 (Fig. 9(b)). The part participating in plastic deformation of every �� plate increased, with the maximum growth rate in the forefront of plastic zone. The addition of �� plate 2 was larger than that of �� plate 1.
XIAO [22] considered that �� phase was tough phase, which owned stronger ability to impede crack propagation. If �� phase in plastic zone was substituted by �� phase, the energy consumed by plastic zone could be increased. When the forefront of plastic zone entered �� plate, the energy increment consumed by �� plates with the thickness of d was G1; while for 2d, the increment was G1+G2, and G1+G2��2G1 (Fig. 9(c)). Therefore, thickening �� plates increased the energy consumed by the forefront of plastic zone and made the crack propagation difficult, thus the fracture toughness was enhanced.
When the thickness of �� plates increased to the same order of magnitude with the width of plastic zone, only one �� plate existed in the plastic zone (Fig. 9(d)). Additionally, thickening �� plate caused the increase of the content of �� phase in plastic zone. As a result, more energy (I in Fig. 9(d)) was consumed and the fracture toughness was improved.

Fig. 9 Influencing mechanism of thickness and content of �� plates on fracture toughness
GREENFIELD and MARGOLIN [24] found that the fracture toughness of Ti-5.25Al-5.5V-0.9Fe-0.5Cu alloy increased with the thickening of grain boundary �� layer with a range from 2.6 to 5.5 ��m, but remained constant when the thickness exceeded 5.5 ��m. This phenomenon was also explained by the mechanism proposed above. When the thickness of grain boundary �� layer (or �� plates, secondary �� platelets) was beyond the width of plastic zone, the consumed energy by plastic zone was no longer increased with regard to the thickness of grain boundary �� layer (or �� plates, secondary �� platelets) (Fig. 9(d)). Consequently, the fracture toughness did not increase any more.
The content of �� plates would be increased by elevating the number of �� plates with the same thickness (II in Fig. 9(f)) or thickening �� plates in fixed number (III in Fig. 9(f)). In this case, the content of �� plates in plastic zone of crack tip increased, which meant that more energy would be consumed by the plastic zone, resulting in the increase in the fracture toughness. Therefore, the fracture toughness could also be improved by increasing the content of �� plates.
Figure 10 shows the crack propagation route in FAC. The crack propagated either along ��/�� phase boundaries (red mark) or through the ��/�� phase boundaries (blue mark). When through the ��/�� phase boundaries, the crack alternately propagated in �� phase and �� phase (�� plate) with obvious plastic deformation on both sides.

Fig. 10 Crack propagation route for furnace cooling
4 Conclusions
1) With the increase of cooling rate from single �� phase field, the thickness of �� plates decreased. The content of �� plates decreased and the thickness increased as solution temperature was elevated. With the rising of aging temperature, the thickness of secondary �� platelets increased.
2) The content and thickness of �� plates and the thickness of secondary �� platelets were important microstructural features influencing the fracture toughness. Increasing the content of tough �� phase or thickening �� plates (secondary �� platelets) could enhance the fracture toughness.
3) Thickening �� plates (secondary �� platelets) increased the energy consumption in the forefront of plastic zone. Increasing the content of �� plates indicated that more energy was consumed by the plastic zone, which made crack propagation difficult and thus enhanced the fracture toughness.
References
[1] WANG Ke, LI Miao-quan. Characterization of discontinuous yielding phenomenon in isothermal compression of TC8 titanium alloy [J]. Transactions of Nonferrous Metals Society of China, 2016, 26: 1583-1588.
[2] FAN Xiao-guang, ZENG Xiang, YANG He, GAO Peng-fei, MENG Miao, ZUO Rui, LEI Peng-hui. Deformation banding in �� working of two-phase TA15 titanium alloy [J]. Transactions of Nonferrous Metals Society of China, 2017, 27: 2390-2399.
[3] BANERJEE D, WILLIAMS J C. Perspectives on titanium science and technology [J]. Acta Materialia, 2013, 61: 844-879.
[4] BOYER R R. An overview on the use of titanium in the aerospace industry [J]. Materials Science and Engineering A, 1996, 213: 103-114.
[5] ZHAO Yan-lei, LI Bo-long, ZHU Zhi-shou, NIE Zuo-ren. The high temperature deformation behavior and microstructure of TC21 titanium alloy [J]. Materials Science and Engineering A, 2010, 527: 5360-5367.
[6] ZHANG X M, ZHAO Y Q, ZENG W D. Effect of hydrogen on microstructure evolution and tensile properties of TC21 alloy [J]. Materials Science and Technology, 2011, 27: 214-218.
[7] ZHOU Wei, GE Peng, ZHAO Yong-qing, XIN She-wei, LI Qian, WANG Jing, HUANG Chao-wen, CHEN Jun. Relationship between mechanical properties and microstructure in a new high strength �� titanium alloy [J]. Rare Metal Materials and Engineering, 2017, 46: 2076-2079.
[8] ZHANG Yong-qiang, GUO Hong-zhen, LIU Rui, WANG Tao, ZHAO Zhang-long, YAO Ze-kun. Microstructure and mechanical properties of �� isothermal forged TC18 alloy [J]. Rare Metal Materials and Engineering, 2013, 42: 634-638. (in Chinese)
[9] FAN Zhong-yun. The grain size dependence of ductile fracture toughness of polycrystalline metals and alloys [J]. Materials Science and Engineering A, 1995, 191: 73-83.
[10] CHANDRA RAO B S S, SRINIVAS M, KAMAT S V. The effect of volume fraction of primary �� phase on fracture toughness behavior of Timetal 834 titanium alloy under mode I and mixed mode I/III loading [J]. Materials Science and Engineering A, 2009, 520: 29-35.
[11] FILIP R, KUBIAK K, ZIAJA W, SIENIAWSKI J. The effect of microstructure on the mechanical properties of two-phase titanium alloys [J]. Journal of Materials Processing Technology, 2003, 133: 84-89.
[12] LEE E. Microstructure evolution and microstructure/mechanical properties relationships in ��+�� titanium alloys [D]. Columbus: The Ohio State University, 2004: 1-3.
[13] SHI Zhi-feng, GUO Hong-zhen, QIN Chun, LIANG Hou-quan, YAO Ze-kun. A method to determine main microstructural features influencing mechanical properties of two-phase titanium alloys [J]. Materials Science and Engineering A, 2014, 611: 136-141.
[14] SAUER C, L��TJERING G. Influence of �� layers at �� grain boundaries on mechanical properties of Ti-alloy [J]. Materials Science and Engineering A, 2001, 319-321: 393-397.
[15] GUO Ping, ZHAO Yong-qing, ZENG Wei-dong, HONG Quan. The effect of microstructure on the mechanical properties of TC4-DT titanium alloys [J]. Materials Science and Engineering A, 2013, 563: 106-111.
[16] WANG Jin-you, FU Zuo-yi, DUAN Jun, WANG Xiao-zhou, HU Da-wei. Influence of microstructure on fracture toughness of Ti-1023 titanium alloy [C]//Proceedings of the Sixth National Symposium on Titanium and Titanium Alloys. Beijing: Atomic Energy Press, 1987: 187-192. (in Chinese)
[17] RICHARDS N L, BARNBY J T. The relationship between fracture toughness and microstructure in alpha-beta titanium alloys [J]. Materials Science and Engineering, 1976, 26: 221-229.
[18] RICHARDS N L. Quantitative evaluation of fracture toughness- microstructural relationships in alpha-beta titanium alloys [J]. Journal of Materials Engineering and Performance, 2004, 13: 218-225.
[19] FAN J K, LI J S, KOU H C, HUA K, TANG B. The interrelationship of fracture toughness and microstructure in a new near �� titanium alloy Ti-7Mo-3Nb-3Cr-3Al [J]. Materials Characterization, 2014, 96: 93-99.
[20] SHI Xiao-hui, ZENG Wei-dong, SHI Chun-ling, WANG Hao-jun, JIA Zhi-qiang. The fracture toughness and its prediction model for Ti-5Al-5Mo-5V-1Cr-1Fe titanium alloy with basket-weave microstructure [J]. Journal of Alloys and Compounds, 2015, 632: 748-755.
[21] MA Ying-jie, XUE Qi, WANG Hao, HUANG Sen-sen, QIU Jian-ke, FENG Xin, LEI Jia-feng, YANG Rui. Deformation twinning in fatigue crack tip plastic zone of Ti-6Al-4V alloy with Widmanstatten microstructure [J]. Materials Characterization, 2017, 132: 338-347.
[22] XIAO Ji-mei. Toughness and toughening of metals [M]. Shanghai: Shanghai Scientific & Technical Publishers, 1982: 109-315. (in Chinese)
[23] SHI Zhi-feng. Researches on processing optimization and microstructure-property relationship of TC21 titanium alloy [D]. Xi��an: Northwestern Polytechnical University, 2016. (in Chinese)
[24] GREENFIELD M A, MARGOLIN H. The interrelationship of fracture toughness and microstructure in a Ti-5.25Al-5.5V-0.9Fe- 0.5Cu alloy [J]. Metallurgical Transactions, 1971, 2: 841-847.
Ƭ״��֯TC21�ѺϽ������֯-�������Թ�ϵ���ͻ�����
ʯ־��1,2��������2���Ž�ΰ1��������3
1. �����о���Ժ ���²����о��������� 100081��
2. ������ҵ��ѧ ����ѧԺ������ 710072��
3. �й����пƼ���������˾ ս�Է�չ�������� 100081
ժ Ҫ���о�����֯������Ƭ״��֯TC21�ѺϽ�������Ե�Ӱ�졣ͨ�������ȴ������Ƭ״��֯��������OM��SEM����������֯���б���������������ȴ���ʺ��������Ĺ����¶Ⱦ�����Ƭ�ijߴ缰��������ʱЧ�¶�����Ҫ���ƴ�����Ƭ��������Ϊ����Ƭ����������Լ�������Ƭ�����Ӱ��TC21�ѺϽ�������Ե���Ҫ��֯��������ߦ�Ƭ���������Ӧ�Ƭ(�������Ƭ)��Ⱦ������TC21�ѺϽ�Ķ������ԡ����ڦ�Ƭ���Ƽ���������������ģ�����ѺϽ��ͻ����ơ�
�ؼ��ʣ��ѺϽ�Ƭ״����֯���������ԣ����Ƽ�����������ͻ�����
(Edited by Wei-ping CHEN)
Corresponding author: Zhi-feng SHI; Tel: +86-10-62181009; E-mail: titansmith@163.com
DOI: 10.1016/S1003-6326(18)64890-3
Abstract: The independent influence of microstructural features on fracture toughness of TC21 alloy with lamellar microstructure was investigated. Triple heat treatments were designed to obtain lamellar microstructures with different parameters, which were characterized by OM and SEM. The size and content of �� plates were mainly determined by cooling rate from single �� phase field and solution temperature in two-phase field; while the precipitation behavior of secondary �� platelets was dominantly controlled by aging temperature in two-phase field. The content and thickness of �� plates and the thickness of secondary �� platelets were important microstructural features influencing the fracture toughness. Both increasing the content of �� plates and thickening �� plates (or secondary �� platelets) could enhance the fracture toughness of TC21 alloy. Based on energy consumption by the plastic zone of crack tip in �� plates, a toughening mechanism for titanium alloys was proposed.
