

Environmental contamination and health hazard of lead and cadmium around Chatian mercury mining deposit in western Hunan Province, China
SUN Hong-fei(����)1, 2, LI Yong-hua(������)1, JI Yan-fang(����)1,
YANG Lin-sheng(������)1, 2, WANG Wu-yi(����һ)1, LI Hai-rong(���)1
1. Institute of Geographic Sciences and Natural Resources Research,
Chinese Academy of Sciences, Beijing 100101, China;
2. Graduate School of Chinese Academy of Sciences, Beijing 100039, China
Received 16 February 2009; accepted 15 June 2009
Abstract:
A field survey concerning lead and cadmium pollution in environment mediums and hair samples around the Chatian mercury mining deposit in western Hunan Province, China, was conducted to preliminarily evaluate their health hazard to local inhabitants. The results show that mining wastes, especially tailing, contain high cadmium level with the maximum of 79.92 ��g/g. High levels of lead and cadmium are accumulated in surface water and paddy soil, respectively, and both metals pollution occurs in brown rice. The average daily intake dose(ADD) of lead for local adults via three routes reaches up to 7.7 ��g/(kg��d), exceeding the provision tolerable daily intake by JECFA of 3.5 ��g/(kg��d), and drinking water exposure route contributes the highest daily intake. As an indicator for heavy metal exposure, the hair of local population contains Pb (5.06��3.02) ��g/g. The average daily intake dose of cadmium for adults is 0.119 ��g/(kg��d). More attention must be paid on health risk from lead pollution compared with cadmium.
Key words:
average daily intake dose; cadmium; lead; mercury mine area;
1 Introduction
Mining, processing and smelting of heavy metals are important sources leading to heavy metals contamination[1-4]. Besides a target heavy metal, co-existing metal elements are usually released from underground environment because nonferrous heavy metal rarely exists singly. By-product heavy metals around metal mine have caused increasing concern. It was reported that soil and vegetables were heavily polluted by lead (Pb) and Cd near a smelter producing Pb in the suburb of Nanning, the Capital of Guangxi Province in southern China[5]. Researches found that the maximum Cd content in rice, irrigated by mercury contaminated mining water from Diwalwal gold mining centre, Philippines, reached up to 1.03 ��g/g[6]. Health risks of population exposed to heavy metals were rarely evaluated and those evaluations were limited to some single exposure routes such as vegetable consumption or inhalation[7]. Integrated health risks of heavy metals through various exposure pathways were of significance for inhabitants living in mining area.
Chatian mercury mining deposit(CMD) is the most important mine of western Hunan Province mercury belt in China, where the geological reserve accounts for 50% of Chinese total mercury. CMD produced 800- 1 000 t/a at its peaks in 1950-1980, after then mercury output decreased. In western Hunan Province mercury belt, there are several nonferrous heavy metal mines such as lead/zinc mine, selenium mine taking on a cross distribution with mercury mine. Previous study showed that heavy mercury pollution was observed in Pb/Zn mine area located in adjacent town in Fenghuang County[8]. Elevated Pb concentration was also found in field soil in CMD mine area[9]. Considering that Cd usually co-exists with Pb, Zn and Hg, it is necessary and important to investigate Pb and Cd pollution in Chatian mine area.
The main objectives of this work are: 1) to delineate Pd and Cd contamination in the Chatian Hg mine area through soil, mine tailing, water, paddy plant, and human hair analyses; 2) to assess health risk to local population produced by Pd and Cd pollution via oral exposure routes.
2 Materials and methods
2.1 Study site
The CMD (109?20��30��-109?21��30��E, 27?46��00��- 27?48��00��N) is located in Chatian town, Fenghuang County in western Hunan Province, China (Fig.1). Its climate represents a typical subtropical humid monsoon with annual average temperature of 13-18 �� and annual rainfall of 1 100-1 500 mm. The area is geological part of the Yangtze plain on the eastern slopes of Yungui plateau, and its bedrock is primarily made up of carbonaceous shale, argillaceous limestone or thin-layered and laminated fine-grained dolomite of the Middle unit of Cambrian age[9]. Rice is the major crop growing in this area.
2.2 Sampling
For studying translocation and accumulation of heavy metals in soil-paddy system, 18 sets of paddy plants and their corresponding rhizosphere soil were sampled in match. 13 water samples were sampled, including three drinking water samples from mountain stream and 10 samples used as irrigation or washing water, from reservoir, ditch and paddy field. Seven mine-wastes were collected from discarded piles. 15 hair samples were collected from local grown-up inhabitants in Hehui village for a better understanding of the health response to Pb and Cd exposure, 10 of which were from males aged 36-59 and the others were from females aged 25-48. All samples were sealed in polyethylene bags. The sampling sites in the CMD were shown in Fig.1.

Fig.1 Illustration of sampling sites in Chatian mercury mine area in Hunan Province, China
2.3 Sample preparation and analysis
Paddy plants were rinsed with de-ionized water several times to remove external attached soil particles. After that, the plants were separated into 4 parts (root, stalk, leaves and rice grain without hull, namely brown rice), and then they were cut into small pieces. All plant samples were oven dried at 40 �� for 48 h, ground, sieved at a size less than 50 ��m, thoroughly mixed and stored in sealed polyethylene bottles. Hair samples were soaked with 1% subjective heat surfactant for 30 min, and then rinsed with de-ionized water and cleaned using an ultrasonic bath to remove surface debris, finally air-dried at room temperature. All biological sub-samples were digested with HNO3 (65%, volume fraction) overnight at room temperature, then digested by HNO3?HCl (3?1) with boiling bath for 2 h.
Soil and mine waste samples were air-dried and ground to pass through 2 mm nylon sieve mesh. Sub-samples were ground in an agate vibrating-cup mill to pass a 150-mesh nylon sieve. These samples were digested in solution with a 5?1 ratio of nitric acid and perchloric acid. Then the digested substances were dissolved with nitric acid of 1%. Water samples were collected in pre-cleaned polyethylene bottles adding 1% (V/V) of HCl and stored at 4 �� before laboratory processing.
Water samples and above digests were stored at 4 �� and analyzed by inductively coupled plasma-mass spectrometer (ICP-MS, Perkin-Elmer). Duplicates, blanks and standard reference materials (GSV-1, GSV-2,GSV-3; GSH-1; GBW07404, GBW07405, GBW08607) were used for quality control of rice plant, hair, soil and water analysis. The precision and bias of the chemical analysis are less than 10%.
2.4 Risk assessment
In this study, health risk assessment of Pb and Cd mainly focused on the two stages of exposure assessment and risk characterization. During the exposure assessment stage, an average daily intake dose(ADD, ��g/(kg��d)) is used to quantify the oral exposure dose of deleterious substances. Hazard quotient(HQ) or hazard index(HI), a ratio of estimated exposure dose(ADD) and reference dose(RfD), characterizes the health risk of non-carcinogenic adverse effects due to exposure to toxicants. In general, reference dose(RfD) is a toxicity indices of a daily exposure to the population (including sensitive subgroups) that is likely to be without an appreciable risk of deleterious effects during a lifetime. Since many of lead��s health effects may occur without overt signs of toxicity, the Agency��s RfD Work Group considered it inappropriate to develop an RfD for inorganic lead[10].
Based on numerous medical observation and scientific research, IARC classified Pb and Cd to be B2 and B1 of cancer group separately, that is to say, non-carcinogenic to human[11]. The USEPA has established the oral reference dose(RfD) for cadmium in drinking water at 0.5 ��g/(kg��d) and in food at 1 ��g/(kg��d) [12]. Due to no oral reference dose of Pb, 3.5 ��g/(kg��d) of provision tolerable daily intake(PTDI) by the joint FAO/WHO Expert Committee on Food Additives[13] is used to be reference value in order to elaborate Pb health hazard in Chatian mine area. The equations used into risk assessment are as follows:
HI=��HQ; HQ=ADD/RfD
ADD=C��IR��ED��EF/BM��AT
where the definition of HI, HQ, ADD and RfD is forenamed; C, IR, ED, BM, EF and AT are mercury content(��g/g), ingestion rate, exposure duration, reference body mass, exposure frequency and average time, respectively; and the values of these parameters are listed in Table 1.
Table 1 Parameters used in risk assessment
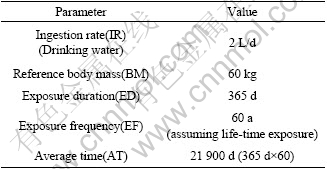
The daily consumption of cereals for field labor is 500 g recommended by Chinese Nutrition Society. In this study area, 500 g of rice as main food source is assumed to be consumed daily. 100 mg/d of direct soil ingestion rate, recommended by Massachusetts Department of Environmental Protection(MDEP) for utility/heavy construction workers, is chosen for local field labors considering regular farm activities such as transplanting rice seedlings, fertilizing and plough in paddy field [14-16].
3 Results and discussion
3.1 Lead and cadmium level in mining wastes
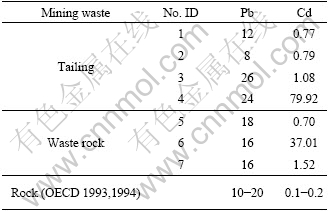
In this study area, tailing and waste rock were usually open stacked without disposal. Lead and cadmium concentrations in tailing and waste rock samples are listed in Table 2. The results found that Pb level in mining wasters was within range of earth crust [17], while Cd content varied largely from 0.70 to 79.92 ��g/g, significantly higher than 0.1-0.2 ��g/g of the earth crust[18]. It could be inferred that Cd in mining wastes would pose huge risk to around environment. Necessarily note that more Cd would be released from tailing than waste rock because tailing had been ground to have larger specific area, can be more easily weathered in ground surface environment. So stacked tailing should be given priority to effective measures to forbid Cd pollution to environment.
Table 2 Heavy metals concentrations in tailing and waste rock in mercury mining area (��g��g-1)
3.2 Lead and cadmium level in ground water
Lead and cadmium contents in all water samples varied from 0.063 to 0.229 mg/L and 0.001 to 0.004 mg/L, respectively (listed in Table 3). Almost all non-drinking water samples used as irrigation water coming from reservoir and bourne, or directly collected from paddy field exceeded 0.1 mg/L Pb of limited value ruled by Standard for Irrigation Water Quality, China, excluding one used as washing water (0.063 mg/L)[19]. Cd contents in all non-drinking water samples were lower than 0.005 mg/L of limited value. The natural concentration of Pb in surface water was estimated to be 0.02 ��g/L[20]. According to the information of Pb level in mine wastes, it could be inferred that background Pb content in local surface water was not too high. So high Pb level in surface water suggested that heavy Pb contamination had occurred while no heavy Cd pollution had been found in Chatian mercury mine area.
Table 3 Pb and Cd contents in all water samples (mg��L-1)
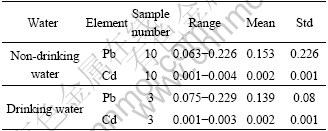
No significant difference between Pb and Cd levels in non-drinking water and drinking water had been observed. For local residents, average Pb content in drinking water was (0.139��0.080) mg/L, higher than the limited value (0.01 mg/L) regulated by WHO[20]. Cd content in drinking water samples averaged (0.002�� 0.001) mg/L and one of them had 0.003 1 mg/L of Cd, a little higher than 0.003 mg/L recommended by WHO[21]. Pb posed much more health risk to local population than Cd via drinking water ingestion.
3.3 Lead and cadmium levels in soil and plant
Soil Cd and Pb contents in different sample sites varied considerably in rice fields because of anthropogenic disturbance (shown in Figs.2 and 3). Cd in paddy rhizosphere soils ranged from 0.53 to 14.91 ��g/g, geometric mean 1.05 ��g/g, and Pb level varied with a range of 37 to 129 ��g/g, geometric mean 48.24 ��g/g. Cd in all soil samples exceeded 0.3 ��g/g of the maximum permissible level specified in soil Cd stage �� rule according to China Environmental Quality for Soils[22]. Only two soil samples had obviously high Pb content (103 ��g/g and 129 ��g/g), but still lower than 300 ��g/g of the limited value in Pb stage �� ruled by China Environmental Quality for Soils, and the other soil samples had the low content within the range of background value. This meant that heavy Cd contamination existed in local paddy soil and Pb pollution was relatively not so heavier.
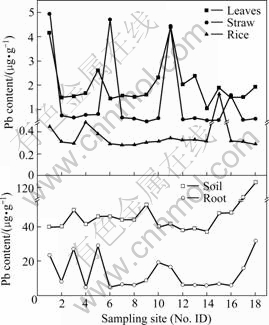
Fig.2 Lead content in rice plant and corresponding rhizosphere soil
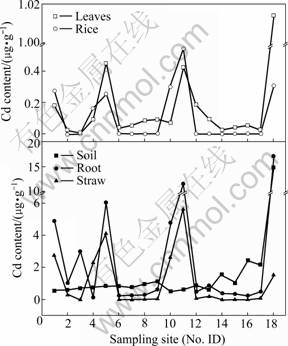
Fig.3 Cadmium content in rice plant and corresponding rhizosphere soil
Pb and Cd level in brown rice are seen in Figs.2 and 3, respectively. Pb content in all brown rice varied in a range of 0.28 to 1.63 ��g/g, higher than 0.20 ��g/g of permissible maximum value regulated by Sanitation Criterion for Food, China[23]. Five of all rice samples had 0.25-0.54 ��g/g of Cd, higher than 0.20 ��g/g of allow-able Cd value in rice[23], and the others were 0.001 ��g/g. It was reported that a worldwide geometric mean of Pb and Cd was 0.016 ��g/g and 0.02 ��g/g, separately[24]. Compared with them, brown rice in Chatian mine area contained 22.44 times greater Pb level.
Transfer factor (TF) was usually used to describe transfer ability of heavy metals from soil to plant, which was the ratio of heavy metal content in plant root with that in soil. TFPb varied from 0.1 to 0.63 while TFCd ranged from 0.09 to 18.82, with geometric mean 0.92, and eight TFCd of all samples exceeding 1.0. The transfer ability of Cd was obviously higher than that of Pb, accordance with other researches[25]. The Pb distribu- tion in tissues of rice plant was classified in this order: root��leaf��straw��brown rice, while Cd was root��straw��leaf��brown rice. The ratio of Pb and Cd in various tissues was separately 31.76?3.34?4.95?1 and 29.4?10.9?1.6?1, which suggested that transfer ability of Cd was also higher than that of Pb in rice plant.
Interesting points were that all soil samples had high Cd level and parts of rice grain had elevated Cd contents, while all soil Pb content was within the normal range and Pb content in rice totally exceeded permissible maximum value ruled by Sanitation Criterion for Food, China. Moreover, the transfer ability of Cd in soil-plant system and in various tissues was higher than that of Pb. So it was presumed that rice plants possibly absorbed granules containing Pb from atmosphere.
Correlation analysis (Tables 4 and 5) found that Pb and Cd in rice root separately significantly positively correlated with that in their corresponding rhizosphere soil (p��0.05), which implied that rhizosphere soil was the main source of Pb and Cd in rice root. As can be seen in Table 4, significantly positive correlation existed between Cd in rice leaves and that in rhizosphere soil (p��0.05). Moreover, significantly positive correlation was also found among rice root, rice straw, rice leaves and brown rice (p��0.05). Based on these statistic analyses, it could be inferred that Cd in rice plants was primarily less influenced by polluted irrigation water and atmospheric deposition, primarily came from soil and transferred between various tissues of rice plants. For Pb, only significantly positive correlation occurred between rice straw and rice leaves, which supported this assumption that rice leaves possibly absorbed granules containing Pb from atmosphere.
Table 4 Correlation matrix of Cd content in soil and different tissues of rice plant (n=18)
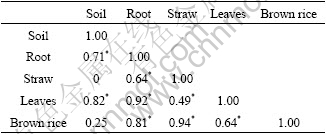
* Significantly correlated (p��0.05).
Table 5 Correlation matrix of Pb content in soil and different tissues of rice plant (n=18)
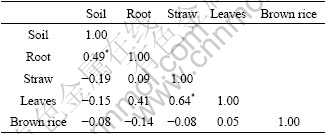
* Significantly correlated (p��0.05).
3.4 Pb and Cd level in hair
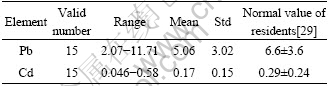
Hair analysis is a valuable indicator for estimating long-term heavy metals exposure, especially for lead, cadmium, arsenic, and mercury[26-28]. Pb and Cd contents in China residents averaged separately (6.6��3.6) ��g/g (2 466 cases) and (0.29��0.24) ��g/g (959 cases), estimated by QIN from available documents[29]. The upper normal limited value of Pb and Cd level in hair, recommended by Qin was 10.5 ��g/g and 0.5 ��g/g, separately. In this study (see Table 6), it was demonstrated that Pb in local residents ranged between 2.07 and 11.71 ��g/g with mean of (5.06��3.02) ��g/g, and Cd level in hair varied from 0.046 to 0.58 ��g/g, with mean of (0.17��0.15) ��g/g, which was separately lower than (8.21��5.59) ��g/g, and (0.91��0.61) ��g/g of average Pb and Cd levels in population living in Miasteczko ?lcaskie, near the largest Zn plant in Poland[30].
Table 6 Heavy metals contents in hair of local population (��g��g-1)
3.5 Daily intakes via various exposure pathways
Average daily intake dose (ADD) of Pb via drinking water and rice consumption separately reached up to 4.63 ��g/(kg��d) and 2.99 ��g/(kg��d) (Table 7). Only ADD of adults through drinking water ingestion exceeded 3.5 ��g Pb /(kg��d) of provision tolerable daily intake (PTDI) by the joint FAO/WHO Expert Committee on Food Additives (JECFA)[13]. Taking rice consumption and soil ingestion into account, the ADD via oral exposure of Pb was 7.7 ��g/(kg��d), 2.35 times of PTDI. In general, food ingestion, adding dust/soil ingestion for Pb, is the primary exposure to Pb for inhabitants without occupational exposure while daily intake from drinking water is less[31]. However, for adults in Chatian mine area, average daily intake dose from drinking water route was the highest; food consumption route was the next. ADD of Cd via drinking water and rice consumption was separately 0.067 ��g/(kg��d) and 0.05 ��g/(kg��d) (Table 8). Health quotient (HQ) of both these exposure pathway was separately 0.133 and 0.05. Adding soil ingest, health index(HI) of local adult population appeared to be 0.185. These three exposure routes would not cause health riskof adverse effect.
Table 7 Daily Pb intake of local population via various exposure pathways
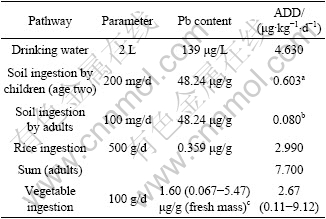
a, assuming children aged two with 16 kg body mass; b, assuming average adults with 60 kg body mass; c, data from ZHENG et al, 2007.
Table 8 Daily Cd intake of local population via various exposure pathways
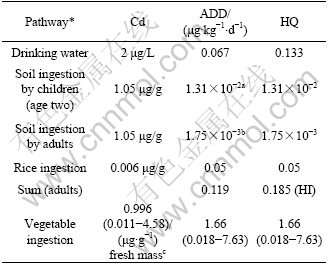
* Parameter value seen in Table 7; a, assuming children aged two with 16 kg body mass; b, assuming average adults with 60 kg body mass; c, data from ZHENG et al, 2007.
Vegetable ingestion is also important oral exposure route to Pb and Cd. Both heavy metals contents of edible parts of 20 vegetables around zinc smelter in Huludao of China were listed into Table 7 and Table 8, where Pb and Cd content of top soil were 319.6 ��g/g and 36.2 ��g/g, respectively[7]. The corresponding average Pb and Cd daily intakes dose of adults reached 2.67 ��g/(kg��d) and 1.66 ��g/(kg��d). Because of far less Pb and Cd content of field soil in this study area than that around zinc smelter in Huludao, China with higher activity, bio-accessible characterization of heavy metals, it was supposed that Pb and Cd content of local vegetables should be much lower than that in Table 7 and Table 8.
Risk evaluation via incidental direct soil/dust ingestion exposed to heavy metals was considered to be an important part of hazard assessment, especially for young children with regular hand-mouth activity. Average incidental Pb and Cd daily intake dose of children aged two was separately 0.165 ��g/(kg��d) and 3.60��10-3 ��g/(kg��d), higher than 0.08 ��g/(kg��d) of adults and 1.75��10-3 ��g Cd/(kg��d) of adults, separately. Compared with other researches, 48.24 ��g/g of Pb in soil/dust was still lower than 857 ��g/g and 333 ��g/g of that in London and central London and rural Suffolk[32]. The actual dust/soil Pb content in inhabitants�� home should be less than that in field because rice field had less distances with mercury mine, more easily influenced by mining activities than village.
4 Conclusions
Pb and Cd contamination with a different extent occurred in Chatian mercury mine area in western Hunan Province, China. The results were as follows:
1) Cd level in mining waste, especially in tailing, was much high (with the maximum content of 79.92 ��g/g) and posed huge risk to around environment.
2) Surface water, including irrigation water and drinking water, and paddy soil contained high level of Pb and Cd respectively. And both metals pollution occurred in brown rice, relatively heavier for Pb.
3) Average daily intake dose (ADD) of Pb for adults via oral ingestion including drinking water and rice consumption, incidental soil ingestion reached 7.7 ��g/(kg��d), whereas ADD of Cd for adults via the three routes was 0.119 ��g/(kg��d) and the hazard index (HI) was 0.185.
Therefore, it was concluded that Pb pollution caused huge health risk for local population in Chatian mercury mining deposit. Taking together, more attention must be paid on Pb pollution and necessary measures need to be taken immediately to reduce human health risk.
[1] YANG Q W, SHUA W S, QIU J W, WANG H B, LAN C Y. Lead in paddy soils and rice plants and its potential health risk around Lechang Lead/Zinc Mine, Guangdong, China [J]. Environment International, 2004, 30: 883-889.
[2] JUNG M C, THORNTON I. Environmental contamination and seasonal variation of metals in soils, plants and waters in the paddy fields around a Pb-Zn mine in Korea [J]. Science of the Total Environment, 1997, 198: 105-121.
[3] TAYLORA H, APPLETON J D, LISTER R, SMITH B, CHITAMWEBA D, MKUMBO O, MACHIWA J F, TESHA A L, BEINHOFF C. Environmental assessment of mercury contamination from the Rwamagasa artisanal gold mining centre, Geita District, Tanzania [J]. Science of the Total Environment, 2005, 343: 111-133.
[4] HORVAT M, NOLDE N, FAJON V, JEREB V, LOGAR M, LOJEN S, JACIMOVIC R, FALNOGA I, LI Y Q, FAGANELI J, DROBNE D. Total mercury, methylmercury and selenium in mercury polluted areas in the Province Guizhou, China [J]. Science of the Total Environment, 2003, 304: 231-256.
[5] CUI Y L, ZHU Y G, ZHAI R H, CHEN D Y, HUAN Y Z, QIU Y, LIANG J Z. Transfer of metals from soil to vegetables in an area near a smelter in Nanning, China [J]. Environment International, 2004, 30: 785-791.
[6] APPLETON J D, WEEKS J M, CALVEZ J P S, BEINHOFF C. Impacts of mercury contaminated mining waste on soil quality, crops, bivalves, and fish in the Noboc River area, Mindana, Philippines [J]. Science of the Total Environment, 2006, 354: 198-121.
[7] ZHENG N, WANG Q C, ZHENG D M. Health risk of Hg, Pb, Cd, Zn, and Cu to the inhabitants around Huludao Zinc Plant in China via consumption of vegetables [J]. Science of the Total Environment, 2007, 383: 81-89.
[8] LI Y H, JI Y F, YANG L S, LI S J. Effects of mining activity on heavy metals in surface water in lead-zinc deposit area [J]. Journal of Agro-Environment Science, 2007, 26(1): 103-107. (in Chinese)
[9] LI Y H, YANG L , JI Y F , SUN H F, WANG W Y. Quantification and fractionation of mercury in soils from the Chatian mercury mining deposit, Southwestern China [J]. Environmental Geochemistry and Health, 2009, 31: 617-628.
[10] USEPA (U.S. Environmental Protection Agency). Health effects assessment for lead [R]. EPA/540/1-86/055. NTIS PB85-163996/AS. Washington DC, 1984.
[11] IARC (International Agency for Research on Cancer). Overall evaluations of carcinogenicity: an updating of IARC. Monographs on the evaluation of carcinogenic risks to humans [R]. Lyon, 1987, 1-421: 39-142; 230-232.
[12] USEPA (U.S. Environmental Protection Agency). IRIS (Integrated Risk Information System): Risk assessment guidelines, cadmium (CASRN 7440-43-9) [EB/OL]. http://cfpub.epa.gov/ncea/iris/index. cfm?fuseaction=iris.Show Quick View & substance_nmbr=0141.
[13] JECFA. Evaluation of certain food additives and contaminants: Forty-first report of the Joint FAO/WHO expert committee on food additives [R]. WHO Technical Report Series, No.837. Geneva: World Health Organization (WHO), 1993.
[14] PORTER J W. Memorandum to regional administrators, Regionl-X, regarding interim final guidance on soil ingestion rates [R]. USEPA Office of Solid Waste and Emergency Response. Jan, 27, 1989.
[15] EDWARD J C, RAMON B, PENELOPE P. Soil ingestion in adults�� Results of a second pilot study [J]. Ecotoxicology and Environmental Safety, 1997, 36: 249-257.
[16] MDEP (Massachusetts Department of Environmental Protection). Guidance for disposal site risk characterization (Appendix B): Calculation of an enhanced soil ingestion rate [R]. Massachusetts: Office of Research and Standards, 1995.
[17] OECD (Organization for Economic Cooperation and Development). Cadmium-background and national experience with reducing risks [R]. Paris: Risk Reduction Monograph, 1994, 5: 195.
[18] OECD (Organization for Economic Cooperation and Development). Lead-background and national experience with reducing risks [R]. Paris: Risk Reduction Monograph, 1993, 1: 277.
[19] NEPAC (National Environmental Protection Agency of China). Standards for irrigation water quality [S]. 1992: 504-1992. (in Chinese)
[20] IPCS (International Programme on Chemical Safety). Environmental health criteria 85: Inorganic lead [R]. Geneva: World Health Organization (WHO), 1995.
[21] IPCS (International Programme on Chemical Safety). Environmental health criteria 134: Cadimum [R]. Geneva: World Health Organization (WHO), 1992.
[22] NEPAC (National Environmental Protection Agency of China). Environmental quality of standard for soils [S]. GB15618��1995, 1995. (in Chinese)
[23] NEPAC (National Environmental Protection Agency of China). Maximum levels of contaminants in foods [S]. GB2762��2005, 2005. (in Chinese)
[24] WATANABE T, NAKATSUKA H, IKEDA M. Cadmium and lead in rice available in various areas of Asia [J]. Science of the Total Environment, 1989, 80: 175-184.
[25] LI Y, WANG Y B, GOU X, SU Y B, WANG G. Risk assessment of heavy metals in soils and vegetables around non-ferrous metals mining and smelting sites, Baiyin, China [J]. Journal of Environmental Sciences, 2006, 18(6): 1124-1134.
[26] USEPA (U.S. Environmental Protection Agency). Toxic trace metals in Mammalian hair and nails [R]. EPA Report No. 600/4-79-049, 1979. Washington DC, 1979.
[27] WILHELM M, LOMBECK I, OHNESORGE F K. Cadmium, copper, lead and zinc concentrations in hair and toenails of young children and family members: a follow-up study [J]. Science of the Total Environment, 1994, 141: 275-280.
[28] MORTADA W I, SOBH M A, EL-DEFRAWY, M M, FARAHAT S E. Reference intervals of cadmium, lead, and mercury in blood, urine, hair, and nails among residents in Mansoura city, Nile delta, Egypt [J]. Environmental Research, 2002, 90: 104-110.
[29] QIN J F. The upper limit of normal value of hair Pb, Cd, As, Hg in Chinese resident [J]. Guangdong Trace Elements Science, 2004, 1(4): 29-37. (in Chinese)
[30] CH?OPICKA J, ZACHWIEJA Z, ZAGRODZKI P, FRYDRYCH J, SLOTA P, KRO?NIAK M. Lead and cadmium in the hair and blood of children from a highly industrial area in Poland [J]. Biological Trace Element Research, 1998, 62(3): 229-234
[31] WHO (World Health Organization). Toxicological evaluation of certain food additives and contaminants [M]. Cambridge: Cambridge University Press, 1989: 163-219.
[32] STREHLOW C D, BARLTROP D.Temporal trends in urban and rural blood lead concentrations [J]. Environmental Geochemistry and Health, 1987, 9: 74-79.
Foundation item: Project(40571008) supported by the National Natural Science Foundation of China; Project(KZCX3-SW-437) supported by Knowledge Innovation Programs of the Chinese Academy of Sciences
Corresponding author: LI Yong-hua; Tel: +86-10-64889060; E-mail: yhli@igsnrr.ac.cn
DOI: 10.1016/S1003-6326(09)60139-4
(Edited by YUAN Sai-qian)
