

J. Cent. South Univ. (2021) 28: 618-632
DOI: https://doi.org/10.1007/s11771-021-4626-9

Field measurement of strain response for typical asphalt pavement
PAN Qin-xue(����ѧ)1, ZHENG Ce-ce(֣�߲�)1, LU Song-tao(������)1, QIAN Guo-ping(Ǯ��ƽ)1, ZHANG Jun-hui(�ž���)1, WEN Pi-hua(��ا��)2, MILKOS Borges Cabrera1, ZHOU Huai-de(�ܻ���)1
1. Key Laboratory of Road Structure and Material of Ministry of Transport (Changsha), School of Traffic and Transportation Engineering, Changsha University of Science & Technology, Changsha 410114, China;
2. School of Engineering and Materials Science, Queen Mary University of London, London E1 4NS, UK
 Central South University Press and Springer-Verlag GmbH Germany, part of Springer Nature 2021
Abstract:
In order to reveal the changing law of the mechanical response of asphalt pavements under the action of vehicle load and provide references for the design of durable pavements, three typical asphalt pavement structures with flexible base (S1), combined base (S2), and semi-rigid base (S3) were selected to perform field strain tests under static and dynamic load using the fiber Bragg grating optical sensing technology. The changing characteristics of the strain field along the horizontal and depth directions of pavements were analyzed. The results indicate that the most unfavorable asphalt pavement layers were the upper-middle surface layer and the lower base layer. In addition, the most unfavorable loading positions on the surface layer and the base layer were the center of wheel load and the gap center between two wheels, respectively. The most unfavorable layer of the surface layers gradually moved from the lower layer to the upper layer with the increase of base layer modulus. The power function relationships between structural layer strain and vehicle speed were revealed. The semi-rigid base asphalt pavement was the most durable pavement type, since its strain value was lower compared to those of the other structures.
Key words:
Cite this article as:
PAN Qin-xue, ZHENG Ce-ce, LU Song-tao, QIAN Guo-ping, ZHANG Jun-hui, WEN Pi-hua, MILKOS Borges Cabrera, ZHOU Huai-de. Field measurement of strain response for typical asphalt pavement [J]. Journal of Central South University, 2021, 28(2): 618-632.
DOI:https://dx.doi.org/https://doi.org/10.1007/s11771-021-4626-91 Introduction
Numerous studies [1-3] have demonstrated that the fatigue life of asphalt pavement is directly related to the tensile strain at the bottom of each structural layer, which has also been commonly used as one of the design indexes in the asphalt pavement design of many countries [4, 5]. Therefore, accurate and reliable testing methods that investigate the strain response characteristics of these structures are particularly important for the design of durable asphalt pavements.
In recent years, fiber Bragg grating (FBG) sensors have been widely used in the study of the pavement mechanical response because of their high sensitivity, small variability, and good cooperative deformation with the pavement structural layers [6-11]. For example, TAN et al [12] found that the strain value of each pavement structural layer increases with the decrease of vehicle speed and the increase of specific ground pressure, while the maximum strain value occurs at the middle surface layer. ASSOGBA et al [13, 14] analyzed the vehicle speed and load weight level effect on the dynamic response of semi-rigid base asphalt pavement, and they found that the tensile strain at the bottom of the asphalt layer is less than the critical strain of a conventional pavement structure with an ordinary asphalt mix. DONG et al [15] measured the strain of asphalt surface layers in three-directions, and the results showed that the strain response at the bottom of the structural layers decreases with the increase of vehicle speed. In addition, DONG et al [16, 17] measured the longitudinal and transverse dynamic strains at the bottom of semi-rigid base asphalt pavement layers. It was found that under dynamic loading, the longitudinal strain of the lower surface layer alternates both state tensile and compressive strain, while the transverse strain is relatively complex with significant differences among various load positions. ZHANG et al [18, 19] found that under dynamic loading, the tensile strain of the semi-rigid substrate is proportional to load and inversely proportional to vehicle speed. PAN et al [20, 21] developed theoretical models to determine the strain at the bottom of the pavement layers by changing the axle load and vehicle speed. The changing law from the compressive peak to tensile peak ratio of the dynamic longitudinal strain with vehicle speed was obtained. ALTARAWNEH et al [22] reported that the strain of flexible base asphalt pavement under static load increases with the increase of vehicle load. Based on field-measured data, PATRICIA et al [23] revealed that the strain duration curve in flexible base asphalt pavement alternates tensile and compressive characteristics. NOSENZ et al [24] established a nonlinear model for the strain in flexible base asphalt pavement layers changing the temperature. It was found that the peak strain increases with the increase of temperature. RAEESI et al [25] monitored the field performance of waste tire-based permeable pavements and obtained the strain evolution over time.
In the available literature, the strain response of pavement structures has been discussed from different angles. These studies have mainly focused on the qualitative and simple quantitative analysis of dynamic and static strains; hence there is a lack of a quantitative model to determine the change in strain with field load conditions, while they do not effectively unify the dynamic and static strains. Moreover, in most field strain tests, the loading point is fixed, and there are few systematic studies reporting field strain measurements at different points. Conducting strain response test at different loading positions has a significant effect on determining the accurate location of the most unfavorable load position and improving current asphalt pavement design methods based on the strain index of the layer bottom. Furthermore, most studies have focused on a single type of pavement structure. However, there are many types of asphalt pavements [26], among which the semi-rigid base asphalt pavement is the main structure in China, while the flexible base asphalt pavement is the main structure in Europe and America. Due to the difference in composition materials, compaction methods, and structural layer thicknesses [27, 28], there are significant differences between these pavement types; consequently, their strain responses cannot be easily unified. Therefore, it is necessary to perform a comparative study on the strain response characteristics of different typical pavement structures, analyze their similarities and differences, and draw some conclusions with strong universality.
In this paper, three typical asphalt pavement structures, namely, flexible base, combined base, and semi-rigid base, were selected to perform static and dynamic field strain tests at different load positions and under different vehicle speeds using the FBG optical sensing technology. The changing laws of strain response in the horizontal and depth directions of pavement were investigated. A unified model of strain response under dynamic and static loading with vehicle speed was developed based on the measured strain results. The advantages and disadvantages of the three pavement structures were analyzed based on the obtained result strain magnitude. The research results can provide a reference for the design of durable asphalt pavements.
2 Test scheme
2.1 Pavement structure of test section
Field tests were conducted on an expressway in China. Straight road sections with similar subgrade conditions were selected, on which flexible base asphalt (S1), combined base asphalt (S2), and semi-rigid base asphalt (S3) pavements were paved. The form and material composition of the tested sections and the compressive resilient modulus and Poisson ratio of the materials in each structural layer are presented in Figure 1. The compressive resilient modulus was obtained by the inverse calculation of the field bearing plate test. The construction of the test sections complied with the requirements of the Chinese Standard JTG F40-2004 [29]. The road materials included asphalt concrete (AC), asphalt-treated base (ATB), cement stabilized macadam (CSM), graded macadam (GM), and non-screening macadam (NSM).
2.2 Field sensor layout scheme
2.2.1 Sensor type
The FBG strain sensor (CB-FBG-EGE-100; standard distance: 8 cm) with embedded GFRP (glass fiber reinforced plastic) encapsulation was used to measure the longitudinal and transverse strains at the bottom of each structure layer. The FBG temperature sensor (FBG-IT-01) with sensitizing encapsulation was used to measure the temperature at each structural layer and compensate for the temperature of the strain sensor. The optical signal processing test equipment, included an FBG signal demodulator, laptop, and test system software.
2.2.2 Layout scheme
The sensor was embedded in the structure layer prior to construction. In other words, when the construction of the previous structural layer was completed, and a superficial loop groove was excavated on its surface immediately. Afterward, the sensor was embedded in the surface of the structural layer, and it was covered and compacted by a small amount of cement mortar or asphaltic sand. This way can make the sensor be accurately positioned and protected. This pre-embedding method can further reduce the area and depth of the excavation groove, while it does not affect the normal construction of the road surface and its continuity. This solves the contradiction between the sensor survival rate and pavement integrity. The layout of the sensors is shown in Figure 2. On the centerline of the wheel track belt, the longitudinal and transverse strain sensors were embedded at the bottom of each layer from the upper layer to the base layer, while the temperature sensors were embedded in the shoulder at the same horizontal position. The standard distance between the strain sensors in the same layer was 60 cm.

Figure 1 Three typical pavement structures
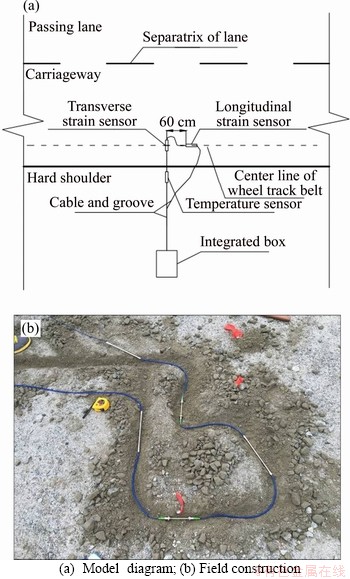
Figure 2 Sensor layout scheme:
2.3 Field test scheme
In order to capture the strain distribution of each structural layer at different loading positions under the same axial load, the strain duration curves were measured at seven characteristic points, namely, A (center of the gap between two wheels), B and B' (center of wheel load), C and C' (outer edge of wheel load), D and D' (lateral locations of wheel load). The waveform and peak values of the obtained curves were analyzed. The loading condition is shown in Figure 3. During the field test, the relative position between the sensor and wheel load can be altered by the parallel movement of the wheel load. A is the coincidence point of the gap center between two wheels and the center of the sensor; B and B' are the coincidence points of the center of single wheel and the center of the sensors; C and C' are the coincidence points of the lateral edge center of single wheel and the center of the sensors; and D and D' are the points located 40 cm away from the center of the gap between two wheels and the center of the sensors.
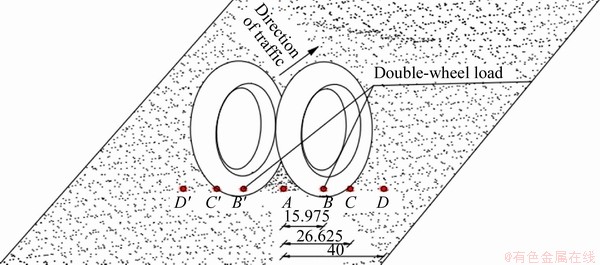
Figure 3 Schematic diagram of wheel load model (unit: cm)
A standard vehicle with a single axle and two wheels per side was selected as the test vehicle. In the test, the left rear wheel of the standard vehicle with a rear axle load of 100 kN weighed by an electronic scale was used to load directly. Considering the viscoelasticity of the asphalt layer and the feasibility of the testing time, it was determined that the loading (for 15 min) and unloading (for 5 min) data would be uniformly collected in the static load tests. Each test started 12 h after unloading to ensure that the deformation was fully recovered. In the static load tests, the demodulator scanning frequency was 10 Hz.
In order to consider the effect of vehicle speed and load position on the dynamic strain response of the pavement structure, five vehicle speeds of 5, 15, 30, 45 and 60 km/h were selected under an axle load of 100 kN. Five parallel tests were conducted for each test. In the dynamic load tests, the demodulator scanning frequency was 1000 Hz.
The influence of temperature was considered in the field test. The temperature sensor has been embedded into the structure layer to monitor the temperature of the measuring point. Meanwhile, a temperature gun and an ordinary thermometer were used to measure the road surface temperature and the atmospheric temperature, respectively. Then, the calibration test was performed for the road surface temperature and the atmospheric temperature. Finally, according to the calibration formula, the test results were uniformly converted into the strain values when the road surface temperature was 15 ��C.
3 Analysis of test results
3.1 Strain duration curves analysis
3.1.1 Strain duration curves under static load
Figures 4 and 5 illustrate typical loading and unloading curves of the asphalt pavement surface and base layers under static loading, respectively. It can be observed that, at corresponding points of other surface and base structures, the change curves were similar.

Figure 4 Longitudinal strain duration curves of S3 structure surface layer

Figure 5 Strain duration curves of the base layer
As it can be seen in Figure 4, the loading and unloading curves of the asphalt surface layer at different positions under static load exhibited a similar changing trend. In particular, all curves demonstrated obvious viscoelasticity and were in accordance with typical creep curves. During loading, the tensile strain increased non-linearly with time, while the increased rate of strain decreased with time. During unloading, the elastic recovery deformation, viscosity recovery deformation, and unrecoverable plastic deformation can be clearly observed. Among them, the time required for viscosity recovery deformation was much longer than that for elastic recovery deformation. In the field strain test, the elastic recovery deformation was selected to analyze the test results. In addition, the strain values from the highest to the lowest at the bottom of the surface layer at the four key test points were found at B', C', A and D', which shows that the farther away from the center of the wheel load, the lower the mechanical response value. It can be seen in Figure 5 that the longitudinal and transverse strain duration curves of the flexible ATB also exhibited obvious viscoelasticity, while the strain of the CSM base was elastic.
3.1.2 Strain duration curves under dynamic load
Under the action of vehicle load, it was found that the dynamic strain waveform at the bottom of the structural layers changed according to the relative position of the measurement point and the wheel load. Taking the S2 structure under an axial load of 100 kN and a speed of 45 km/h as an example, the longitudinal and transverse strains of the middle and base layers at different loading positions were tested. The strain waveforms are shown in Figures 6 and 7. Again, the change curves at corresponding points of other surface and base structures were similar.
The circled areas in Figure 6 indicate the strain at different loading positions when the vehicle rear axle passed through the measured cross-section.An apparent compression-tension-compression waveform can be observed in the dynamic strain curves of points A, B', C' and D'. The farther the measurement point from the wheel load center, the lower the longitudinal strain, while the compression waveform appeared only at the lateral positions of wheel load.
A significant difference in the transverse strain duration curve at the bottom of the middle surface layer was found between each position. When the rear wheel passed through the measured cross-section, the transverse strains at the bottom of the middle surface layer at the B' and C' positions exhibited mainly compression-tension waveforms, while at the A and D' positions unidirectional compression strain state was observed. The reason for this phenomenon is mainly related to the complex mechanical properties of the asphalt mixtures, the complex effects of the tires on the ground, and the relative positions between tires and measured points.

Figure 6 Strain duration curve of bottom of middle surface layer for S2 structure:

Figure 7 Strain duration curves of base layer bottom of S2 structure at point A:
It can be seen in Figure 7 that when the rear wheel passed through the measured cross-section, the longitudinal strain of the ATB upper base layer at point A exhibited a tension-compression waveform, and that of the CSM lower base layer at point A exhibited a compression-tension- compression waveform, which mainly exhibited a tension waveform and insignificant compression. The transverse strain in the ATB upper layer base demonstrated alternating tension and compression, while that of the CSM lower base layer demonstrated only a tensile waveform. Moreover, at the other test points, similar changing characteristics were observed.
As shown in Figures 6 and 7, compared to the asphalt layer, the loading and unloading strain curves of the CSM layer exhibited obvious axisymmetric characteristics; the peak strain value was smaller, and the strain response area of the curve was more extensive. This is consistent with the elastic (non-viscoelastic) properties of CSM materials and their high stiffness and strong resistance to deformation.
3.2 Study of strain field
3.2.1 Comparison and verification between measured and theoretical values
To verify the reliability of the field-measured results, the Shell asphalt pavement design software BISAR was employed to calculate the theoretical values (TVs) of longitudinal and transverse strains of the different layers of the same structure under static load. The comparison between TVs and field-measured values (MVs) of typical layers is shown in Figures 8-10. All MVs shown in the figure are the average strain value of five parallel tests respectively.
It can be seen in Figure 8 that the changing law of the longitudinal and transverse TVs was similar to that of the MVs, for both the surface and base layers. There was a difference between TVs and MVs from the numerical point of view, where the difference in the surface layer values was greater than that in the base layer values, and that of the ATB base layer values was greater than that of the CSM base layer values. This is attributed to the fact TVs are calculated based on the assumption that the pavement is an elastic layer system. However, in actual asphalt pavement structures, only the CSM base material can be regarded as an elastomer, while the strain of the asphalt surface or base exhibits obvious viscoelastic plasticity. In addition, field tests are affected by multiple factors such as environment, construction, and layout, which can induce some errors in the collected data.
It can be seen in Figure 9 that there was an excellent linear correlation between the TVs and MVs of the surface layer with a correlation coefficient of 0.87. It can be seen in Figure 10 that the error between the TVs and MVs of the ATB base layer of the S1 structure and the CSM base layer of the S3 structure was basically within the range of 0-20%, regardless of the traffic direction or the transverse direction. Therefore, using FBG sensor to test the elastic parameter of the surface layer is a stable and reliable approach, and it is feasible to use the FBG sensors to conduct field strain measurements in asphalt pavements.

Figure 8 Comparison between measured and theoretical values at different loading positions:
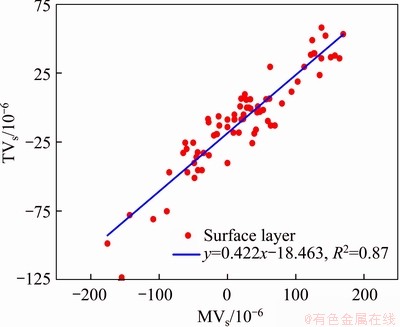
Figure 9 Relationship between MVs and TVs of surface strains of three tested asphalt structures
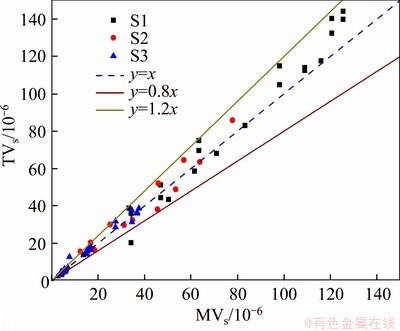
Figure 10 Error analysis on strain at bottom of base layer
3.2.2 Peak strain characteristics in horizontal direction
Under static load, the changing laws of the longitudinal and transverse peak strains at the bottom of each structural layer for the three pavements at the different loading positions are shown in Figures 11-13. All test values shown in the figure are the average strain value of five parallel tests respectively.
As it can be seen in Figures 11-13, the strain of each structural layer was distributed symmetrically at point A as the center. Due to the fact that the strain sensors of the S2 structure at the B, C, and D points were damaged, no data were collected during the test; therefore, only the strain response values at the A, B', C' and D' points are presented in this paper. The highest longitudinal and transverse strains in the surface layer of the S1 and S3 structures occurred at the center of wheel load, while the highest strain in the base layer occurred at the gap center between the two wheels. Taking the longitudinal strain of the S3 structure as an example, the strain at the center of wheel load of the upper surface layer was about 4.3, 2.0 and 23.9 times higher than that at the gap center between the two wheels, the edge of wheel load, and the lateral position of wheel load, respectively. The strain at the gap center between the two wheels of the lower base layer was about 1.06, 1.03 and 1.22 times higher than that at the center of wheel load, the edge of wheel load, and the lateral position of wheel load, respectively. The largest longitudinal strain in the surface layer of the S2 structure was found at the gap center between the two wheels, while the other strains were the same as those of the S1 and S3 structures. It is proved that the center of wheel load and the gap center between the two wheels are the most unfavorable load points of the pavement surface layer and base layer, respectively.
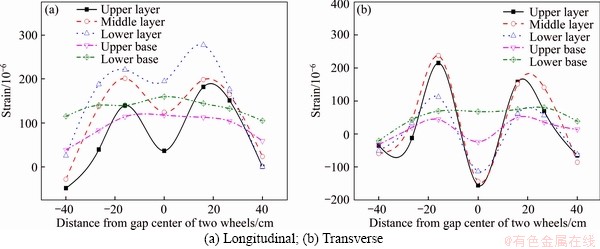
Figure 11 Law of peak strain in horizontal direction of S1 structural layer:

Figure 12 Law of peak strain in horizontal direction of S2 structural layer:

Figure 13 Law of peak strain in horizontal direction of S3 structural layer:
3.2.3 Peak strain characteristics along depth direction
Under static load, the changing law of the longitudinal and transverse peak strains at the bottom of each structural layer for the three pavements with depth is shown in Figures 14-16. All test values shown in the figures are the average strain value of five parallel tests, respectively.
It can be seen in Figures 14-16 that the strain in the surface layer was obviously higher than that in the base layer. Taking the longitudinal strain as an example, the maximum tensile strain values of the S1, S2, and S3 structures at different loading positions were located in the lower, middle, and upper layer, respectively. That is to say, from the S1 structure to S3 structure, the most unfavorable layers of the surface layer are moved from the lower layer to the fact the upper layer gradually. This is attributed to that the base layer modulus of the S3 structure was the highest, followed by that of the S2 structure and the S1 structure. Therefore, the stiffness of the base layer has a significant impact on the position of the most unfavorable layer of a pavement. The greater the stiffness of the base layer, the closer the most unfavorable layer of the surface layer based on the horizontal tensile strain index to the upper surface layer. In addition, the strain in the lower base of the three pavement structures was greater than that in the upper base. Taking the longitudinal strain of the S1 structure as an example, the strain in the lower base was 1.2-2.9 times higher than that in the upper base under different loading positions. It is proved that the lower base is the most unfavorable layer of the pavement base layer, while the modulus of the base has little effect on the position of the maximum strain in the base layer.

Figure 14 Strain magnitude along depth direction of S1 structural layer:
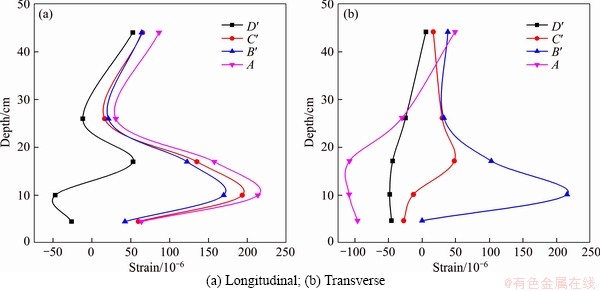
Figure 15 Strain magnitude along depth direction of S2 structural layer:

Figure 16 Strain magnitude along depth direction of S3 structural layer:
3.2.4 Study on two-dimensional strain field along horizontal and depth directions
For a more intuitive comparison, the changing law of the longitudinal and transverse strains in each layer of the three structures along the horizontal and depth directions were plotted into the two-dimensional strain field diagrams shown in Figures 17-19. In order to ensure the uniformity between figures, the data on the right axis of S2 in Figure 18 were symmetrically supplemented based on the data on the left axis of S2, which are not measured data.
Figures 17-19 illustrate the strain nephograms of the three typical structures. It can be seen that there were similar longitudinal and transverse strain field characteristics between the different structures, however, the response values were significantly different. The maximum tensile strain in the three structures was located in the surface layer, while the tensile strain in the base layer was lower. The longitudinal strain was significantly higher than the transverse strain. In addition, the relationship of the magnitude of tensile strain was between different structures was S3 (430 �̦�)>S1 (251 �̦�)>S2 (216 �̦�). This indicates that the larger the modulus of the base layer, the larger the tensile strain of the surface layer, which makes the surface layer susceptible to damages and cracks. However, the maximum tensile strain of S2 was less than that of S1, which means that the modulus of the base layer should not be too low and above a suitable lower limit. The maximum tensile strain of the surface layer increases when the modulus of the base layer is lower than this lower limit.

Figure 17 Strain field in S1 structure:

Figure 18 Strain field in S2 structure:
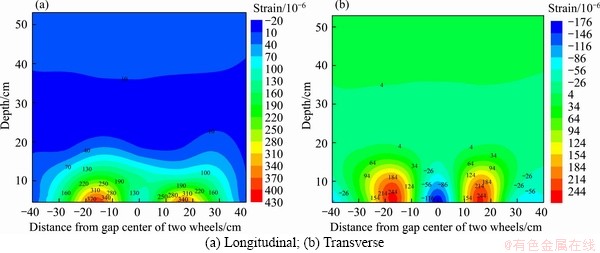
Figure 19 Strain field in S3 structure:
3.3 Relationship between peak strain and vehicle speed
From the above analysis, it can be known that the upper-middle surface layer and the lower base layer are the most unfavorable layers of a pavement structure. In addition, the tensile strain at the center of wheel load of the surface layer and the gap center between the two wheels of the base layer is the highest, which has the most significant impact on pavement durability. Therefore, the strains at the most unfavorable loading positions corresponding to the most unfavorable layers were chosen for principal analysis. At the same time, since the longitudinal strain is larger than the transverse strain, and the two types of strain exhibit similar changing laws with vehicle speed, in this paper, the longitudinal strain was selected for research.
Figures 20 and 21 show the change curves of the maximum longitudinal tensile strain in the middle surface layer and lower base layer with vehicle speed, respectively. All test values shown in the figures are the average strain value of five parallel tests respectively. It can be seen that there was an apparent nonlinear correlation between strain and vehicle speed, and the respective fitting models are given in Eqs. (1) and (2):
 (1)
(1)
 (2)
(2)
where s1 and s2 denote the longitudinal peak strains of the middle surface layer and lower base layer (10-6), respectively; v denotes the vehicle speed (km/h); a, b, and c are the fitting parameters of the middle surface layer; l, m, and n are the fitting parameters of the lower base layer.
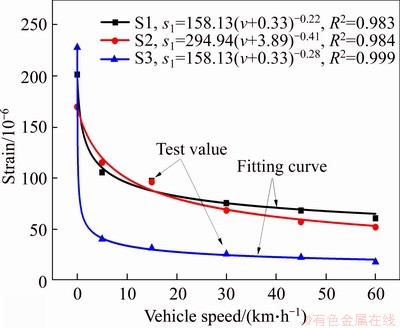
Figure 20 Longitudinal peak strain at center of wheel load in middle surface layer with vehicle speed
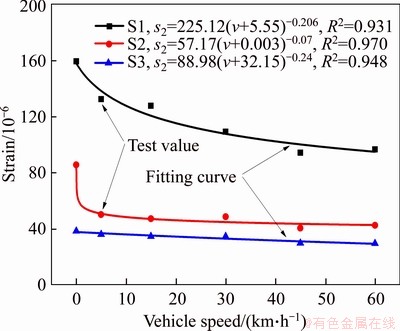
Figure 21 Longitudinal peak strain at gap center between two wheels in lower base layer with vehicle speed
As it can be seen in Figures 20 and 21, the strain response under static load was significantly larger than that under dynamic load. Taking the strain in the middle surface layer of the S1 structure as an example, the strain at a speed of 60 km/h was only 30% that of the static state. This indicates that there is a vast difference between pavement stress and strain state under actual traffic load and static load, and that the static load mode cannot accurately reflect the mechanical characteristics of pavement under actual driving load. In addition, the strains of three pavement structures and their sensitivity to vehicle speed decreased with increasing vehicle speed. When the vehicle speed increased from 0 to 5 km/h, the strain response decreased significantly. Moreover, small decreasing trends in strain response can be observed when the vehicle speed exceeded 5 km/h. Taking the middle surface strain of the S3 structure as an example, the strain decreased by 82% when the vehicle speed increased from 0 to 5 km/h, while the amplitude reduction range of strain was 8%-20% when the vehicle speed increased gradually from 5 km/h to 60 km/h. Under the same vehicle speed, the order of maximum strain in the same layer of the three pavement structures was S1, followed by S2 and S3, and the strain of S3 was significantly lower than that of the other structures.
3.4 Comparison and analysis between strains of different structures
In order to compare the differences between the strain values of the three structures, the static load and dynamic load (vehicle speeds of 5 and 45 km/h) longitudinal strains of the three structures were taken as the research objects. The comparisons are shown in Figures 22 and 23. All test values shown in the figures are the average strain value of five parallel tests respectively.
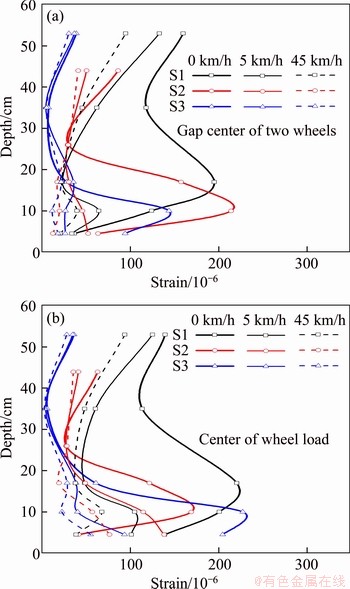
Figure 22 Comparison of longitudinal strain between different pavement structures along depth direction
As it can be seen in Figure 22, the strain of the three structures along the depth direction increased, then decreased, and finally increased again. Under dynamic load, the peak strain of the S3 structure was relatively low compared to that of the other structures. In addition, the peak strain fluctuation along the depth direction of the S3 structure was the lowest, followed by that of the S2 structure and the S1 structure. It can be seen in Figure 23 that the strain of the S3 structure was the lowest, and that of the surface layer of the S2 and S1 structures was relatively close. However, the strain of the base layer of the S2 structure was much lower than that of the S1 structure. Therefore, the best resistance to damage and structural stability under the action of vehicle load was presented by the S3 structure, followed by the S2 and S1 structures. This is attributed to that the ATB and GM layers are paved as the upper and lower base layers, respectively, in the S1 structure, thus the base layer of the S1structure has the lowest stiffness, and it exhibits a relatively high peak strain. However, the ATB and CSM road materials are paved as the upper and lower base layers, respectively, in the S2 structure, while the CSM road material is paved as the upper and lower base layers in the S3 structure. The different materials of the base layer lead to a gradual increase in stiffness, thus the peak strain at the bottom of the structure layer is getting lower and lower. To sum up, taking only the horizontal strain as the judgment standard for the three types of pavement structures, the S3 structure exhibited the most vigorous deformation resistance, followed by the S2 and S1 structures.
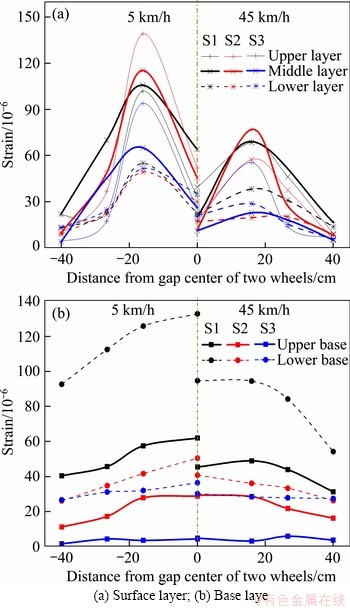
Figure 23 Comparison of longitudinal strain between different pavement structures along horizontal direction:
4 Conclusions
1) The strain curve of the asphalt layer exhibited an obvious viscoelastic behavior, while that of the CSM base layer presented elastic properties. Under the action of static and dynamic loads, there are significant differences in the longitudinal and transverse strain waveforms for the three studied typical pavement structures and different structural layers at different loading points.
2) The most unfavorable layers of asphalt pavement are the upper-middle surface layer and lower base layer, while the most unfavorable load positions on the asphalt surface layer and base layer are at the center of wheel load and the gap center between the two wheels, respectively. With the increase of base layer modulus, the most unfavorable layer of the surface layers gradually moves from the lower surface layer to the upper-middle surface layer.
3) There is an obvious power function relationship between longitudinal strain and vehicle speed for the three types of pavements.
4) Based on the field test results and verification, the semi-rigid base asphalt pavement can be considered as the more durable pavement type.
The stress monitoring is critical to the health of the pavement structure. In future works, it will be tried to develop suitable high-precision sensors for testing the stress characteristics of asphalt pavements, and them directly measure the stress response.
Contributors
PAN Qin-xue provided the idea and the field strain data, and edited the draft of manuscript. ZHENG Ce-ce conducted the literature review, and wrote the first draft of the manuscript and analyzed the measured data. LU Song-tao, QIAN Guo-ping, and ZHANG Jun-hui participated the field testing and analyzed the field strain data. WEN Pi-hua conducted the structural theoretical calculation. MILKOS Borges Cabrera polished the language of manuscript. ZHOU Huai-de drafted the figures of the manuscript.
Conflict of interest
PAN Qin-xue, ZHENG Ce-ce, LU Song-tao, QIAN Guo-ping, ZHANG Jun-hui, WEN Pi-hua, MILKOS Borges Cabrera, and ZHOU Huai-de declare that they have no conflict of interest.
References
[1] JIANG Ji-wang, NI Fu-jian, DONG Qiao, ZHAO Yan-jing, XU Kai. Fatigue damage model of stone matrix asphalt with polymer modified binder based on tensile strain evolution and residual strength degradation using digital image correlation methods [J]. Measurement, 2018, 123: 30-38. DOI: 10.1016/j.measurement.2018.03.037.
[2] MANNAN U A, ISLAM M R, TAREFDER R A. Effects of recycled asphalt pavements on the fatigue life of asphalt under different strain levels and loading frequencies [J]. International Journal of Fatigue, 2015, 78: 72-80. DOI: 10.1016/j.ijfatigue.2015.04.004.
[3] LV Song-tao, ZHENG Jian-long. Normalization method for asphalt mixture fatigue equation under different loading frequencies [J]. Journal of Central South University, 2015, 22(7): 2761-2767. DOI: 10.1007/s11771-015-2806-1.
[4] GUAN Zhi-guang, ZHUANG Chuan-yi, ZHANG Peng. Asphalt pavement mechanical response of accelerated pavement testing in single-axle and dual-axle loading modes [J]. Advances in Civil Engineering, 2019, 2019(2): 1-11. DOI: 10.1155/2019/3129485.
[5] PIERRE G A N, LI Yue-guang. Comparative study of French and Chinese asphalt pavement design methods [J]. Journal of Applied Sciences, 2015, 15(6): 923-928. DOI: 10.3923/jas. 2015.923.928.
[6] XIANG Ping, WANG Hua-ping. Optical fibre-based sensors for distributed strain monitoring of asphalt pavements [J]. International Journal of Pavement Engineering, 2018, 19(9): 842-850. DOI: 10.1080/10298436.2016.1211872.
[7] ASSOGBA O C, SUN Zhi-qi, TAN Yi-qiu, NONDE L, ZHENG Bin. Finite-element simulation of instrumented asphalt pavement response under moving vehicular load [J]. International Journal of Geomechanics, 2020, 20(3): 04020006. DOI: 10.1061/(asce)gm.1943-5622.0001616.
[8] WANG Hua-ping, XIANG Ping, JIANG Li-zhong. Optical fiber sensing technology for full-scale condition monitoring of pavement layers [J]. Road Materials and Pavement Design, 2018: 1-16. DOI: 10.1080/14680629.2018.1547656.
[9] WANG Hua-ping, XIANG Ping, JIANG Li-zhong. Optical fiber sensor based in-field structural performance monitoring of multilayered asphalt pavement [J]. Journal of Lightwave Technology, 2018, 36(17): 3624-3632. DOI: 10.1109/ jlt.2018.2838122.
[10] QUINTNA J A, CARRION F J, CRESPO S E, BONILLA V, GARNICA P, PEREZ A. SHM and evaluation of a continuous reinforced concrete pavement [J]. Journal of Civil Structural Health Monitoring, 2016, 6(4): 681-689. DOI: 10.1007/s13349-016-0189-0.
[11] XIE Jian-guang, LI Hua, GAO Lei, LIU Ming-xi. Laboratory investigation of rutting performance for multilayer pavement with fiber Bragg gratings [J]. Construction and Building Materials, 2017, 154: 331-339. DOI: 10.1016/j.conbuildmat. 2017.07.233.
[12] TAN Yi-qiu, WANG Hai-peng, MA Shao-jun, XU Hui-ning. Quality control of asphalt pavement compaction using fibre Bragg grating sensing technology [J]. Construction and Building Materials, 2014, 54: 53-59. DOI: 10.1016/ j.conbuildmat.2013.12.032.
[13] ASSOGBA O C, TAN Yi-qiu, SUN Zhi-qi, LUSHINGA N, ZHENG Bin. Effect of vehicle speed and overload on dynamic response of semi-rigid base asphalt pavement [J]. Road Materials and Pavement Design, 2019: 1-31. DOI: 10.1080/14680629.2019.1614970.
[14] ASSOGBA O C, TAN Yi-qiu, ZHOU Xing-ye, ZHANG Chao, ANATO J N. Numerical investigation of the mechanical response of semi-rigid base asphalt pavement under traffic load and nonlinear temperature gradient effect [J]. Construction and Building Materials, 2020, 235: 117406. DOI: 10.1016/j.conbuildmat.2019.117406.
[15] DONG Ze-jiao, MA Xian-yong, GONG Xiang-bing, OESER M. Theoretical evaluation of the measurement accuracy of fiber Bragg grating strain sensors within randomly filled asphalt mixtures based on finite element simulation [J]. Structural Control and Health Monitoring, 2017, 25(1): e2057. DOI: 10.1002/stc.2057.
[16] DONG Zhong-hong, NI Feng-ying. Dynamic model and criteria indices of semi-rigid base asphalt pavement [J]. International Journal of Pavement Engineering, 2014, 15(9): 854-866. DOI: 10.1080/10298436.2014.893322.
[17] DONG Zhong-hong, XU Quan-liang, LU Peng-min. Dynamic response of semi-rigid base asphalt pavement based on accelerated pavement test [J]. China Journal of Highway and Transport, 2011, 24(2): 5-9. (in Chinese)
[18] ZHANG Jing, WEI Lian-yu, MA Shi-bin, LI Na, ZHANG Yi-jie. Experiments and analysis on the mechanical response of the semi-rigid substrate using fiber bragg grating sensing technology [J]. Chinese Journal of Sensors and Actuators, 2016, 29(3): 326-331. (in Chinese)
[19] ZHANG Jing, WEI Lian-yu, MA Shi-bin, WANG Tao. Field test and numerical simulation of dynamic response of semi-rigid base asphalt pavement under moving vehicle load [J]. Journal of Highway and Transportation Research and Development, 2016, 33(10): 19-24. (in Chinese)
[20] PAN Qin-xue, ZHENG Jian-long, YANG Bo, ZHA Xu-dong, LIU Hong-fu. Field prediction method and experiment on creep response of asphalt pavement [J]. China Journal of Highway and Transport, 2017, 30(9): 10-17. (in Chinese)
[21] PAN Qin-xue, ZHENG Jian-long, YANG Bo, LIU Hong-fu. Mechanical response of asphalt pavement under driving conditions by fiber bragg grating optical sensing technology [J]. China Civil Engineering Journal, 2017, 50(4): 129-136. (in Chinese)
[22] ALTARAWNEH M, HUANG Y. In-pavement fiber Bragg grating sensors for high-speed weigh-in-motion measurements [C]// Society of Photo-Optical Instrumentation Engineers (SPIE) Conference Series, 2017.
[23] PATRICIA K D M, WIM V D B, CEDRIC V. Fiber Bragg grating sensors in three asphalt pavement layers [J]. Infrastructures, 2018, 3(2): 16. DOI: 10.3390/ infrastructures3020016.
[24] NOSENZO G, WHELAN B E, BRUNTON M, KAY D, BUYS H. Continuous monitoring of mining induced strain in a road pavement using fiber Bragg grating sensors [J]. Photonic Sensors, 2012, 3(2): 144-158. DOI: 10.1007/ s13320-012-0077-0.
[25] RAEESI R, SOLTANI A, KING R, DISFANI M M. Field performance monitoring of waste tire-based permeable pavements [J]. Transportation Geotechnics, 2020, 24: 100384. DOI: 10.1016/j.trgeo.2020.100384.
[26] FRANCOIS A, ALI A, MEHTA Y. Evaluating the impact of different types of stabilised bases on the overall performance of flexible pavements [J]. International Journal of Pavement Engineering, 2019, 20(8): 938-946. DOI: 10.1080/ 10298436.2017.1366766.
[27] PEREIRA P, PAIS J. Main flexible pavement and mix design methods in Europe and challenges for the development of an European method [J]. Journal of Traffic and Transportation Engineering (English Edition), 2017, 4(4): 316-346. DOI: 10.1016/j.jtte.2017.06.001.
[28] PAPADOPOULOS E, SANTAMARINA J C. Inverted base pavements: Construction and performance [J]. International Journal of Pavement Engineering, 2017, 20(6): 697-703. DOI: 10.1080/10298436.2017.1326237.
[29] JTG F40-2004. The Chinese Technical Specification for Construction of Highway Asphalt Pavements [S]. Beijing, China, 2004. (in Chinese)
(Edited by HE Yun-bin)
���ĵ���
��������·��Ӧ����Ӧ���ֳ�ʵ���о�
ժҪ��Ϊ�˽�ʾ����·���ڳ������������µ���ѧ��Ӧ�仯���ɣ�Ϊ�;���·������ṩ�ο������ù��˹�դ���м����������Ի���(S1)�����ʽ����(S2)������Ի���(S3)3�ֵ�������·��ṹ��չ�˶����������µ�Ӧ���ֳ��������飬������·��Ӧ����ˮƽ����ȷ����Ӧ�䳡�仯���ɡ����������������㼰�»����Ϊ����·�������λ�����⣬���ͻ����������ص�λ�ֱ�Ϊ�������ĺ���϶���ģ����Ż���ģ�������ӣ���������λ���������������������㣻��ʾ�˽ṹ��Ӧ���복��֮����ݺ�����ϵ�����������·��ṹ������Ի�������·��ṹӦ��ֵ��С�������Ϊ�;���·�����ѡ�ṹ���͡�
�ؼ��ʣ�����·�棻Ӧ�䣻��ʱ���ߣ����ص�λ�����٣����˹�դ������
Foundation item: Projects(51908071, 51708071) supported by National Natural Science Foundation of China; Project(2020JJ5975) supported by the Natural Science Foundation of Hunan Province, China; Project(18C0194) supported by the Scientific Research Project of Education Department of Hunan Province, China; Project(kfj190301) supported by Open Fund of Key Laboratory of Road Structure and Material of Ministry of Transport (Changsha University of Science & Technology), China
Received date: 2020-04-19; Accepted date: 2020-10-13
Corresponding author: PAN Qin-xue, PhD, Lecturer; Tel: +86-15616182641; E-mail: pqx123456789pqx@163.com; ORCID: https:// orcid.org/0000-0002-6546-0441
Abstract: In order to reveal the changing law of the mechanical response of asphalt pavements under the action of vehicle load and provide references for the design of durable pavements, three typical asphalt pavement structures with flexible base (S1), combined base (S2), and semi-rigid base (S3) were selected to perform field strain tests under static and dynamic load using the fiber Bragg grating optical sensing technology. The changing characteristics of the strain field along the horizontal and depth directions of pavements were analyzed. The results indicate that the most unfavorable asphalt pavement layers were the upper-middle surface layer and the lower base layer. In addition, the most unfavorable loading positions on the surface layer and the base layer were the center of wheel load and the gap center between two wheels, respectively. The most unfavorable layer of the surface layers gradually moved from the lower layer to the upper layer with the increase of base layer modulus. The power function relationships between structural layer strain and vehicle speed were revealed. The semi-rigid base asphalt pavement was the most durable pavement type, since its strain value was lower compared to those of the other structures.
