NO adsorption and temperature programmed desorption on K2CO3 modified activated carbons
��Դ�ڿ������ϴ�ѧѧ��(Ӣ�İ�)2018���10��
�������ߣ����� ����� ����ΰ LI Bing��� �Ŵ���
����ҳ�룺2339 - 2348
Key words��activated carbon; potassium carbonate; modification; NO adsorption; temperature programmed desorption
Abstract: Fuel cell stacks as the automotive power source can be severely poisoned by a trace amount of NOx in atmosphere, which makes it necessary to provide clean air for fuel cell vehicles. In this work, activating commercial activated carbons with K2CO3 for the large enhancement of NO capture was studied. K2CO3 modified activated carbons (K2CO3 ACs) were prepared by impregnating activate carbons in K2CO3 solution under ultrasound treatment, followed by temperature programmed baking at 800 oC. The dynamic NO flow tests on K2CO3 ACs at room temperature indicated that NO adsorption capacity reached the maximum (96 mg/g) when K2CO3 loading was 19.5 wt%, which corresponded to a specific surface area of 1196.1 m2/g and total pore volume of 0.70 cm3/g. The ten-fold enhancement of NO adsorption on K2CO3 ACs compared to the unimpregnated activated carbon was mainly attributed to the formation of potassium nitrite, which was confirmed by FTIR and temperature programmed desorption measurements. Regeneration tests of NO adsorption on the optimum sample revealed that 76% of the NO adsorption capacity could be remained after the fourth cycle.
Cite this article as: YANG Dai-jun, MA Xiao-wei, LV Hong, LI Bing, ZHANG Cun-man. NO adsorption and temperature programmed desorption on K2CO3 modified activated carbons [J]. Journal of Central South University, 2018, 25(10): 2339�C2348. DOI: https://doi.org/10.1007/s11771-018-3918-1.

J. Cent. South Univ. (2018) 25: 2339-2348
DOI: https://doi.org/10.1007/s11771-018-3918-1

YANG Dai-jun(�����)1, 2, MA Xiao-wei(����ΰ)3, LV Hong(����)1, 2, LI Bing(���)1, 2, ZHANG Cun-man(�Ŵ���)1, 2
1. School of Automotive Studies, Tongji University, Shanghai 201804, China;
2. Clean Energy Automotive Engineering Center, Tongji University, Shanghai 201804, China;
3. Department of Physics and Atmospheric Science, Dalhousie University, Halifax,Nova Scotia B3H 3J5, Canada
 Central South University Press and Springer-Verlag GmbH Germany, part of Springer Nature 2018
Abstract: Fuel cell stacks as the automotive power source can be severely poisoned by a trace amount of NOx in atmosphere, which makes it necessary to provide clean air for fuel cell vehicles. In this work, activating commercial activated carbons with K2CO3 for the large enhancement of NO capture was studied. K2CO3 modified activated carbons (K2CO3 ACs) were prepared by impregnating activate carbons in K2CO3 solution under ultrasound treatment, followed by temperature programmed baking at 800 oC. The dynamic NO flow tests on K2CO3 ACs at room temperature indicated that NO adsorption capacity reached the maximum (96 mg/g) when K2CO3 loading was 19.5 wt%, which corresponded to a specific surface area of 1196.1 m2/g and total pore volume of 0.70 cm3/g. The ten-fold enhancement of NO adsorption on K2CO3 ACs compared to the unimpregnated activated carbon was mainly attributed to the formation of potassium nitrite, which was confirmed by FTIR and temperature programmed desorption measurements. Regeneration tests of NO adsorption on the optimum sample revealed that 76% of the NO adsorption capacity could be remained after the fourth cycle.
Key words: activated carbon; potassium carbonate; modification; NO adsorption; temperature programmed desorption
Cite this article as: YANG Dai-jun, MA Xiao-wei, LV Hong, LI Bing, ZHANG Cun-man. NO adsorption and temperature programmed desorption on K2CO3 modified activated carbons [J]. Journal of Central South University, 2018, 25(10): 2339�C2348. DOI: https://doi.org/10.1007/s11771-018-3918-1.
1 Introduction
NOx (mainly NO and NO2) toxic gases, mostly emitted during the combustion of fossil fuels (by mobile and stationary sources), can cause severe environmental issues like urban smog, acid rain and tropospheric ozone [1�C3]. Fuel cell vehicles are a promising substitute for traditional internal combustion engine (ICE) vehicles due to its high energy efficiency and zero air pollution. However, a subsequent issue associated with the application of fuel cell vehicles is the negative impact of NOx on proton exchange membrane fuel cells. According to previous studies, the presence of NOx in low concentration can significantly reduce the power efficiency of fuel cells by poisoning the cathode Pt/C catalyst. For example, 1��10�C6 of NO2 was able to reduce the voltage of proton exchange membrane fuel cells (PEMFCs) by 10% within 100 h [4]. The exposure to 5��10�C6 NO2 for 12 h could lead to 55% loss on the current of PEMFCs [5]. NOx (NO: NO2=9:1) of 140��10�C6 could cause a 30% reduction in the voltage of PEMFCs within 5 min [6]. Therefore, it is important to study the removal of NOx emitted in the atmosphere because fuel cell vehicles need to inevitably share the traffic with ICE vehicles in a long term.
Although selective catalytic reduction (SCR) of NOx with NH3 is effective at relatively high temperatures [7, 8], NOx removal by sorbents like activated carbons (ACs) is still desirable at ambient temperature considering the low cost and easy replacement [9�C13]. K2CO3, as an environmentally benign reagent, can chemically activate various carbonaceous raw materials to be ACs (as K2CO3 ACs) with well-defined pore structures [14�C24]. The consumption of carbon by K2CO3 at high temperatures is able to create macropores and/or large mesopores [16]. In addition, the intercalation of potassium vapors at temperatures above 700 ��C will further enlarge the graphitic layers of carbon and lead to well-developed micropores and/or small mesopores [25, 26]. K2CO3 ACs have been widely studied, but their ability for NOx capture was rarely reported [27]. AL-RAHBI et al [27] studied waste tire derived ACs and found that K2CO3 modification was less effective for NO adsorption than KOH modification due to the poorly developed porous structure. On the other hand, several types of K2CO3 ACs were reported to have higher specific surface areas and better porosities than KOH modified activated carbons (KOH ACs) [28�C30].
In this work, K2CO3 ACs containing different potassium loadings were characterized with TGA- mass spectrometry and N2 adsorption porosimetry. The NO dynamic flow tests on K2CO3 ACs were compared. The temperature programmed desorption and regeneration cycles on the optimum sample were also studied.
2 Experimental
2.1 Sorbent preparation
A type of commercial activated carbon (denoted as AC hereinafter, from Sinopharm Chemical Reagent Co., Ltd.) was first heat-treated in a furnace at 600 ��C for 1 h in nitrogen atmosphere to remove possibly contained volatiles. Meanwhile, a series of 0.1 mol/L to 1.5 mol/L K2CO3 solutions were prepared by dissolving the calculated amount of K2CO3 (Shanghai Guanghua Technology Co., Ltd) in 100 mL deionized (DI) water. 25 g AC was immersed in 100 mL K2CO3 solution with vigorous stir for 2 h at 45 ��C, and the solution was then treated by ultrasound for 1 h. Subsequently, the solution was drained and the AC powder was dried in a vacuum oven at 100 ��C for 24 h. The K2CO3 loading ratios (wt% AC) were determined by measuring the weight differences of ACs before and after impregnation.
The temperature programmed heat treatment of dehydrated K2CO3-containing ACs was performed to promote the reaction between K2CO3 and carbon. The heat treatment was carried out in a fixed-bed reactor with a diameter of 1.5 cm and a bed depth of 3 cm (also served for the dynamic NO flow tests). A tape heater (960 W) was wrapped outside of the reactor and the temperature of the reactor was controlled by a temperature controller. The samples were calcined at 800 ��C in helium with a heating rate of 10 ��C /min, followed by dwelling at 800 ��C for 1 h and then slowly cooled down to room temperature. Finally, five samples (labeled as KC-1 to KC-5) associated with the original AC sample were reserved in a desiccator. The textural properties of all the samples are listed in Table 1.
Table 1 Textural properties of AC and K2CO3 ACs (ST: total specific surface area; SM: micropore specific surface area; VT: total pore volume)
2.2 Sorbent characterization
N2 adsorption-desorption isotherms of AC and K2CO3AC samples were collected with a micromeritics ASAP 2020 at 77 K. Samples were degassed at 300 ��C for 5 h before the measurements. The specific surface areas of all samples were determined based on the data points at P/P0 from 0.05 to 0.3 by the brunauer-emmett-teller (BET) method, the micropore surface areas were calculated by dubinine radushkevich (DR) equation and the total pore volumes were determined from the amount of nitrogen adsorbed at the relative pressure of 0.98.
Thermal gravimetric analysis (TGA) and differential scanning calorimetry (DSC) were carried out using a TASC414 (NETZSCH). Samples loaded in an alumina crucible were heated from 25 ��C to 1000 ��C with a rate of 10 ��C/min in helium atmosphere and the effluent gases were detected by a mass spectrometer (IMSQ4-GP, ABB).
Fourier transform infrared spectroscopy (FTIR) spectra of K2CO3 AC samples were collected with an EQUINOXSS/HYPERION2000 (Bruker) in the range from 400�C4000 cm�C1.
Powder X-ray diffraction patterns of the original AC and K2CO3 AC samples were collected using a D/max-2550PC operated at a voltage of 40 kV and a current of 100 mA. The system is equipped with a Cu Ka radiation source (wavelength = 1.5408 ). Typical conditions were a scan rate of 0.02 (��)/step and a dwell time of 1.2 s/step.
2.3 Dynamic adsorption-temperature programmed desorption
The dynamic NO adsorption and temperature programmed desorption (TPD) were carried out in the same fixed-bed reactor as depicted earlier. Standard 5% NO and nitrogen (99.99%) were mixed via a four-way valve to form the NO challenge gas stream ((5200��50)��10�C6). The flow rates were controlled by mass flow controllers (Alicat Scientific). The overall flow rate was 60 mL/min. The NO adsorption capacity was calculated based on the integration of dynamic flow test curves. The mixed challenge gas stream was introduced through the reactor and the intensities of NO in the effluent gas stream were detected by mass spectrometer (IMSQ4-GP, ABB).
In TPD measurements, each sample after NO adsorption was heated to 800 ��C with a rate of 10 ��C/min in helium atmosphere, and the effluent gas stream was also monitored by mass spectrometry.
The regeneration tests were performed by repeating NO adsorption and desorption on the sample which exhibited the highest NO adsorption capacity. In the desorption process, the selected sample was heated to 700 ��C with a rate of 10 ��C/min in helium atmosphere.
2.4 Adsorption equations
The calculated NO adsorption efficiency and adsorption capacity on activated carbon adsorbents are shown in Eqs. (1)�C(3). In this work, Ts was defined as the interval between adsorption beginning and the time when effluent volume concentration of NO (C) returned to 95% of its original concentration (C0). Equivalent breakthrough time (T*) is deduced from an ideal adsorption state of NO, in which the concentration of NO increased to its original value immediately.
 (1)
(1)
 (2)
(2)
 (3)
(3)
where �� is NO adsorption efficiency, Qa is the specific adsorption capacity for NO, q0 is the flow rate (mL/min), M is the molecular weight of NO and w is the loading weight of adsorbents.
3 Results and discussion
3.1 Characterization of K2CO3 modified activated carbons (K2CO3 ACs)
A commercial AC sample was chosen for K2CO3 impregnation and its textural data are listed in Table 1. The AC sample was impregnated into K2CO3 solutions of variable concentrations from 0.1 to 1.5 mol/L, respectively, followed by ultrasound treatment. After being dried, the AC surface will be covered by K2CO3. During the temperature programmed heat treatment, K2CO3 can react with carbon via a solid-solid reaction, forming potassium vapor and CO [23].
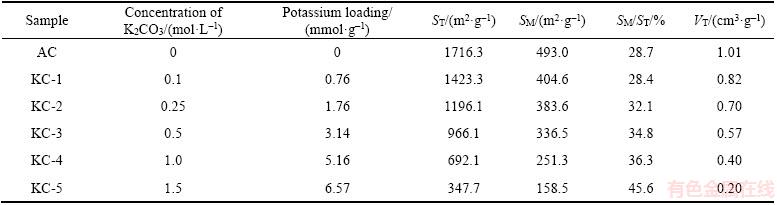
Figure 1 shows the TGA and DSC curves of unimpregnated AC and K2CO3 ACs in the temperature range of 1000 ��C. As can be seen in Figure 1(a), the mass of AC remained constant until approximately 500 ��C, afterwards it gradually decreased about 10 wt% in the temperature range from 500 ��C to 1000 ��C, due to the presence of certain volatiles. K2CO3 exhibited two sharp weight losses: one below 100 ��C and the other at around 900 ��C, corresponding to the dehydration and decomposition of K2CO3 respectively. Two endothermic peaks at 84 ��C and 890 ��C can be seen in Figure 1(b). K2CO3 ACs lost more weight than AC in the whole temperature range and the mass loss increased with the increasing K2CO3 loading from KC-1 to KC-4. No sharp endothermic peaks were observed on samples KC-1, KC-2 and KC-3, likely attributed to the reaction between K2CO3 and carbon. KC-4 and KC-5 showed almost overlapped mass loss below 800 ��C, indicating that both samples contained similar amount of K2CO3 that can react with carbon (i.e., overloaded K2CO3 impregnation in KC-5). The endothermic peak at 150 ��C for both samples was related to the dehydration of K2CO3. The decomposition of extra K2CO3 in KC-4 and KC-5 was indicated by the broad endothermic peaks at 830 and 810 ��C, respectively.
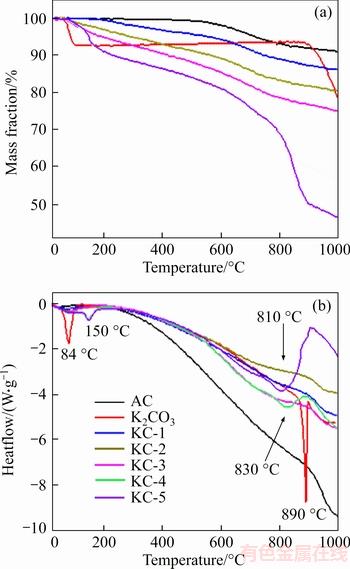
Figure 1 TGA (a) and DSC (b) of AC and K2CO3 ACs
The mechanism of K2CO3 modificaion to prepare ACs mainly follows an overall reaction in Eq. (4) and more detailed reactions in Eqs. (5) to (8) [17, 18]:
 (4)
(4)
 (5)
(5)
 (6)
(6)
 (7)
(7)
 (8)
(8)
The emission of CO during K2CO3 modification can differ from variable K2CO3 loadings in AC. Figure 2 shows the effluent evolution of CO in helium flow, which was detected by mass spectrometry following the TGA measurement of samples KC-1 to KC-5. The appearance of CO at 580 ��C was mainly due to the decomposition of K2CO3 to K2O and CO2 as in Eq. (5). Meanwhile, CO2 can be reduced by carbon to form CO (Eq. (6)). The net reaction is shown in Eq. (7). Notably, K2CO3 in AC displays much lower decomposition temperature than its pure phase, which is 890 ��C as indicated in Figure 1(b). This agrees with the observation in the literature [31]. When temperature was above 700 ��C, K2O can be further reduced by carbon to metallic potassium, resulting in the formation of more CO (Eq. (8)). In general, the potassium deposited among carbon layers should be washed out in order to create more micropores. Herein, potassium will be retained, which has significantly enhanced the NO adsorption capacity as discussed in the next section. Comparing the CO evolution of the 5 samples with variable potassium contents, it is evident that the intensity of CO increased with the amount of K2CO3 in AC. Indeed, larger amount of K2CO3 will consume more carbon, consistent with the increasing mass loss from KC-1 to KC-5 as shown in Figure 1. It is noted that each sample, except for KC-1, exhibited a broad peak in the range of 650�C700 ��C. As discussed above, more CO will be produced below 700 ��C in Eq. (7) than in Eq. (8). In particular, KC-5 shows a higher peak at about 800 ��C, which is in agreement with the sharp mass loss and the endothermic peak of KC-5 at 810 ��C in Figure 1. This is likely due to the overloading of K2CO3, in which case the excessive part of K2CO3 did not react thoroughly with carbon at low temperatures.

Figure 2 Effluent evolution of CO for K2CO3 ACs following TGA measurement
The porosity of AC can be largely affected by the potassium loading because the pores were partially or fully filled with potassium ions after heat treatment [32]. Figure 3 shows the N2 adsorption�Cdesorption isotherms of the unimpregnated AC and K2CO3 ACs. The isotherm of AC contains a hysteresis loop between P/P0 = 0.4 and 1 due to the capillary condensation of flat particle mesopores (2�C50 nm), which is consistent with the characteristics of type IV isotherm (IUPAC) [33]. As the potassium loading increased, the hysteresis loop became smaller and nearly invisible for KC-5, indicative of less mesopores in AC. The porosity data of K2CO3 ACs are shown in Table 1. The total and micropore specific surface areas (ST and SM) as well as the total pore volume (VT) were largely reduced by the increased amount of K2CO3. However, the proportion of micropores among the total pores became higher, as reflected by the increasing ratio of SM/ST ratio. In the impregnation process, K+ and CO32- ions had easier access to mesopores and macropores, so large pores can be etched more severely by K2CO3 with heat treating [32].
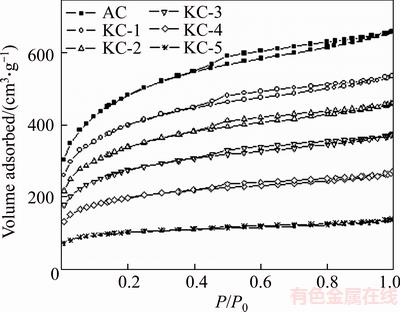
Figure 3 N2 adsorption�Cdesorption isotherms of AC and K2CO3 ACs
3.2 NO adsorption and temperature programmed desorption (TPD)
The removal of NO is herein highlighted because it is more difficult to be captured than NO2, which is soluble in water [34]. Figure 4(a) shows the adsorption efficiencies (��) of NO on the unimpregnated AC and K2CO3 ACs, which derived from their dynamic NO flow tests. The capture of NO by all the samples can be distinguished by comparing the decreasing rates of adsorption efficiencies. The unimpregnated AC exhibited poor NO adsorption efficiency, as reflected by the quick drop to less than 10% dring the beginning 40 minutes. The affinity of NO onto AC was mostly attributed to the physical adsorption in the carbon pores. As NO reached the surface of AC, it can interact with oxygen complex (the oxygen content in AC is 22.5 wt%) to form NO2 as described by Eq. (9) [35]. NO2 may be directly captured in the micropores of AC or converted to some surface complex such as C-NO2, C-ONO, C-ONO2 [36, 37]. When potassium was loaded as K2CO3 ACs, NO adsorption was apparently improved due to the occurrence of chemisorption. At the K2CO3 loading of 9.5 wt% (KC-1), the adsorption efficiency decreased to ~20% in 100 min and then more slowly to ~5% after 700 min. A higher K2CO3 loading at 19.5 wt% (KC-2) further promoted NO adsorption. The adsorption efficiency was about 40% at 200 min and declined to 15% after 800 min. Unfortunately, loading more potassium from KC-3 to KC-5 turned to lower the NO uptake as reflected by the decreasing NO adsorption efficiency. The overall adsorption capacities versus potassium contents of all 6 samples were calculated and shown in Figure 4(b). The amount of NO adsorbed increased drastically with potassium loadings for AC, KC-1 and KC-2. KC-2 demonstrates the highest NO adsorption capacity of 96 mg/g, which is nearly 10 times higher than the unimpregnated AC, indicating NO adsorption was mainly dominated by the chemisorption. This also explained the decline trend on NO capture as potassium loading increased. Overloaded potassium can block the pores and reduce the effective surface area of AC. Hence further enhancement on the uptake of NO was hindered.
 (9)
(9)
Figure 4(b) also displays the NO adsorption results on KOH AC samples that derived from our previous results [38]. It is evident that both K2CO3 and KOH modified ACs exhibited nearly overlapped trends in NO adsorption with the potassium loading. The production of K2CO3 was often associated with the heat treatment of ACs by KOH, during which KOH reacts with carbon to form K2CO3 at above ~400 ��C and until the reaction is finished near 600 ��C [39]. In this respect, K2CO3 heat treatment is superior to KOH treatment for NO removal by AC considering KOH is a strong base.
Figure 4(c) displays the effluent NO2 concentration in the NO adsorption test of KC-2. The inlet NO challenge gas stream contained ~6��10�C6 NO2, which was completely adsorbed from the onset of the flow test. Subsequently, the breakthrough occurred quickly and the NO2 concentration returned to the original level (6��10�C6)in 3 h. The evolution of NO2 suggested that NO2 was mostly adsorbed by the sorbents if significant amount was produced (the concentration of NO in the stream was ~5000��10�C6). For all reactions, the presence of active oxygen and potassium sites was believed to be very important and AC was proposed as a catalyst in the reaction process [40]. When potassium was consumed adequately by NO and NO2, the breakthrough occurred.
The mechanism of NO/NO2 adsorption on K2CO3 ACs is believed to be related to the formation of potassium nitrate and/or nitrite in the presence of oxygen functional groups [32, 41, 42]. According to previous studies, the possible reactions are summarized in Eq. (10) to Eq. (12). NO can be converted into NO2 as discussed earlier in Eq. (9), and NO2 will then react with potassium to form potassium nitrite (Eq. (10)) or potassium nitrate considering potassium was dispersed in the graphitic layers after K2CO3 modification. In the latter case, NO2 will either directly react with potassium nitrite to nitrate and release NO (Eq. (11)) or be oxidized followed by reaction with potassium (Eq. (12)). However, attempt to identify crystalline potassium nitrite or nitrate was unsuccessful.Figure 5(a) shows the powder XRD patterns of AC and KC-2 before and after NO adsorption. The parent AC exhibits two broad peaks at 2��=24�� and 43��, corresponding to the amorphous carbon [43]. After being activated by K2CO3, no specific peaks corresponding to K2CO3 were seen on KC-2, supporting the previous claim that K2CO3 no longer exists after heat treatment. No obvious crystalline diffraction for KNO2 or KNO3 was present on KC-2 after NO adsorption probably because of the highly amorphous feature of AC.
Figure 4 Dynamic NO and NO2 flow test results:(inset: Normalized NO adsorption capacity after each cycle)
 (10)
(10)
 (11)
(11)
 (12)
(12)
Figure 5(b) shows the FTIR spectra of AC and KC-2 before and after NO adsorption. The weak band at 3440 cm�C1 for the unimpregnated AC and KC-2 was due to the stretching vibration of water. The other band at 1560 cm�C1 for KC-2 can be assigned to the bending mode of water. The adsorption bands corresponding to K2CO3 (at 865,1450 and 3220 cm�C1 [44]) were not observed. After NO adsorption, KC-2 exhibits the typical bands for KNO3 and KNO2 at 1380 cm�C1 and 1260 cm�C1, which were related to the stretching vibrations of NO3�C and NO2�C respectively [44]. The bands at 3440 cm�C1 and 1560 cm�C1 for water can still be observed.
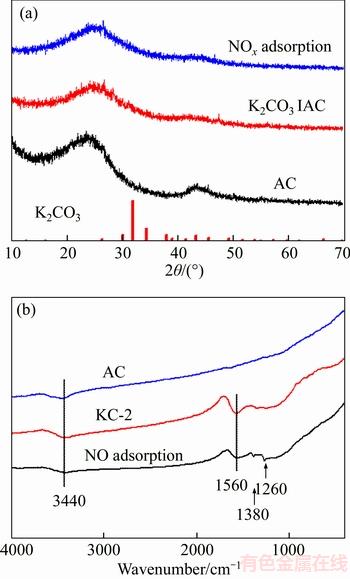
Figure 5 Powder XRD patterns (a) and FTIR spectra (b) of KC-2 before and after NO adsorption
The temperature programmed desorption (TPD) of KC-2 after NO adsorption was performed in helium atmosphere and the NO/NO2 evolution in the effluent stream monitored by mass spectrometry is shown in Figure 6. Figure 6(a) involves NO desorption at temperatures below 600 ��C. The presence of two peaks at 130 and 310 ��C agreed with Lee��s TPD results on KOH ACs after the adsorption of NO2/NO (482/18��10�C6) [41]. The weak peak at 130 ��C was attributed to the physical adsorption of NO while the strong peak at 310 ��C mainly derived from the decomposition of KNO2 as described by Eq. (13). Figure 6(b) illustrates the desorption isotherm of NO2 till 800��C and two main concentration peaks were observed. The small peak at 210 ��C corresponds to the physically adsorbed NO2. Compared to the physical desorption of NO at 130 ��C, NO2 can be more tightly bound onto the carbon surface. The very broad peak in the range of 420�C470 ��C was due to the decomposition of KNO3, as depicted by Eq. (14). The full decomposition of KNO3 was not completed at 800 ��C. According to Eq. (14), the decomposition of KNO3 emitted the same amount of NO and NO2. Consistently, the NO concentration at 400 ��C was ~70��10�C6 in Figure 6(a), comparable to the concentration of NO2 (~60��10�C6) in Figure 6(b). Note that the desorbed NO was at least two orders of magnitude higher than NO2 (8000��10�C6 NO vs 60��10�C6 NO2 at the highest concentration), indicating that the NO chemisorption on K2CO3 ACs was dominated by the formation of KNO2.
 (13)
(13)
 (14)
(14)
In order to investigate the regeneration ability of K2CO3 ACs, the cyclic NO adsorption on KC-2 was performed by activating the sample at 700 ��C after saturated adsorption of NO. K2O will start to react with carbon to form metallic potassium again at above 700 ��C as discussed previously in Eq. (5). Therefore, the regeneration temperature was set at 700 ��C in order to stabilize the dispersion of K2O. Figure 4(d) shows four NO adsorption cycles on KC-2. For each cycle, KC-2 lost part of the NO adsorption capacity compared to the previous one. After the fourth cycle, the amount of NO absorbed by KC-2 decreased to 73 mg/g, which is 76% of the original capacity (see the inset of Figure 4(d)). Two possible reasons may lead to the reduction of NO adsorption capacity on K2CO3 ACs: NO adsorbed onto the surface of ACs was not removed completely during the regeneration, or the pore structure of ACs was damaged after regeneration, which further affected the dispersion of potassium.
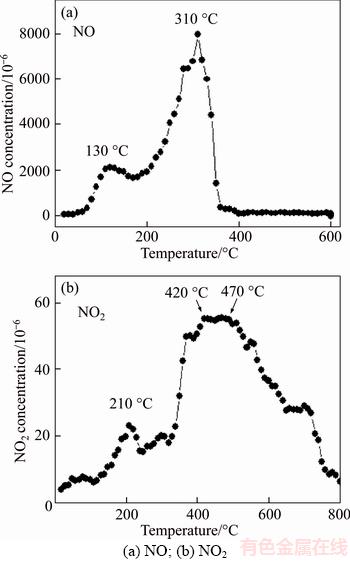
Figure 6 Temperature programmed desorption of NOx on KC-2:
4 Conclusions
K2CO3 ACs were prepared from the impregnation of AC in K2CO3 solutions followed by temperature programmed heat treatment at 800 ��C in helium atmosphere. The K2CO3 modification drastically decreased the specific surface areas and total pore volumes of ACs due to the reaction between carbon and K2CO3. On the other hand, potassium vapor penetrated and settled among carbon layers. The importance of potassium settling in AC was reflected by the improved NO dynamic adsorption on K2CO3 ACs at room temperature.
K2CO3 ACs exhibited much higher NO adsorption than the unimpregnated AC. Among all the measured samples, KC-2 with potassium loading of 19.5 wt% showed the highest adsorption capacity (96 mg/g). FTIR and powder XRD patterns demonstrated that the mechanism of NO adsorption on K2CO3 ACs mainly concerned the formation of KNO2 and a limit amount of KNO3, which decomposed at high temperatures as indicated by the TPD measurements. The adsorption capacity of K2CO3 ACs decreased to 76% after four regeneration cycles. Overloaded potassium (>19.5 wt%) significantly reduced NO uptake on K2CO3 ACs.
References
[1] BALLARI M M, HUNGER M, HUSKEN G, BROUWERS H J H. NOx photocatalytic degradation employing concrete pavement containing titanium dioxide [J]. Applied Catalysis B, 2010, 95: 245�C254.
[2] IRWIN J G, WILLIAMS M L. Acid-rain: Chemistry and transport [J]. Environmental Pollution, 1988, 50: 29�C59.
[3] LAWRENCE M G, CRUTZEN P J. Influence of NOx emissions from ships on tropospheric photochemistry and climate [J]. Nature, 1999, 402: 167�C170.
[4] JING Fen-ning, HOU Ming, SHI Wei-yu, FU Jie, YU Hong-mei, MING Ping-wen, YI Bao-lian. The effect of ambient contamination on PEMFC performance [J]. Journal of Power Sources, 2007, 166: 172�C176.
[5] MOHTADE R, LEE W K, VANZEE J W. Assessing durability of cathodes exposed to common air impurities [J]. Journal of Power Sources, 2004, 138: 216�C225.
[6] YANG Dai-jun, MA Jian-xin, XU Lin, WU Min-zhong, WANG Hai-jiang. The effect of nitrogen oxides in air on the performance of proton exchange membrane fuel cell [J]. Electrochimic Acta, 2006, 51: 4039�C4044.
[7] GUAN Bin, ZHAN R, LIN He, HUANG Zhen. Review of state of the art technologies of selective catalytic reduction of NOx from diesel engine exhaust [J]. Applied Thermal Engineering, 2014, 66: 395�C414.
[8] FU Meng-fan, LI Cai-ting, LU Pei, QU Long, ZHANG Meng-ying, ZHOU Yang, YU Min-ge, FANG Yang. A review on selective catalytic reduction of NOx by supported catalysts at 100�C300 ��C-catalysts, mechanism, kinetics [J]. Catalytic Science and Technology, 2014, 4: 14�C25.
[9] KLOSE W, RINC N S. Adsorption and reaction of NO on activated carbon in the presence of oxygen and water vapour [J]. Fuel, 2007, 86: 203�C209.
[10] NEATHERY J K, RUBEL A M, STENCEL J M. Uptake of NOx by activated carbons: Bench-scale and pilot-planting testing [J]. Carbon, 1997, 35: 1321�C1327.
[11] SHIRAHAMA N, MOON S H, CHOI K H, ENJOJI T, KAWANO S, KORAI Y, TANOURA M, MOCHIDA I. Mechanistic study on adsorption and reduction of NO2 over activated carbon fibers [J]. Carbon, 2002, 40: 2605�C2611.
[12] GHOUMA I, JEGUIRIM M, DORGE S, LIMOUSY L, GHIMBEU C M, OUEDERNI A. Activated carbon prepared by physical activation of olive stones for the removal of NO2 at ambient temperature [J]. Comptes Rendus Chimie, 2015, 18: 63�C74.
[13] POTYKOV I, OBALOV L, KUBO
 OV L, OBROUCKA K. The balancing of NO concentration fluctuations by adsorption/desorption process on activated carbon [J]. Separation and Purification Technology, 2011, 78: 245�C248.
[14] HAYASHI J, KAZEHAYA A, MUROYAMA K, WATKINSON A P. Preparation of activated carbon from lignin by chemical activation [J]. Carbon, 2000, 38: 1873�C1878.
[15] LI Xin, WANG Guang-zhi, LI Wei-guang, WANG Ping, SU Cheng-yuan. Adsorption of acid and basic dyes by sludge-based activated carbon: Isotherm and kinetic studies [J]. Journal of Central South University, 2015, 22(1): 103�C113.
[16] KILI M, APAYDIN-VAROL E, PUTUN A E. Preparation and surface characterization of activated carbons from Euphorbia rigid by chemical activation with ZnCl2, K2CO3, NaOH and H3PO4 [J]. Applied Surface Science, 2012, 261: 247�C254.
[17] MCKEE D W. Mechanisms of the alkali metal catalyzed gasfication of carbon [J]. Fuel, 1983, 62: 170�C175.
[18] ABBAS A F, AHMED M J. Mesoporous activated carbon from date stones by one-step microwave assisted K2CO3 pyrolysis [J]. Water Process Engineering, 2016, 9: 201�C207.
[19] FOO K Y, HAMEED B H. Mesoporous activated carbon from wood sawdust by K2CO3 activation using microwave heating [J]. Bioresource Technology, 2012, 111: 425�C432.
[20] GURTEN I I, OZMAK M, YAGMUR E, AKTAS Z. Preparation and characterisation of activated carbon from waste tea using K2CO3 [J]. Biomass Bioenergy, 2012, 37: 73�C81.
[21] LI Xian-fa, ZUO Yong, ZHANG Ying, FU Yao, GUO Qing-xiang. In situ preparation of K2CO3 supported Kraft lignin activated carbon as solid base catalyst for biodiesel production [J]. Fuel, 2013, 113: 435�C442.
[22] ADINATA D, DAUD W M A W, AROUA M K. Preparation and characterization of activated carbon from palm shell by chemical activation with K2CO3 [J]. Bioresource Technology, 2007, 98: 145�C149.
[23] XIANG Xiao-xia, LIU En-hui, LI Li-min, YANG Yan-jing, SHEN Hai-jie, HUANG Zheng-zheng, TIAN Ying-ying. Activated carbon prepared from polyaniline base by K2CO3 activation for application in supercapacitor electrodes [J]. Journal of Solid State Electrochemistry, 2011, 15: 579�C585.
[24] SUN Yong, YANG Gang, WANG Yun-shan. Production of activated carbon by K2CO3 activation treatment of furfural production waste and its application in gas storage [J]. Environmental Progress and Sustainable Energy, 2011, 30: 648�C657.
[25] KAPTEIJN F, JURRIAANS J, MOULIJN J A. Formation of intercalate-like structures by heat treatment of K2CO3-carbon in an inert atmosphere [J]. Fuel, 1983, 62: 249�C251.
[26] YAO Xiao-long, LI Li-qing, LI Hai-long, CHI Dong. Water vapor adsorption in activated carbon modified with hydrophilic organic salts [J]. Journal of Central South University, 2015, 22 (2): 478�C486.
[27] AL-RAHBI A S, WILLIAMS P T. Production of activated carbons from waste tyres for low temperature NOx control [J]. Waste Management, 2016, 49: 188�C195.
[28] FOO K Y, HAMEED B H. Utilization of rice husks as a feedstock for preparation of activated carbon by microwave induced KOH and K2CO3 activation [J]. Bioresource Technology, 2011, 102: 9814�C9817.
[29] JIN Xiao-juan, YU Zhi-ming, WU Yu. Preparation of activated carbon from lignin obtained by straw pulping by KOH and K2CO3 chemical activation [J]. Cellulose Chemistry Technology, 2012, 46: 79�C85.
[30] OKMAN I, KARAG Z S, TAY T, ERDEM M. Activated carbons from grape seeds by chemical activation with potassium carbonate and potassium hydroxide [J]. Applied Surface Science, 2014, 293: 138�C142.
[31] RODENAS M A L, AMOROS D C, SOLANO A L. Understanding chemical reactions between carbons and NaOH and KOH: An insight into the chemical activation mechanism [J]. Carbon, 2003, 41: 267�C275.
[32] LEE Y W, CHOI D K, PARK J W. Surface chemical characterization using AES/SAM and ToF-SIMS on KOH-impregnated activated carbon by selection adsorption of NOx [J]. Industrial & Engineering Chemistry Research, 2001, 40: 3337�C3345.
[33] SING K S W, EVERETT D H, HAUL R A W, MOSCOU L, PIEROTTI R A, ROUQU ROL J, SIEMIENIEWSKA T. Reporting physisorption data for gas/solid systems with special reference to the determination of surface area and porosity [J]. Pure and Applied Chemistry, 1985, 57: 603�C619.
[34] ZENG Zheng, LU Pei, LI Cai-ting, MAI Lei, LI Zhi, ZHANG Yun-sheng. Removal of NO by carbonaceous materials at room temperature: A review [J]. Catalysis & Science Technology, 2012, 2: 2188�C2199.
[35] MOCHIDA I, SHIRAHAMA N, KAWANO S, KORAI Y, YASUTAKE A, TANOURA M, FUJII S, YOSHIKAWA M. NO oxidation over activated carbon fiber (ACF). Part 1. Extended kinetics over a pitch based ACF of very large surface area [J]. Fuel, 2000, 79: 1713�C1723.
[36] JEGUIRIM M, TSCHAMBER V, BRILHAC J F, EHRBURGER P. Interaction mechanism of NO2 with carbon black: effect of surface oxygen complexes [J]. Journal of Analytical and Applied Pyrolysis, 2004, 72: 171�C181.
[37] STANMORE B R, TSCHAMBER V, BRILHAC J F. Oxidation of carbon by NOx, with particular reference to NO2 and N2O [J]. Fuel, 2008, 87: 131�C146.
[38] MA Xiao-wei, YANG Dai-jun, ZHOU Wei, ZHANG Cun-man, PAN Xiang-min, XU Lin, WU Min-zhong, MA Jian-xin. Evaluation of activated carbon adsorbent for fuel cell cathode air filtration [J]. Journal of Power Sources, 2008, 175: 383�C389.
[39] WANG J, KASKEL S. KOH activation of carbon-based materials for energy storage [J]. Journal of Material Chemistry, 2012, 22: 23710�C23725.
[40] CLAUDINO A, SOARES J L, MOREIRA R F P M, JOS H J. Adsorption equilibrium and breakthrough analysis for NO adsorption on activated carbons at low temperatures [J]. Carbon, 2004, 42: 1483�C1490.
[41] LEE Y W, CHOI D K, PARK J W. Performance of fixed-bed KOH impregnated activated carbon adsorber for NO and NO2 removal with oxygen [J]. Carbon, 2002, 40: 1409�C1417.
[42] LEE Y W, PARK J W, JUN S J, CHOI D K, YIE J E. NOx adsorption-temperature programmed desorption and surface molecular ions distribution by activated carbon with chemical modification [J]. Carbon, 2004, 42: 59�C69.
[43] CHEN Yao, ZHANG Xiong, ZHANG Hai-tao, SUN Xian-zhong, ZHANG Da-cheng, MA Yan-wei. High- performance supercapacitors based on a graphene-activated carbon composite prepared by chemical activation [J]. RSC Advances, 2012, 2: 7747�C7753.
[44] MILLER F A, WILKINS C H. Infrared spectra and characteristic frequencies of inorganic ions [J] Analytic Chemistry, 1952, 24: 1253�C1294.
(Edited by HE Yun-bin)
���ĵ���
K2CO3 ���Ի���̿��NO�������ͳ��������Ѹ�
ժҪ��ȼ�ϵ�����ܵ������е�NOx��Ӱ�죬����б�Ҫ��������ȼ�ϵ�������Ŀ����������о���ͨ��K2CO3 ��ǿ���û���̿����NO�����ܡ�K2CO3���Ի���̿��K2CO3 ACs����ͨ�������������µ���Һ���ջ���̿��Ȼ����800 ��������ȴ����õ��ġ�NO�������߱�������K2CO3 ��Һ��Ũ�ȴﵽ19.5 wt%ʱ��NO�������µ�����������ߣ��ɴ�96 mg/g�����൱��1196.1 m2/g�ıȱ������0.70 cm3/g���ܿ��ݡ���δ�����ԵĻ���̿��ȣ�K2CO3 ACs����������������ʮ��������ҪӦ������������ص����ɣ���Ҳ��FTIR�ͳ��������Ѹ�ʵ��������֤�������⣬����Ʒ�����ֳ�һ���Ŀ������ԣ����Ĵ�NO�������Ѹ�ʵ���ң������ܱ���76%�ij�ʼ����������
�ؼ��ʣ�����̿��̼��أ����ԣ�NO���������������Ѹ�
Foundation item: Project(2018YFB0105303) supported by the Ministry of Science and Technology of China; Project(17DZ1200702) supported by the Shanghai Science and Technology Committee, China
Received date: 2017-06-17; Accepted date: 2018-02-26
Corresponding author: LV Hong, PhD, Associate Professor; Tel: +86�C21�C69583850; E-mail: lvhong@tongji.edu.cn; ORCID: 0000- 0003-4899-1088

